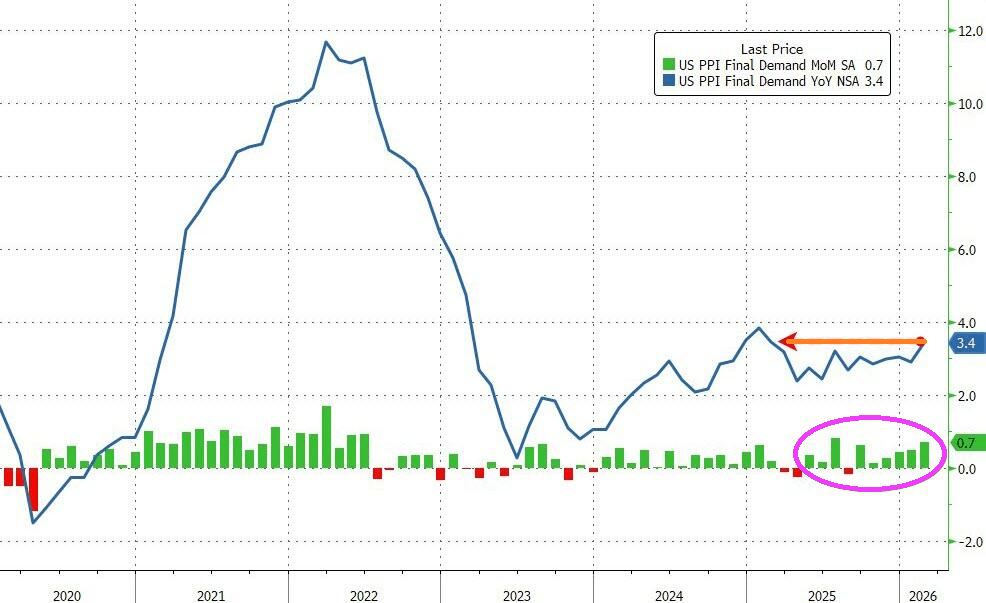
Producer prices were higher by 3.4% YoY (notably hitter than the 3.0% expected and up from the 2.9% prior). That is the hottest PPI since January 2025
Source: Bloomberg
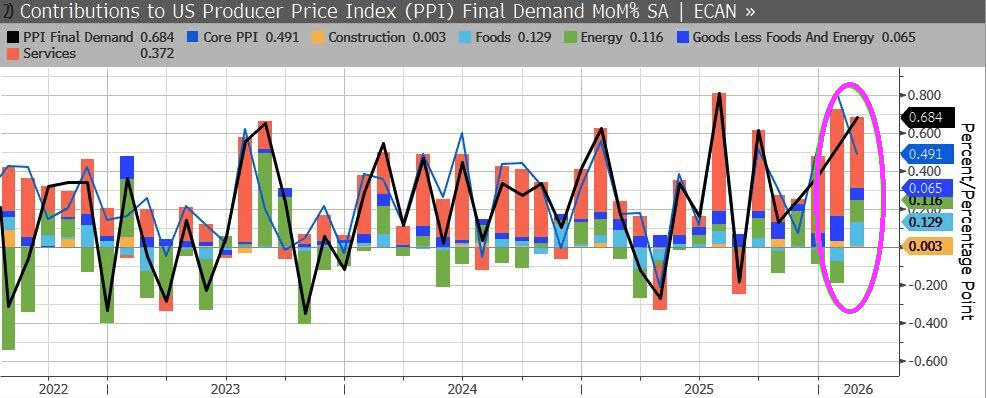
More than half of the February rise in prices for final demand can be attributed to a 0.5-percent advance in the index for final demand services. Prices for final demand goods increased 1.1 percent.
Core PPI (ex Food and Energy) also soared (+0.5% MoM) pushing core prices up by 3.9% YoY – the highest since Jan 2025.
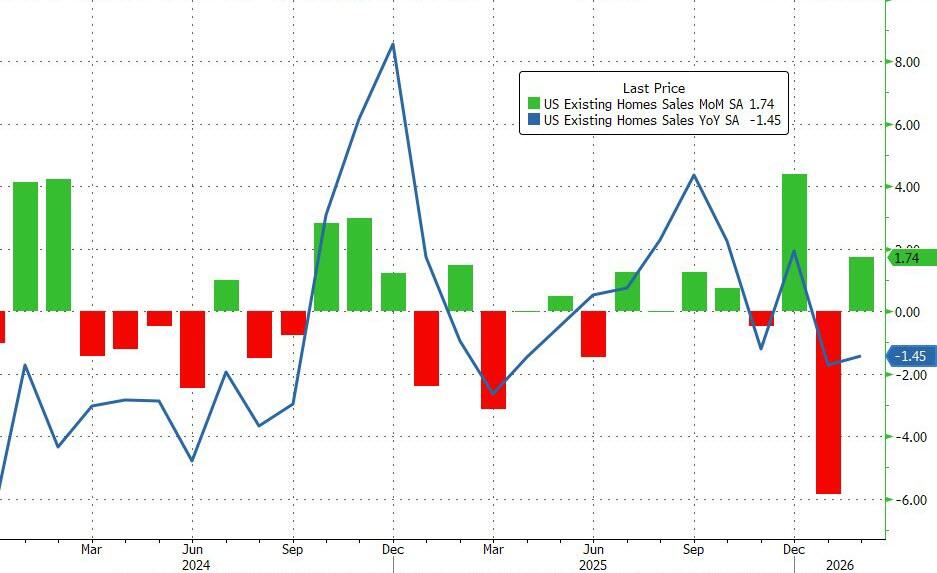
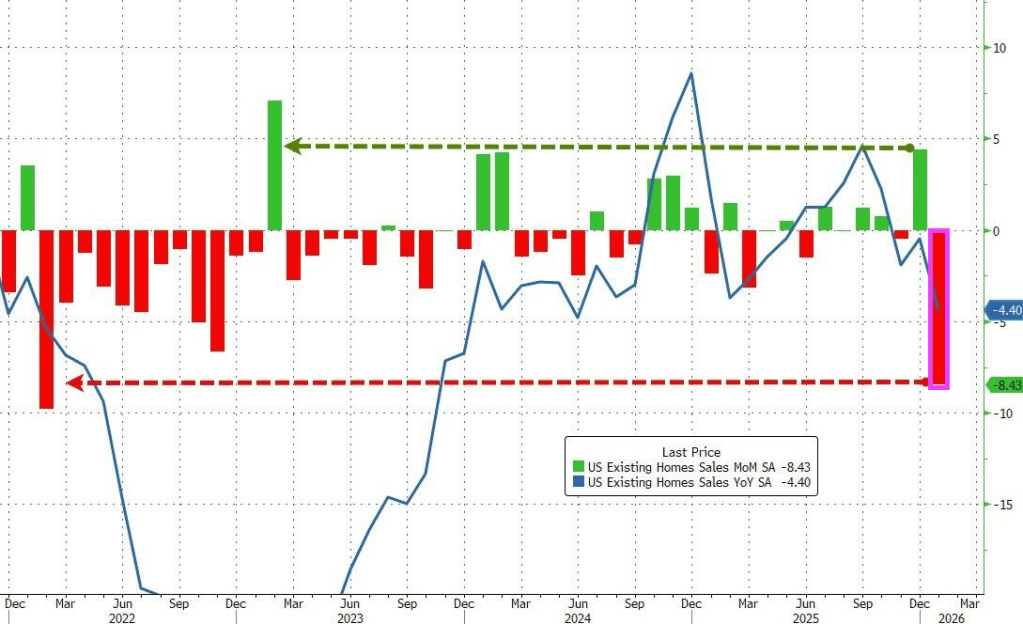
Existing homesales actually surprised to the upside, rising 1.7% MoM in February. Perhaps even more notably, January’s 8.4% MoM plunge was revised up to a slightly less crazy 5.9% MoM drop.
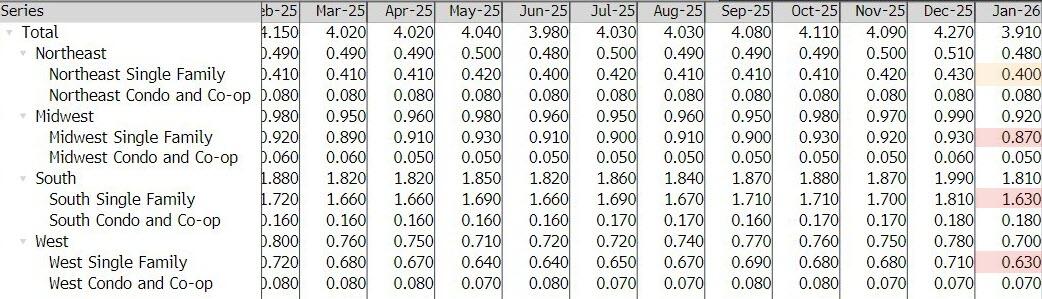
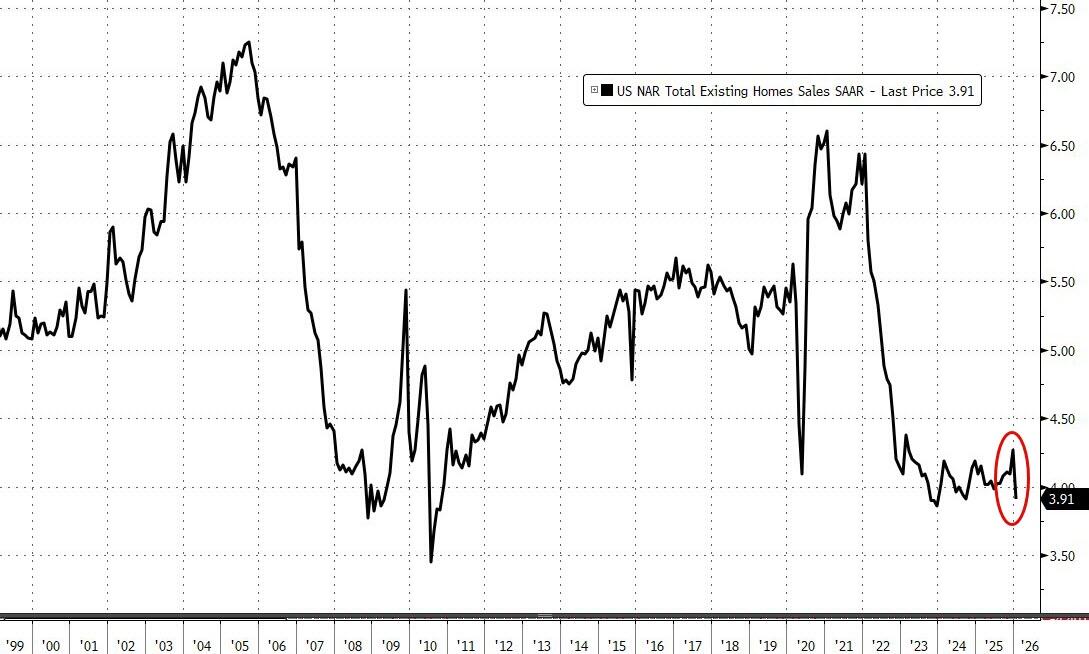
With the beat and upward revision, existing home sales were down just 1.45% YoY but SAAR topped 4mm (4.09mm) once again.
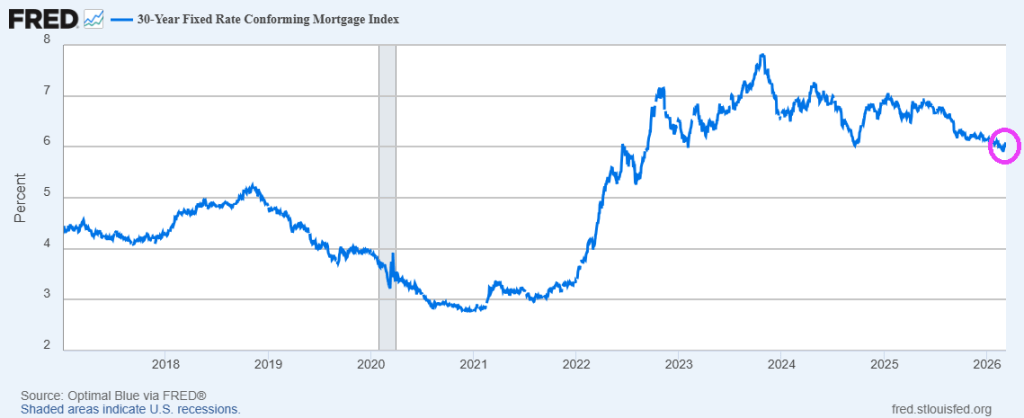
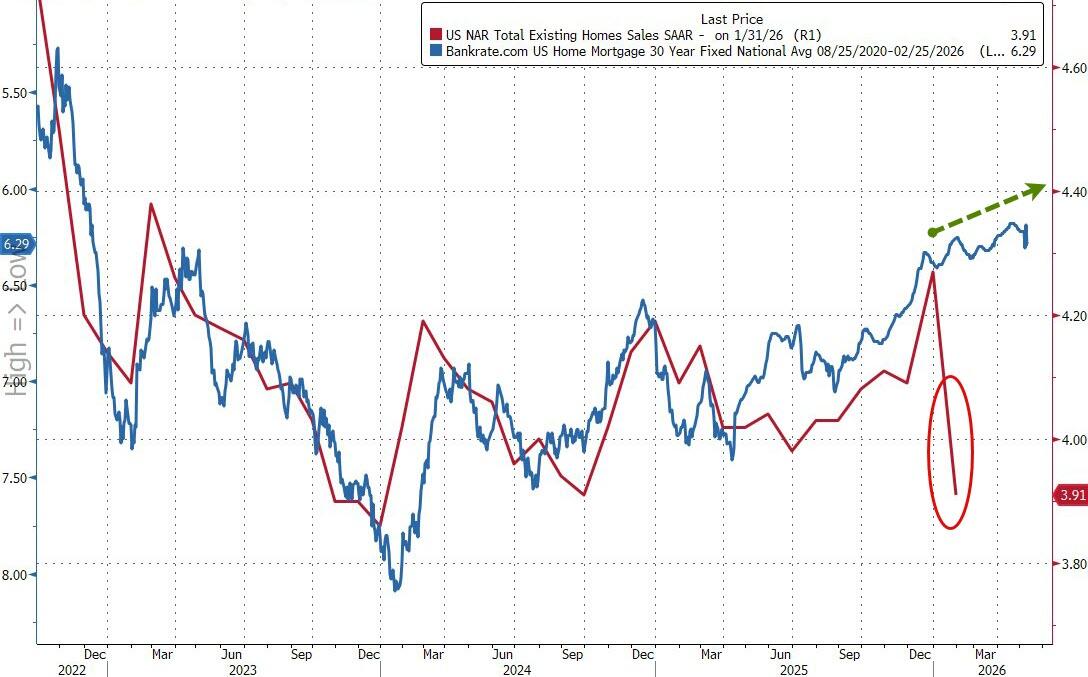
On the bright side, with mortgage rates at their lowest since 2022, existing home sales look set to continue to improve (unless Trump’s war triggers more panic in rates).
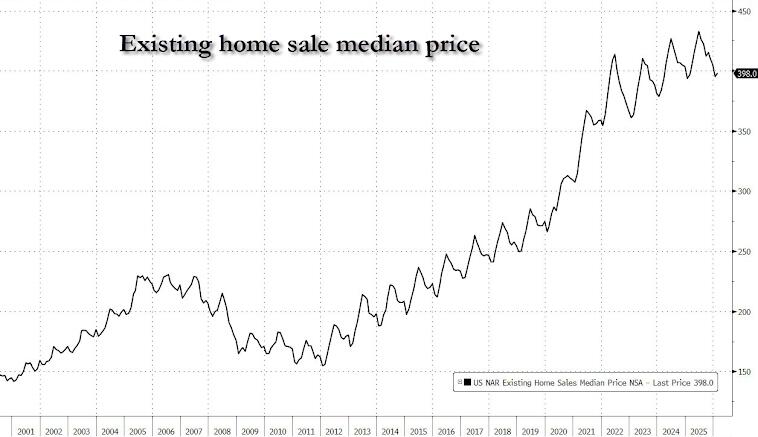
The NAR report showed the median selling price rose 0.3% from a year earlier — one of the smallest advances since the pandemic housing frenzy — to $398,000 last month.
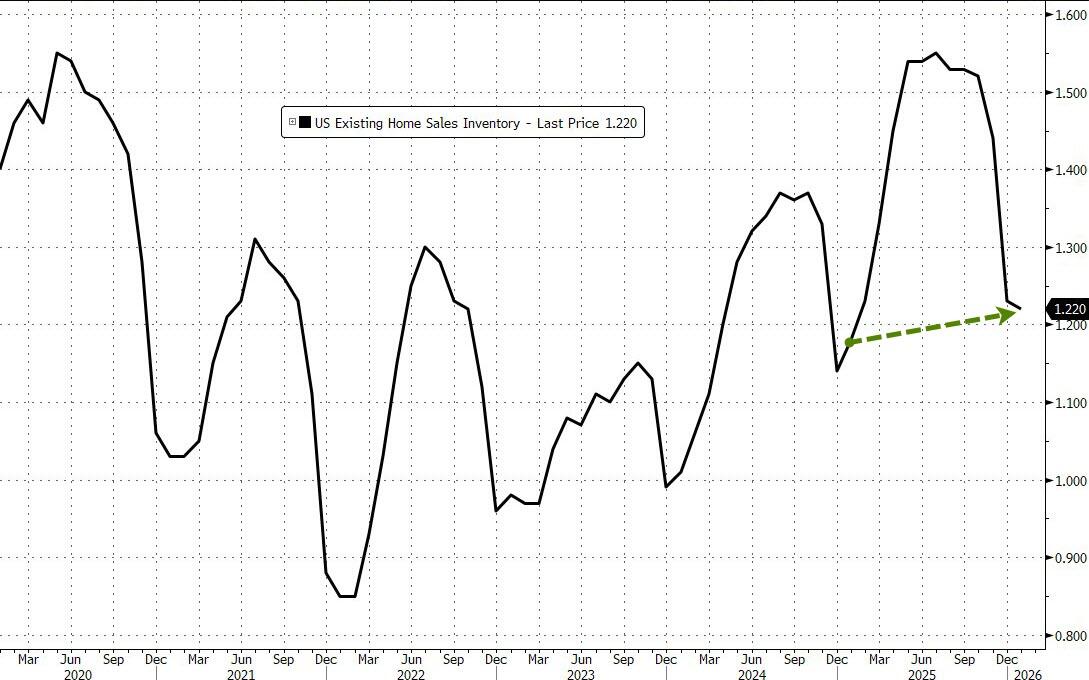
The inventory of previously owned homes increased 4.9% from a year ago to 1.29 million — the most for any February since 2020.
Mortgage rates? Up yesterday, but near lowest since 2023.
Trump has been President for 1 year and fighting against Biden and the Democrats economic misery.
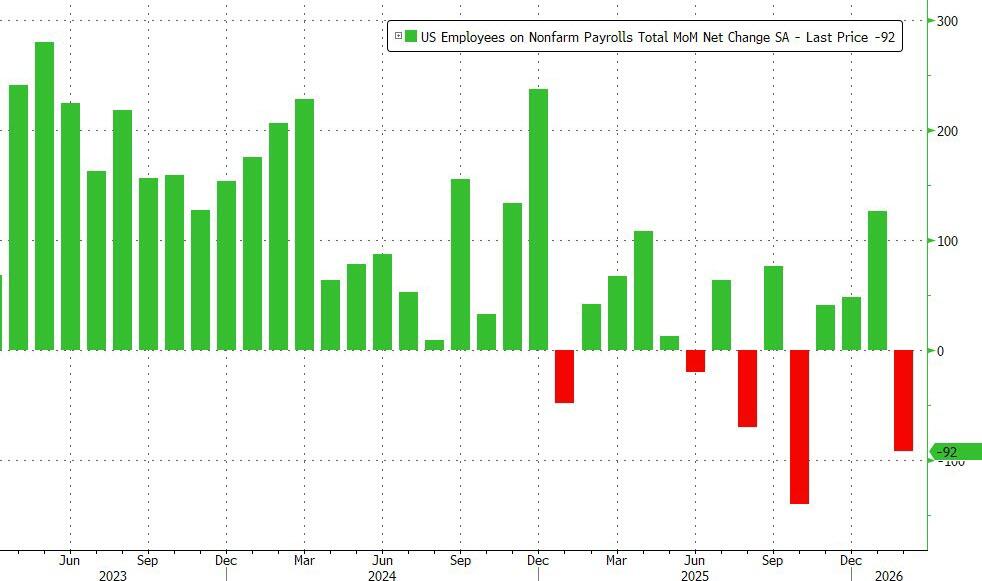
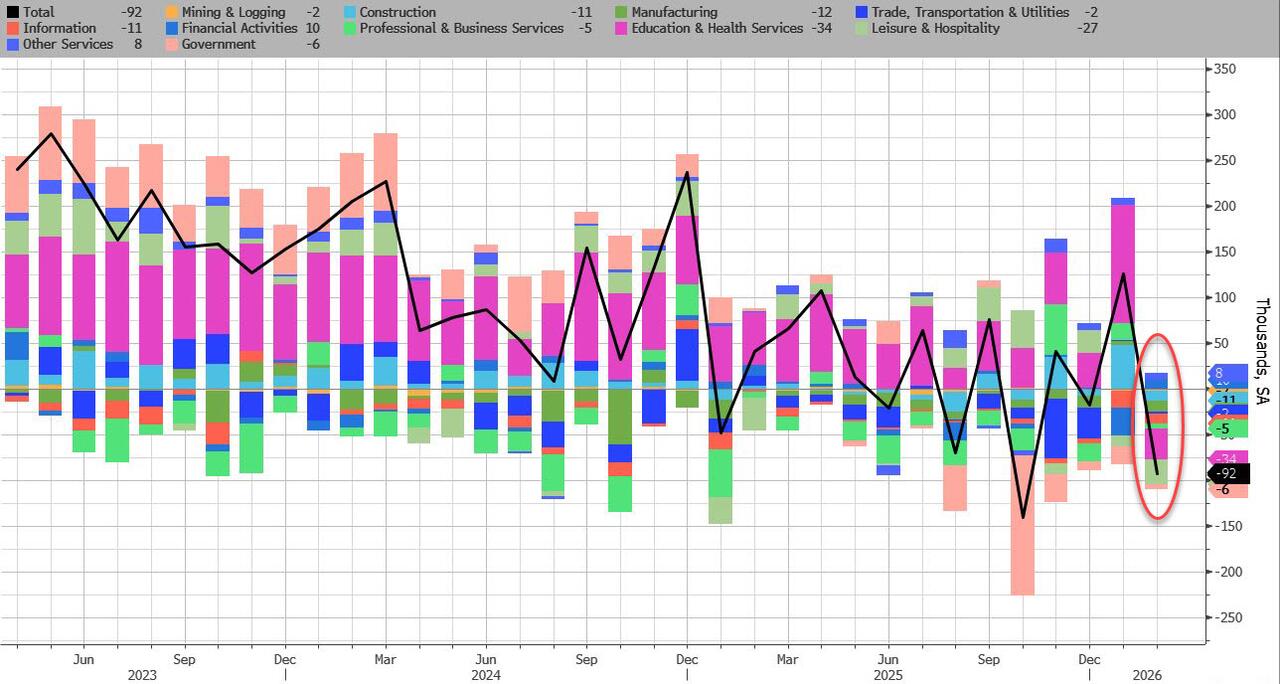
In February, the US lost 92,000 jobs, a huge drop from the downward revised 126K in January, and the second worst print since 2020 (only October’s shock -140K was worse), and this time, the massive drop can’t be dismissed as a one-time drop in government payrolls. The number of private payrolls dropped by 86K, also a huge miss to estimates of a 60K increase.
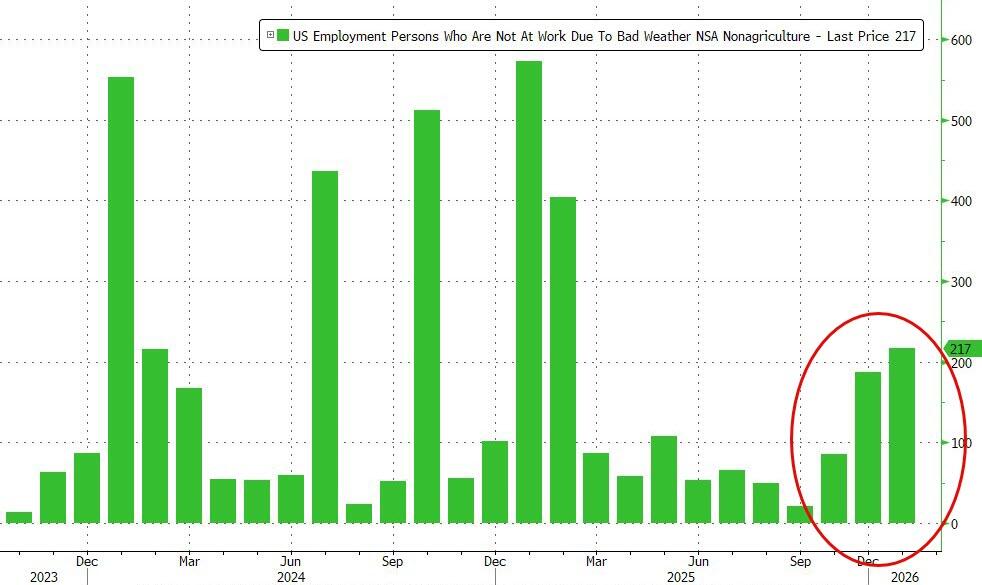
One potential mitigating factor: the number of people who were unable to work due to weather surged to 228K in February, well above last year’s level 167K, due to the powerful winter storms hitting the US.
The number of long-term unemployed (those jobless for 27 weeks or more) changed little at 1.9 million in February but is up from 1.5 million a year earlier. The long-term unemployed accounted for 25.3 percent of all unemployed people in February.
The number of people employed part time for economic reasons decreased by 477,000 to 4.4 million in February. These individuals would have preferred full-time employment but were working part time because their hours had been reduced or they were unable to find full-time jobs.
The number of people not in the labor force who currently want a job changed little in February at 6.0 million. These individuals were not counted as unemployed because they were not actively looking for work during the 4 weeks preceding the survey or were unavailable to take a job.
Among those not in the labor force who wanted a job, the number of people marginally attached to the labor force changed little at 1.6 million in February. These individuals wanted and were available for work and had looked for a job sometime in the prior 12 months but had not looked for work in the 4 weeks preceding the survey. The number of discouraged workers, a subset of the marginally attached who believed that no jobs were available for them, decreased by 109,000 in February to 366,000.
Turning to the establishment survey, which unveiled the shocking February drop, the BLS reported a broad-based decline, driven by striking employment workers:
Employment in health care decreased in February, reflecting strike activity. Employment in information and federal government continued to trend down. Payroll employment changed little on net in 2025.
Health care employment declined by 28,000 in February, following a large increase in January (+77,000). Offices of physicians lost 37,000 jobs in February, primarily due to strike activity. Hospitals added 12,000 jobs. Over the prior 12 months, health care had added an average of 36,000 jobs per month.
Employment in information continued to trend down in February (-11,000). The industry had lost an average of 5,000 jobs per month over the prior 12 months.
In February, federal government employment continued to decline (-10,000). Since reaching a peak in October 2024, federal government employment is down by 330,000, or 11.0 percent.
Employment in social assistance continued its upward trend in February (+9,000), driven by individual and family services (+12,000).
Transportation and warehousing employment changed little in February (-11,000). A job loss in couriers and messengers (-17,000) was partially offset by a gain in air transportation (+5,000). Employment in transportation and warehousing has declined by 157,000, or 2.4 percent, since reaching a peak in February 2025.
Employment showed little change over the month in other major industries, including mining, quarrying, and oil and gas extraction; construction; manufacturing; wholesale trade; retail trade; financial activities; professional and business services; leisure and hospitality; and other services.
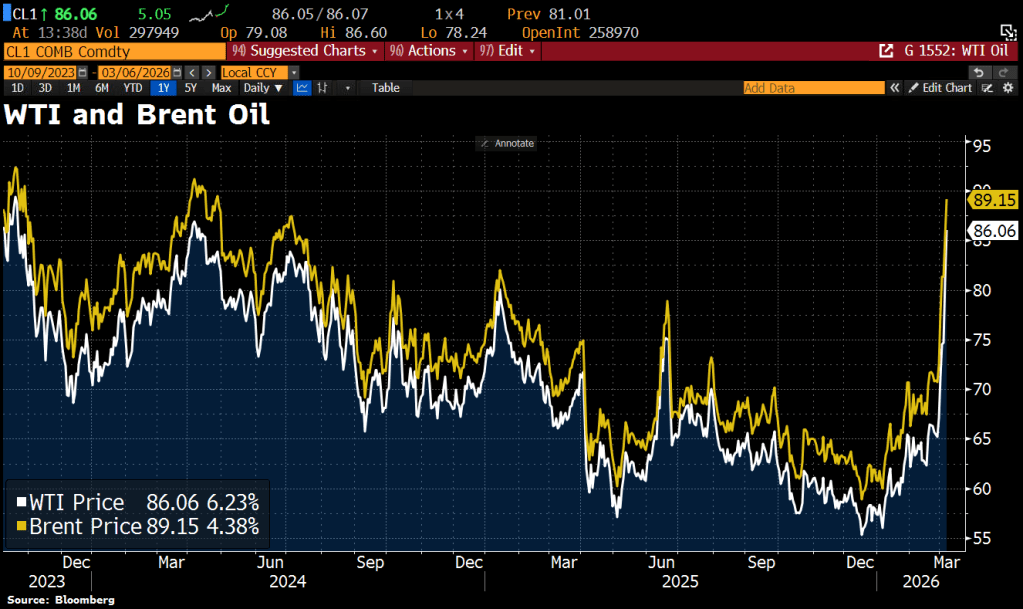
Switching to oil, we see the West Texas Intermediate and Brent Oil prices soaring on the attacks on Iran.
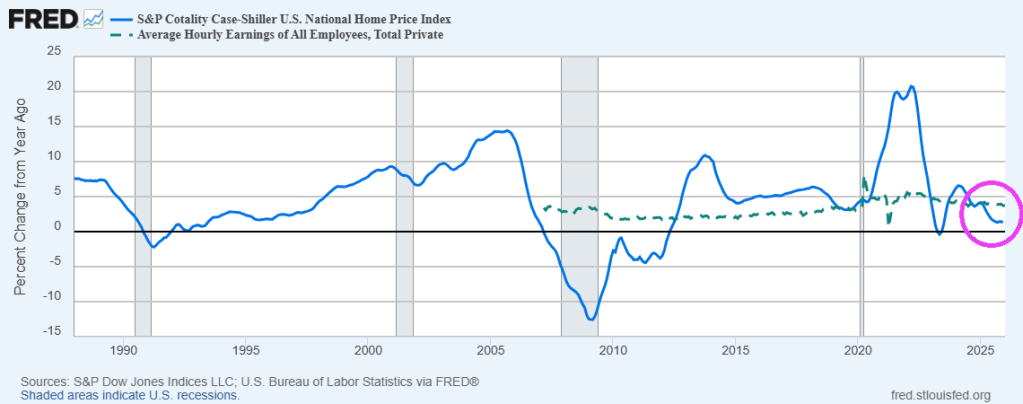
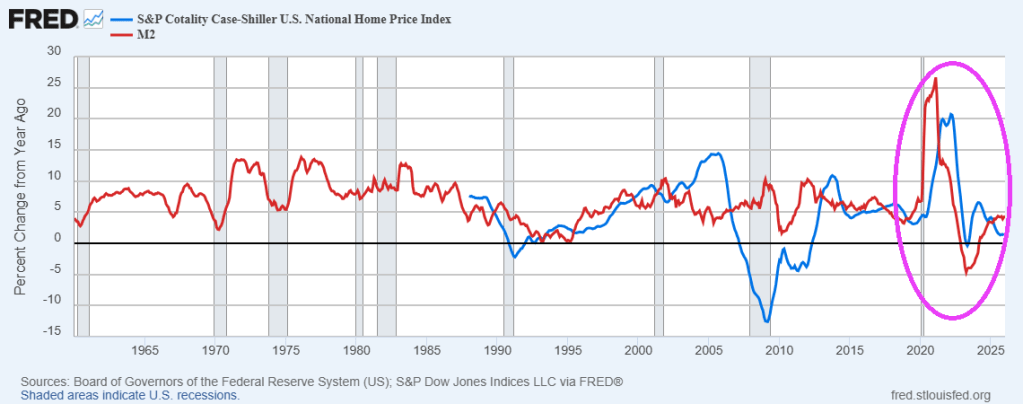
The S&P Cotality Case-Shiller U.S. National Home Price NSA Index posted a 1.3% annual gain (YoY) for December 2025, down from a 1.4% rise in the previous month. Average hourly earnings now at 3.73% YoY, higher than home price growth.
Home price growth exploded following The Federal governments’ Covid-related spending splurge.
Geographic divergence widened sharply: Chicago and New York led all markets with gains above 5%, while Tampa, Phoenix, Dallas, and Miami posted the steepest declines among markets that finished the year in negative territory.
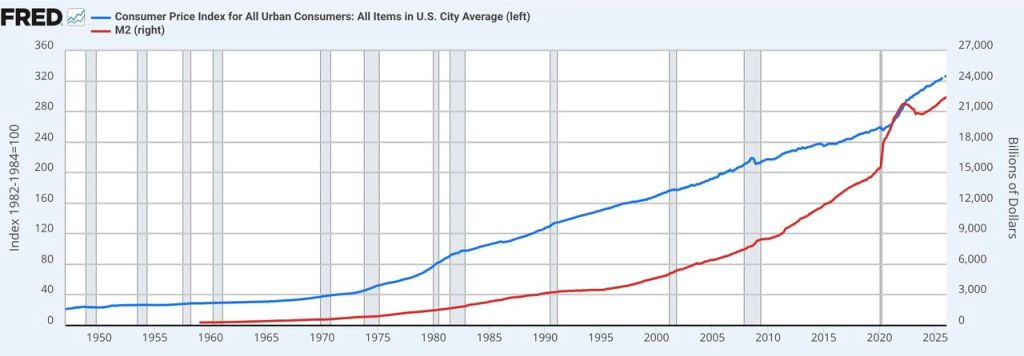
Inflation cooled significantly under Trump, but The Fed keeps printing M2!
Underlying U.S. inflation increased more than expected in December, and signs are pointing to a further acceleration in January, which would strengthen expectations that the Federal Reserve would not cut interest rates before June.
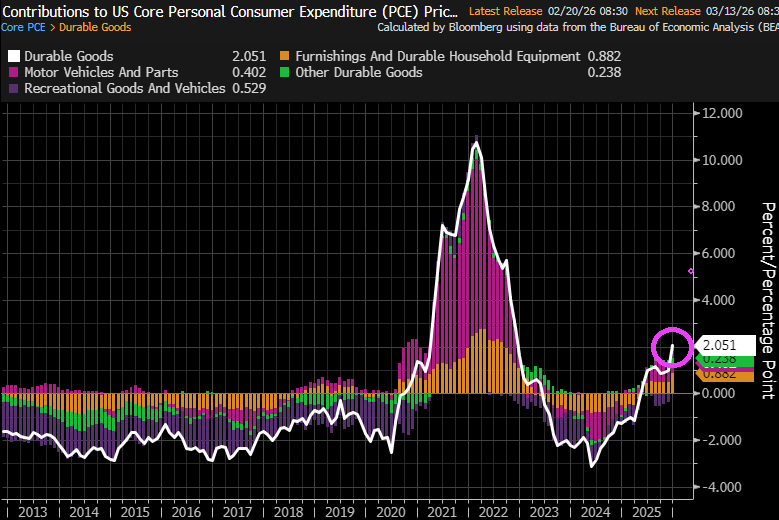
The personal consumption expenditures price index, excluding the volatile food and energy components, rose 0.4% after an unrevised 0.2% gain in November, the Commerce Department’s Bureau of Economic Analysis said on Friday. In the 12 months through December, core PCE inflation advanced 3.0% after increasing 2.8% in November.
The PCE price index increased 0.4% in December after rising 0.2% in November. PCE inflation increased 2.9% year-on-year after gaining 2.8% in November.
But in terms of contributions to the 0.4% figure is that durable goods rose 2.051%.
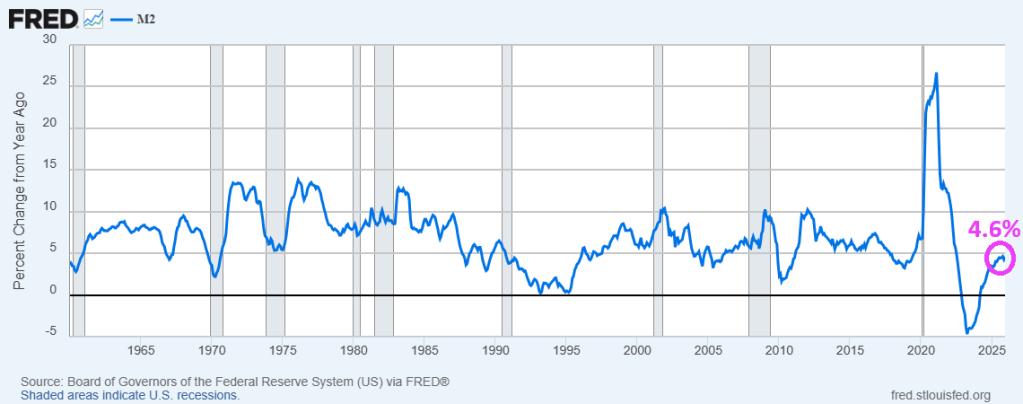
The Fed has been printing money (M2) like there is no tomorrow. With M2 growing at 4.6% YoY in December.
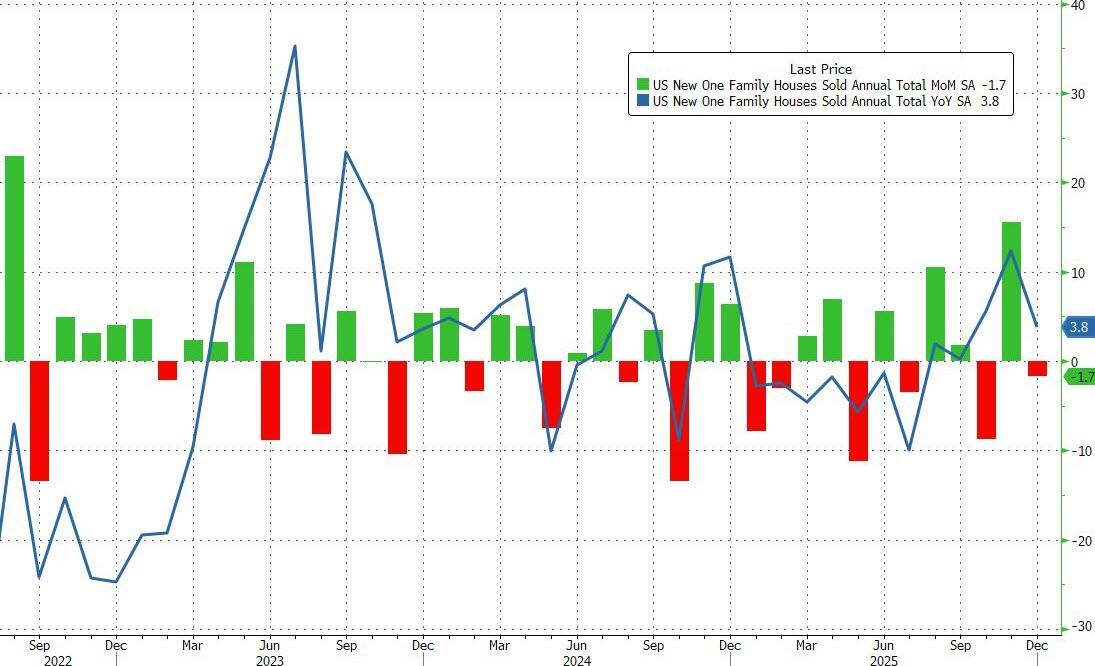
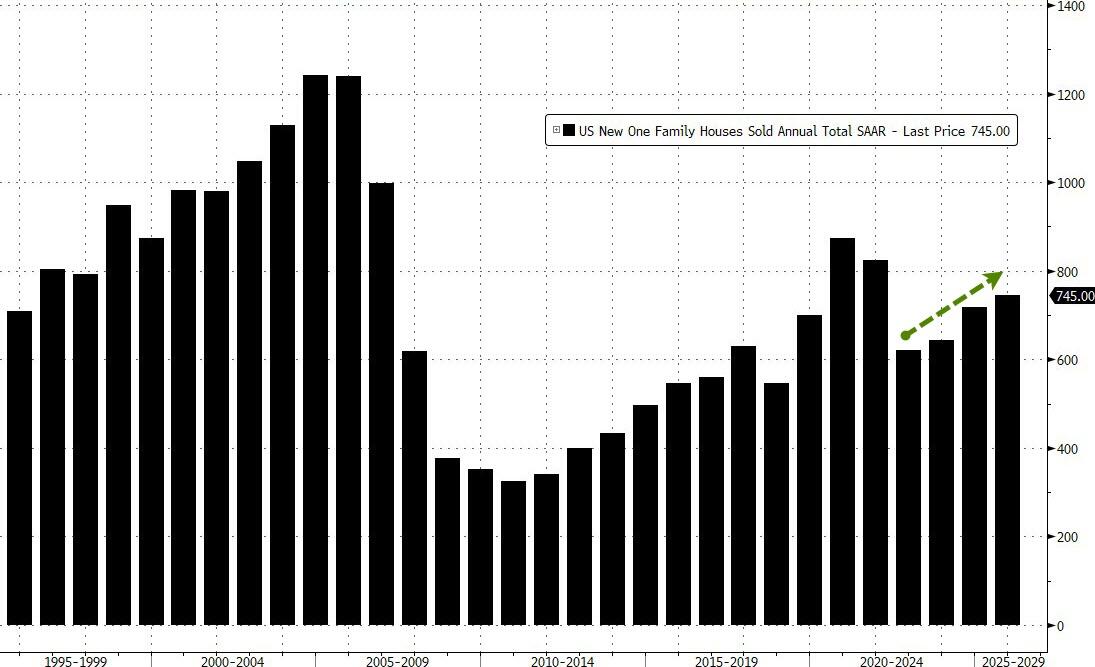
…but ended the year at 745k – the highest SAAR since 2021…
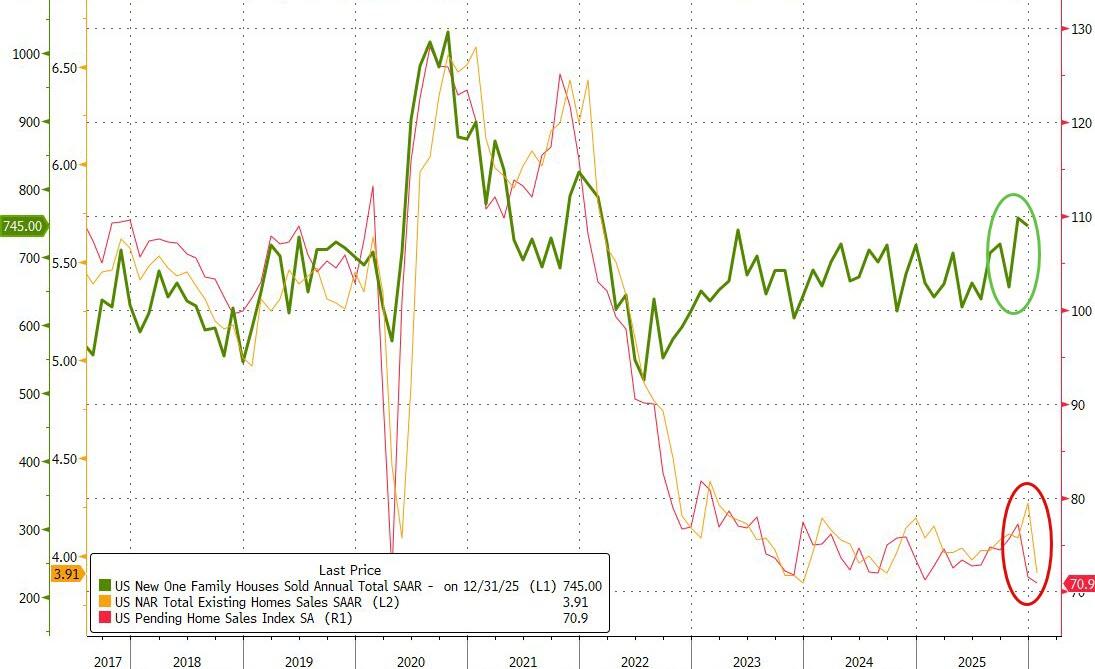
“New” home sales have notably decoupled from “used” home sales in the last few years as homebuilders incentivize buyers (reducing margins) and lower prices (reducing revenues)…
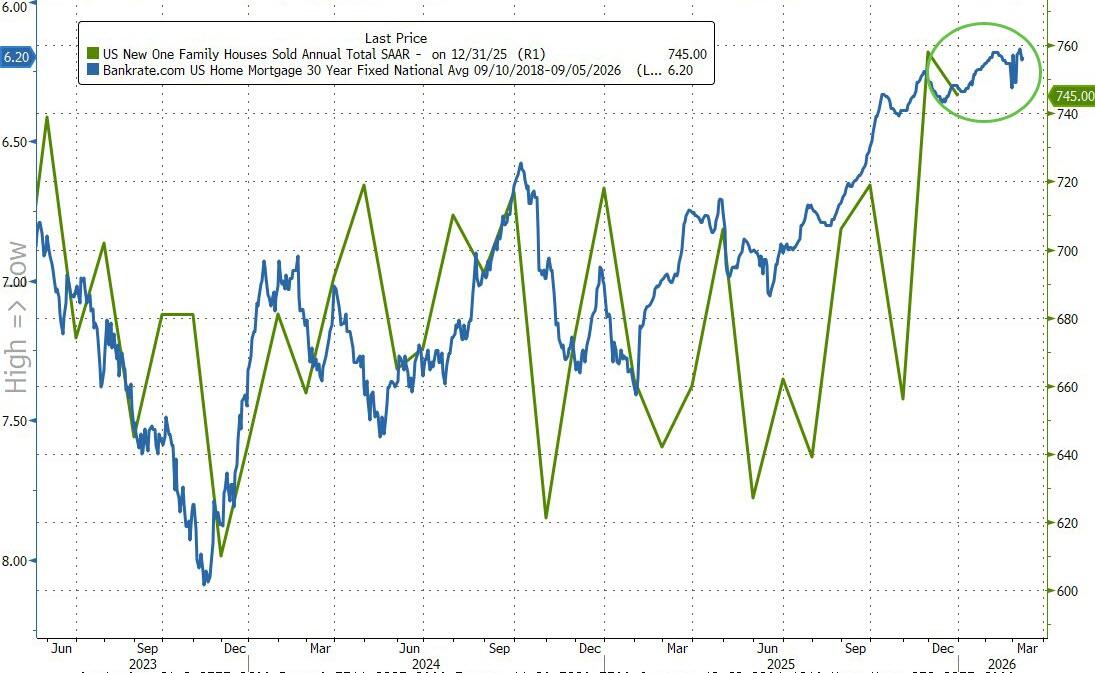
Lower mortgage rates support modest further improvements in sales…
Rate-cut expectations have surged (dovishly) higher this week (along with tumbling Treasury yields) amid a mixed macro picture (Labor market ‘good’, Retail sales bad, Housing ugly).
Today could change all that as CPI for January prints with risk skewed to the upside. January brings annual resets and they tend to surprise on the high side.
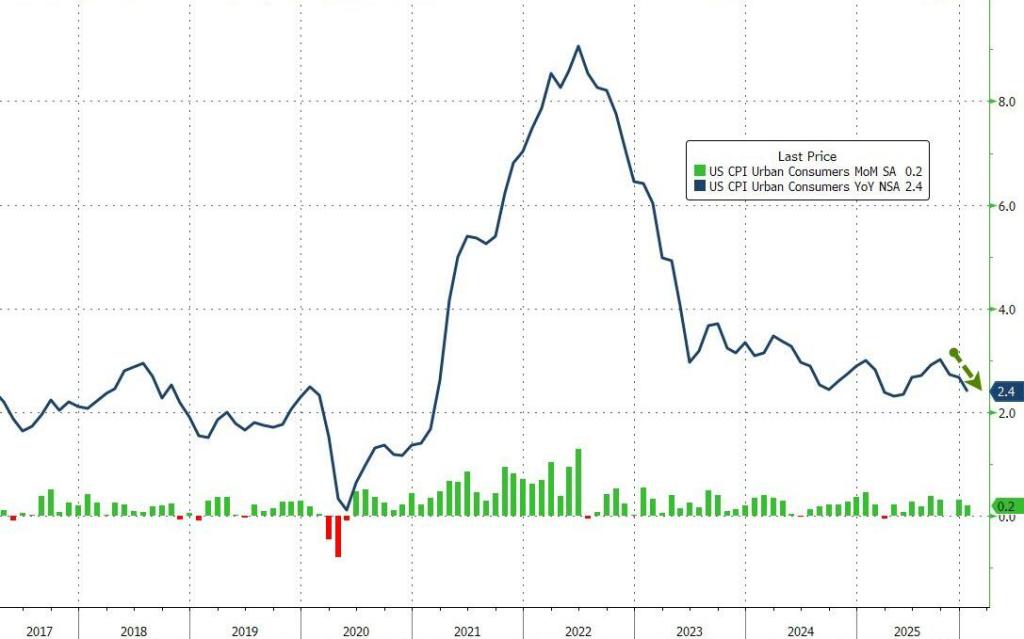
Despite the ‘hot’ whisper numbers (and 4 previous Januarys in a row of upside surprises), headline consumer price inflation came in cooler than expected in January (+0.2% MoM vs +0.3% expected). That pulled the headline CPI down dramatically from +2.7% to +2.4% – near the lowest in 4 years.
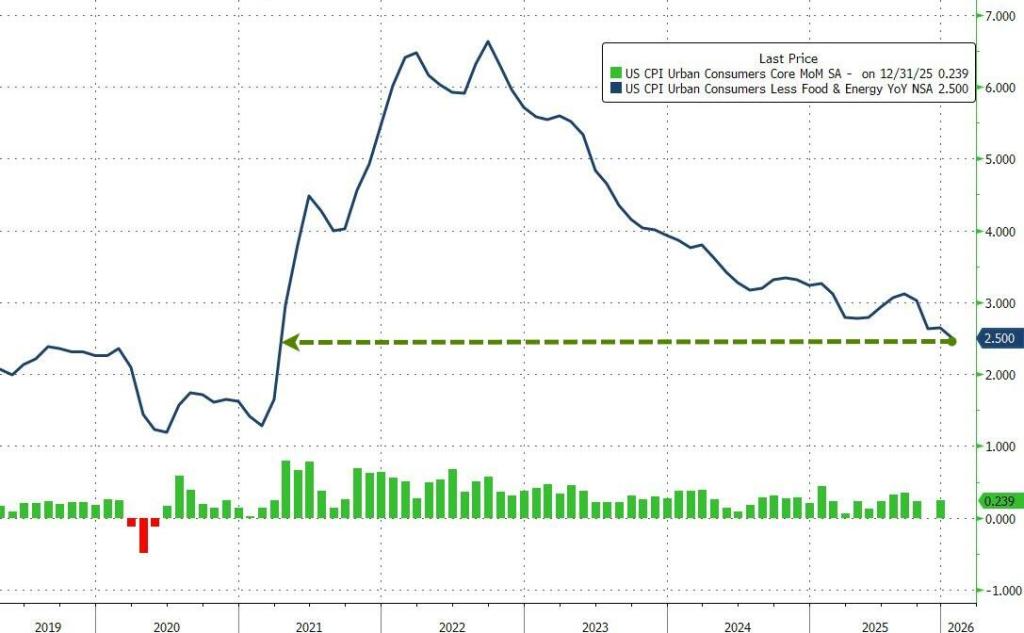
Core CPI printed +0.3% MoM (in line with expectations), lowering the YoY change in core prices to +2.5% – the lowest since March 2021.
The Shelter index rose 0.2% in January and was the largest factor in the all items monthly increase. The food index increased 0.2% over the month as did the food at home index, while the food away from home index rose 0.1 percent. These increases were partially offset by the index for energy, which fell 1.5% in January.
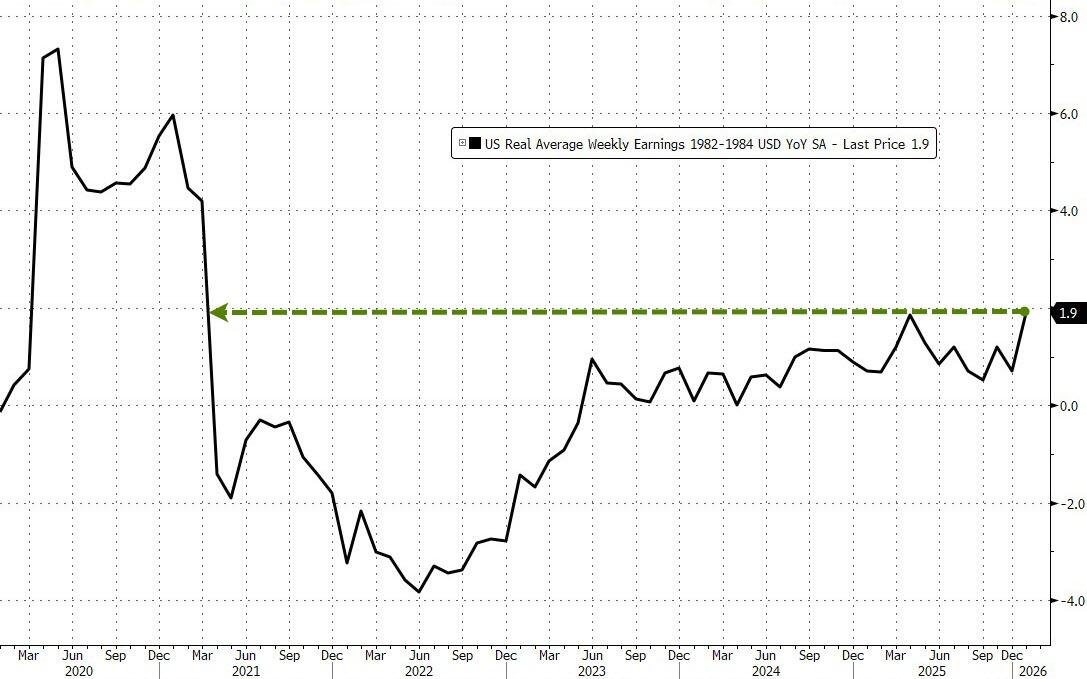
January saw real average weekly earnings rise 1.9% YoY – its highest since March 2021…
The analysts were correct on the direction but wrong on the scale as existing home sales plunged 8.4% MoM in January from a downwardly revised +4.4% MoM in December. That is the biggest MoM drop since February 2022.
While some suggested this could be impacted by the Winter Storms, this is based on contracts signed in November/December… and the biggest decline was in The West (which had zero weather impact)
Nevertheless, realtors gonna realtor:
“The below-normal temperatures and above-normal precipitation this January make it harder than usual to assess the underlying driver of the decrease and determine if this month’s numbers are an aberration,” NAR Chief Economist Lawrence Yun said in a statement.
That MoM plunge pulled the total SAAR down near 15 year lows…
Without an extended period of improved affordability, the recovery in the housing market is likely to be prolonged.
The NAR report showed the median selling price rose 0.9% from a year earlier to $396,800 last month.
First-time buyers represented 31% of buyers of existing homes in January, up slightly from 29% in the prior month and higher than a year ago.
The inventory of previously owned homes increased 3.4% in January from a year ago to 1.22 million.
A pickup in supply through 2025 has helped to tame price growth, though Yun said on a call with reporters that listings need to increase much more to help improve sales.
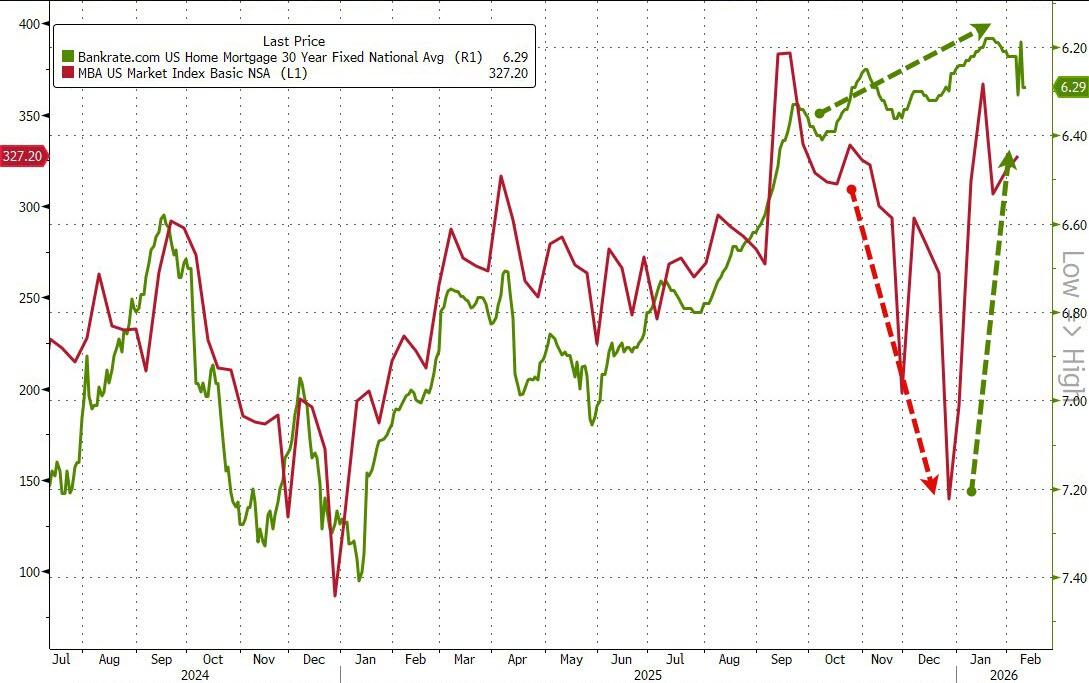
On the bright side, it appears mortgage applications are rebounding as the year started with lower rates…
Source: Bloomberg
Arguably, existing home sales have much further to go to the upside as the lagged mortgage rate has continued to decline… so what triggered this collapse?
Source: Bloomberg
Finally, circling back to where we started, NAR expects home sales to rise a stunning 14% this year, higher than most other forecasts but a figure that NAR Chief Economist Lawrence Yun said he feels “confident” in. That assumes more inventory will come on the market, mortgage rates will hover around 6% and the Fed will cut interest rates another two times, compared to policymakers’ median projection for one.


You must be logged in to post a comment.