The wheels are coming off Bidenomics. Code for corporate welfare and massive government spending. Coupled with misguided and burdensome regulations, we got gut wrenching inflation.
The result? A disastrous stock market showing yesterday.
What has Biden/Harris’ economic agenda wrought? Record high personal debt and record low savings rates.
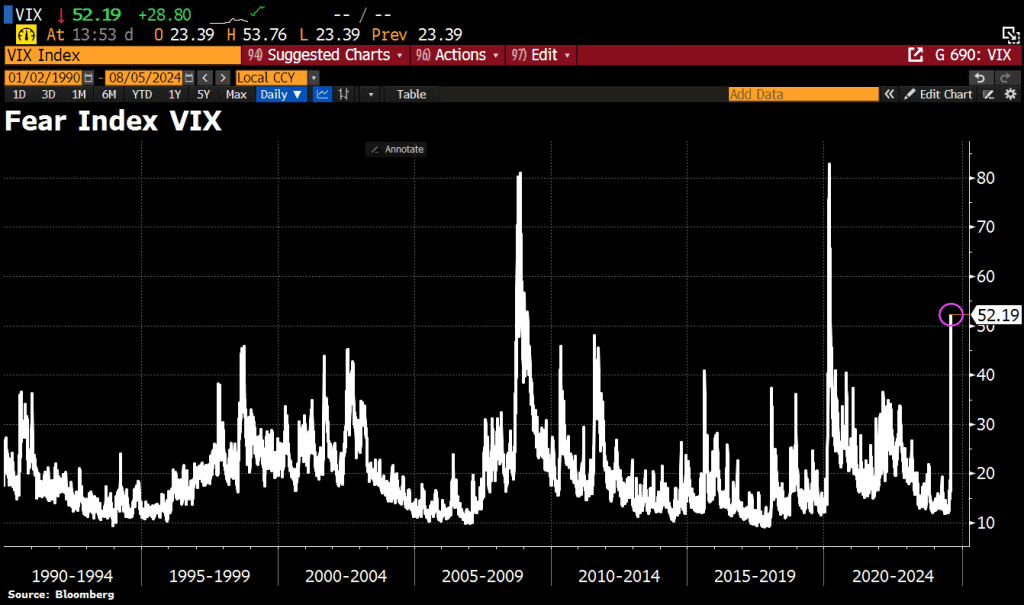
Like the Go-Go’s song Manic Monday, it is a manic Monday for stocks. The awful jobs report from last Friday is reverberating through markets. The VIX (fear index) soared to 52.2 this morning.
MY fear is that Congress will go wild and start (mis)spending trillions of dollars again on hare-brained projects like green energy (and electric cars) when our electric grid can’t support the increase in electric cars.
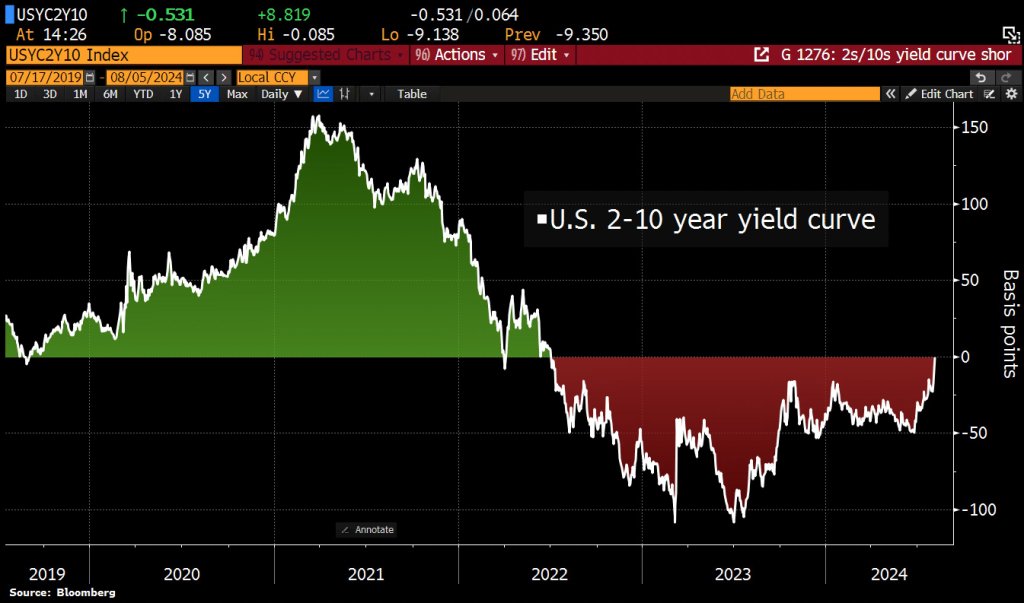
US 2s/10s yield spread is now flat for the 1st time since 2022 on aggressive repricing of Fed rate cuts. US 2y yields have plunged by 70bps to 3.69% since last Wed while US 10y yields only dropped by 40bps in the same time.
Voters are head-over–heels for Kamala Harris, a dim-witted Marxist authoritarian.
Remember the TV show “The Biggest :Loser”? That show was about weight loss.
Now The Federal Reserve has posted a record loss of $114 BILLION IN 2023.
The cause of the loss? Massive expansion of The Fed’s balance sheet coupled with rising interest rates. The two year track record of The Fed is truly appaling. With a bloated balance sheet, rising interest rates have caused staggering losses.
Since the Covid outbreak in early 2020, The Fed went wild with rate cuts and massive and unpredented balance sheet expansion.
Let’s look at The Fed’s puchase of agency MBS and mortgage rates. From 2020 2022, The Fed continued to buy agency MBS. But in 2022, all hell broke loose as The Fed went crazy RAISING rates, but slowly began unwinding their balance sheet. The result? Mortgage rates began to climb. In fact, the US conforming mortgage rate for 30 years has risen 102% since early 2022. The Fed is only slowing unwinding their MBS holdings.
Despite the struggles in the residential housing market, the COMMERCIAL mortgage market is a trainwreck.
This scene from the film “McCabe and Mrs. Miller” sums up our political plight quite nicley. Politicians spend like crazy to stay in power (Biden/Harris) are excellent examples). Politicians promises endless money, then shoot the economy. The US is broke and relies on printing money and boowed funds to stay afloat. Harris wants to raise taxes on everyone to fund her plans like even MORE emphasis of failed green energy schemes and endless foreign wars. I doubt if Harris could defend her spending plans in light of the US already $35 TRILLION in debt.
Even more worrisome if thev fact that DC politicians have promised entitlements (Social Security, Medicare, etc. totalling $217.63 Trillion. Or 623% higher than the rapidly increasing national debt.
Biden/Harris raised thr national debt by 25% in less than 4 years. And Harris wants to increase spending! Harris wants illegal immigrants put on Social Security and Medicare, further bankrupting those entitlement programs.
Let’s see Harris explain her indefensible budget (like raising taxes and not hurting economic growth).
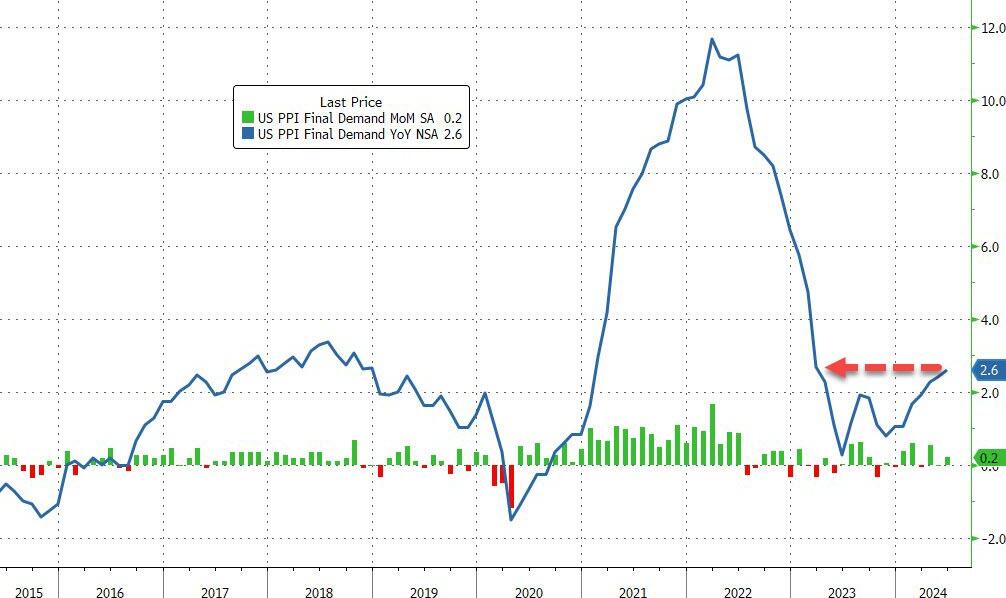
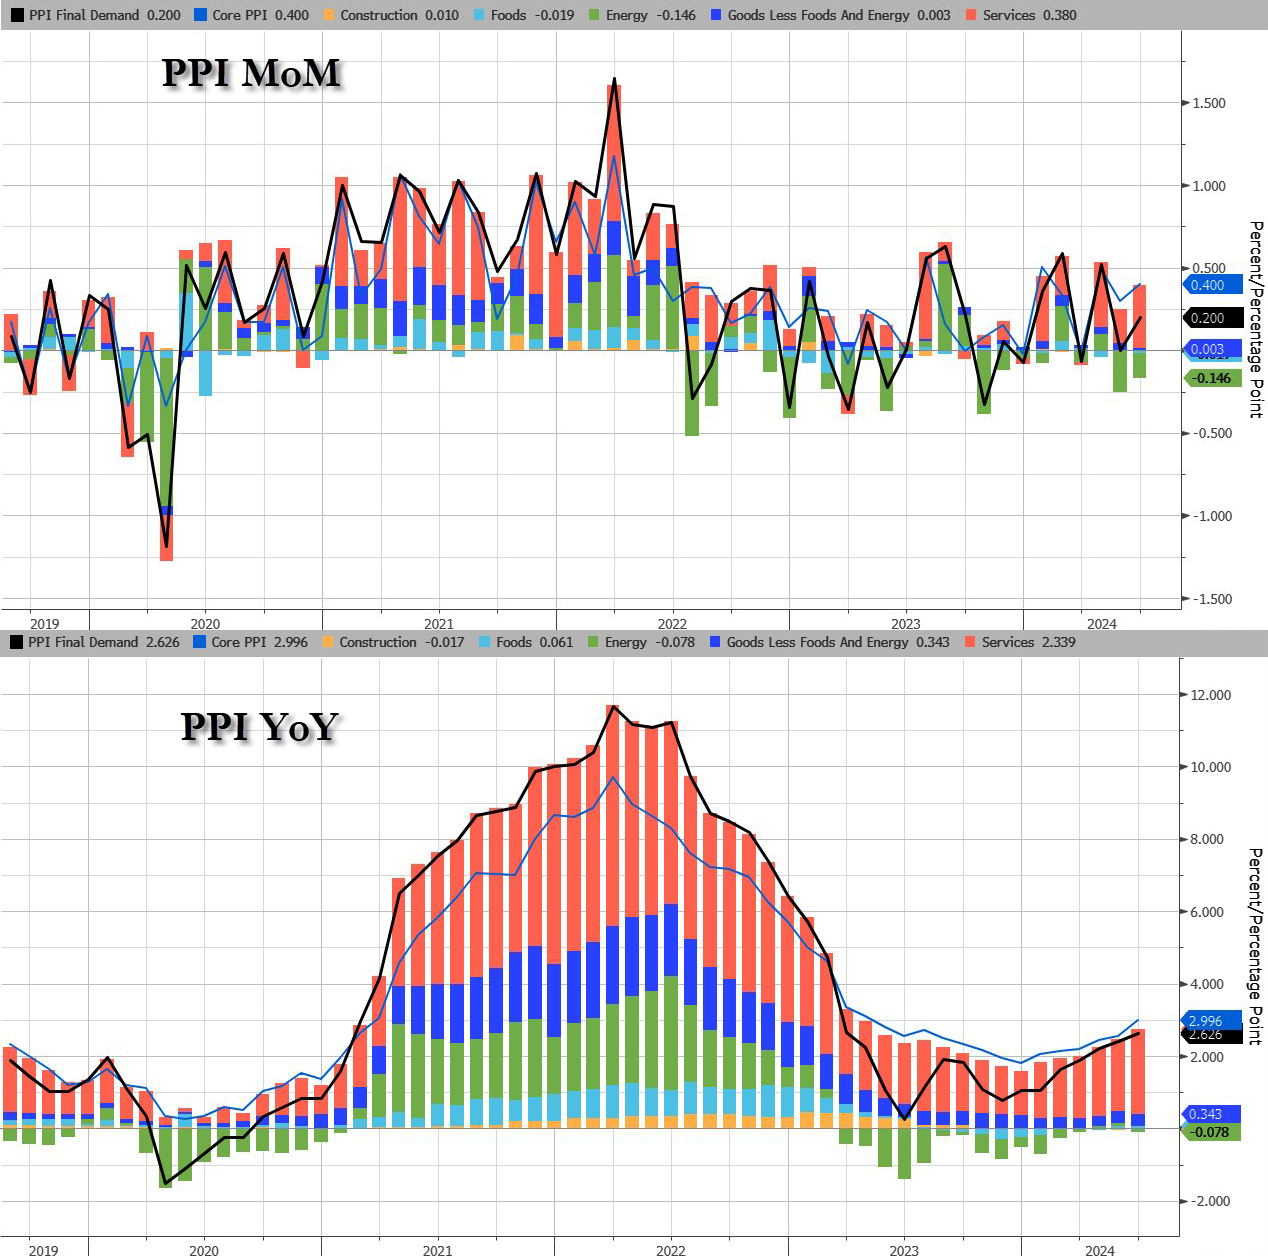
Core PPI rose by 0.4% MoM (double the 0.2% exp), sending the YoY price rise up by 3.0% (also the hottest since March 2023)…
Source: Bloomberg
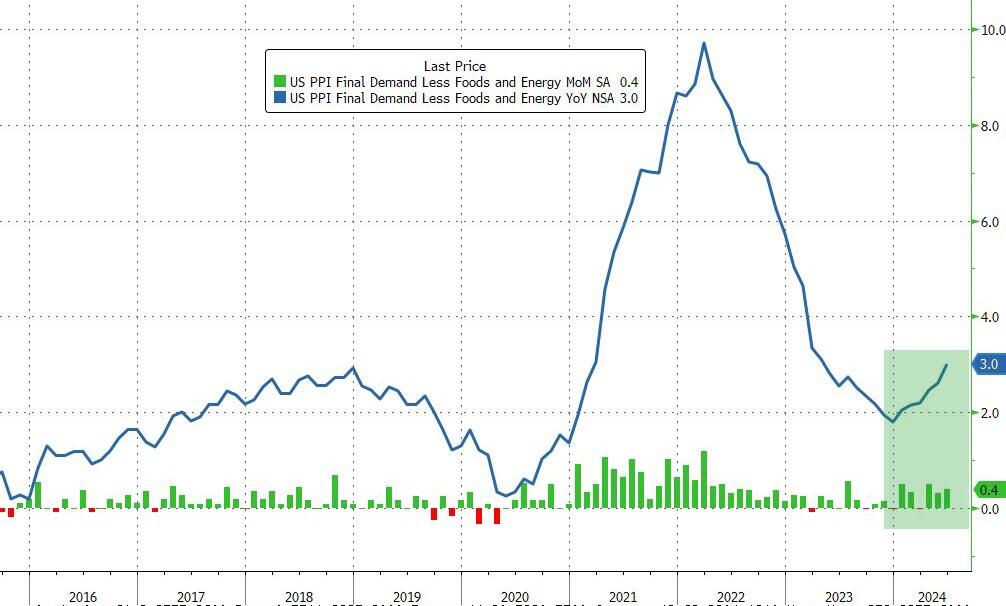
The jump in PPI was driven by a resurgence in Services costs as Energy remains deflationary (for now)…
Source: Bloomberg
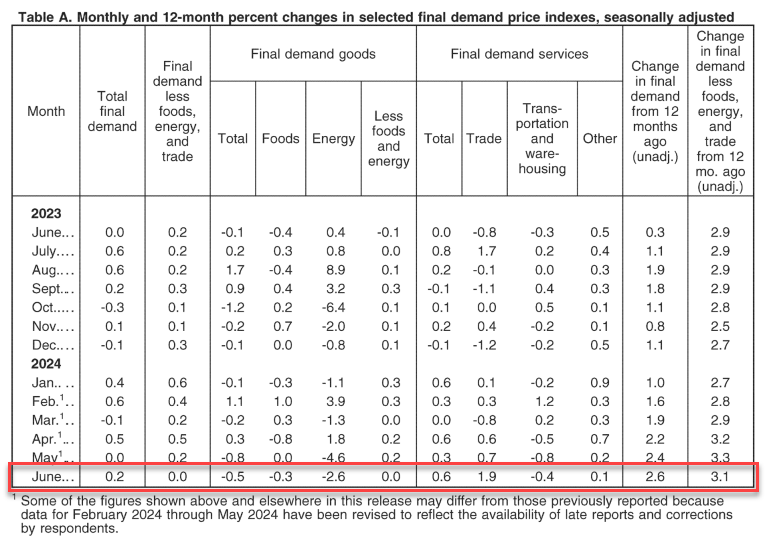
The June rise in the index for final demand can be traced to a 0.6-percent increase in prices for final demand services. In contrast, the index for final demand goods decreased 0.5 percent
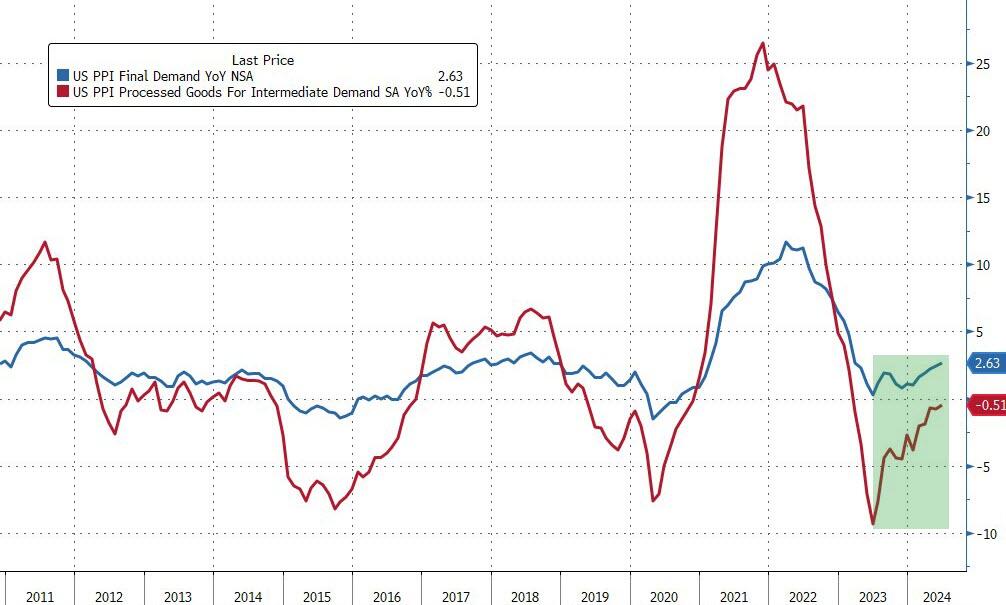
Perhaps worse still, the pipeline for PPI (intermediate demand) is accelerating…
Source: Bloomberg
On the housing side, buying conditions for housing tanks to all-time low.
Yes. everyone can see the mental decline in President Biden and he should be in a nursing home. While he vows to run for President against Donald Trump, can you imagine what he will be like in 2 years? Let alone another 4 years??
This estimate is down from 4.2% seen in mid-May and from 2.2% seen on June 28th. If this estimate turns out to be correct it will be the 2nd consecutive quarter of GDP growth below 2.0% after Q1 2024 GDP of 1.4%.
Housing hasn’t slowed across the board … yet. But with mortgage payments as % of income near the highest since the early 1980’s, it will eventually slow down.
There is only one way out. CEASE Bidenomics and the crazy spending and debt and deficits!
MMT is mostly magic! The Federal Reserve relies on “The Power of Magic” to fool people. For example, the massive increase in money printing following Covid and Biden’s disastrous economic policies (or FOLLICIES).
But there is also a fair amount of hypocrisy in the non-Austrian (e.g., mainstream, Keynesian, monetarist) critiques of MMT by mainstream economists. The truth is that most, if not all, of these economists share the same faulty presuppositions regarding what is euphemistically called “monetary policy.” The difference between mainstream and MMT economists is usually one of degree, not of kind.
Alan Greenspan, former Federal Reserve chairman (1987–2006) and most definitely not an MMT proponent, made a very MMT-friendly claim: “The United States can pay any debt it has because it can always print money to do that, so there is zero probability of default.” While this is literally true, and points to the fact that the nominal debt and dollars are not the issue, it overlooks the distortionary consequences from this manipulation on the entire structure of production. Nevertheless, such a claim is often also repeated by proponents of MMT, as if it contains some magic missing ingredient to unlock greater stores of wealth.
In fact, MMT provides a warranted critique to other schools of economic thought that share an underlying premise while not arriving at the same conclusions. That assumption is so-called monetary policy—that governments via a central banking monopoly ought to be the sole entity that issues and controls money as a policy instrument. The dubious justifications for this are that it provides greater economic stability and expansion of money and credit according to the needs of trade. (Both of these are false, theoretically and empirically.) That said, MMT and mainstream economics both share this presupposition, assuming the validity of monetary policy.
As an example of presenting the broad mainstream on the definition of “monetary policy,” the popular financial encyclopedia Investopedia has previously stated the following:
“Monetary policy is a set of tools that a nation’s central bank has available to promote sustainable economic growth by controlling the overall supply of money that is available to the nation’s banks, its consumers, and its businesses. . . . The main weapon at its disposal is the nation’s money (italics added).”
The casual use of the word “weapon” is apt. In the hands of a state monopoly, money can indeed be “weaponized.” Inflation is the artificial expansion of money and credit that has the effect of transferring wealth from all money holders to the inflater(s). This may be done under the guise of “policy”—appearing official, orderly, and legitimate—but it involves elites in power taking actions that would otherwise be criminal behavior (e.g., fraud and counterfeiting).
Even without the ethical-philosophical discussion on whether changing the money supply is fraudulent, economically, the consequences remain. The inflation of money and fiduciary media (artificial credit) causes economic miscalculations and boom-bust cycles, distorts the structure of production, encourages capital consumption, undermines the actions of individuals, discourages saving, transfers wealth from the citizenry to the government and those who are politically connected, affects money’s purchasing power, and has a whole host of other unintended effects. All this, of course, is done under the legal cover of “policy” to achieve “stable economic growth,” as well as ambidextrously maintaining the false dichotomy between full employment and inflation.
Enter MMT, which takes “monetary policy” concepts to their logical conclusions, demonstrating the consequences in a striking way, and mainstream economists quickly want to disassociate themselves from this “crazy” new idea. People may not appreciate some MMTers claiming what they do about inflation, government spending, full employment, and debt; yet politicians and monetary bureaucrats sure seem to act like they believe MMT.
MMT correctly observes that government—through a balance of taxation, deficit spending, inflation, and monetary policy—attempts to centrally control an economy and does, in fact, direct real resources toward its ends. These are common policy tools of the state and central banks. MMT would just like to leverage these tools to a greater extent and direct them toward different ends. Likewise, Investopedia had further clarified:
“The Federal Reserve is in charge of monetary policy in the U.S. The Federal Reserve (Fed) has what is commonly referred to as a dual mandate: to achieve maximum employment while keeping inflation in check.”
Is this above statement not basically a statement of the goals of MMT? Other economic schools of thought that accept the underlying presuppositions of the necessity of monetary policy are not fundamentally in disagreement with MMT on this point; in fact, they are in fundamental agreement. This undermines the ability of these schools to effectively deliver a fundamental critique of MMT rather than just disagreements about how and to what extent monetary policy is to be utilized.
Economic criticism on these points—whether from MMT to the “other side” or from the “other side” to MMT—involves inconsistency. By condemning the other, they condemn themselves because they share core presuppositions. The existence of MMT is effectively a reductio ad absurdum of so-called monetary policy. MMT reasonably asks: What if we did more of the same? Obviously, the degree to which something is done can be critiqued without abandoning the whole thing, but the flawed assumptions are twofold: (1) that there is “just the right amount” of monetary policy and (2) that there are certain enlightened experts who know what it is and only need monopoly over the money supply to achieve it.
Whether MMT or otherwise, proponents of so-called monetary policy essentially believe that money is a policy instrument (or weapon) to be wielded by government elites to rearrange prices, resources, and the structure of production contrary to the demonstrated preferences of millions of individuals. Therefore, the United States has been under a monetary policy regime of “stabilizers” who have argued about how to implement a fundamentally flawed “policy” for over a century.
Whenever this fails and destabilizes the economy, we are treated to critics who blame the free market and deregulation and who want to use monetary policy to “run the economy” differently.
Instead, we ought to abandon the fraud of monetary policy and heed the words of F.A. Hayek concerning the results of monetary policy that led to America’s Great Depression:
“We must not forget that, for the last six or eight years [up to 1932] monetary policy all over the world has followed the advice of the stabilizers. It is high time that their influence, which has already done harm enough, should be overthrown.”
Mortgage rates have actually risen as The Fed has increased M2 Money printng. Like DARK magic.


You must be logged in to post a comment.