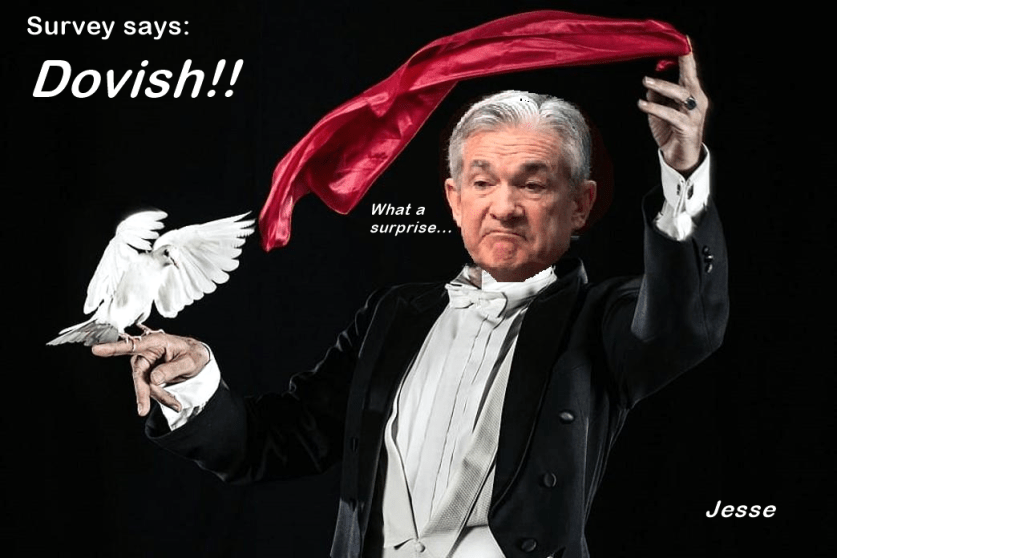
Well, I was expecting a little more guidance than Fed Chair Powell gave today at the J-Hole conference. In fact, failing to give a hard date on paring back the balance sheet and raising rates is downright dovish. A regrettable incident.
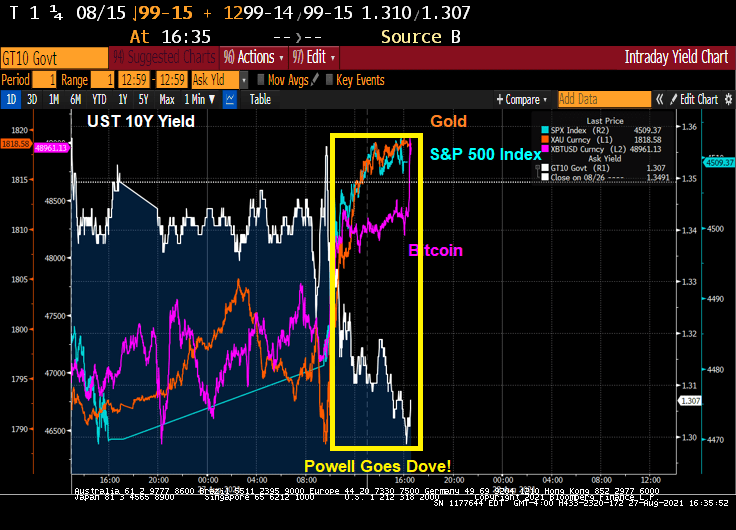
As a result of Powell’s dovish talk, GOLD, BITCOIN and the S&P500 index rose.
The S&P 500 index rose almost 1% today while the 10Y Treasury yield dropped 4 bps.
The financial markets are overstimulated like a cranky child after too much sugar (aka, sugar rush). So what will happen to overstimulated markets if Fed Chair Powell announces withdrawal of monetary stimulus?
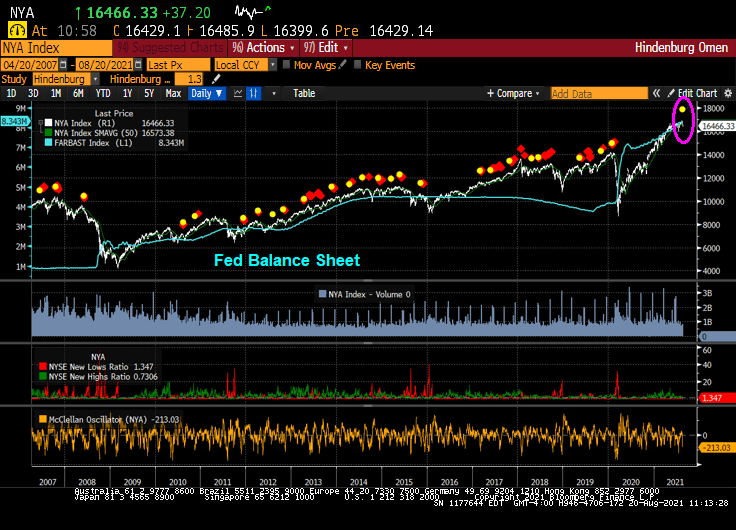
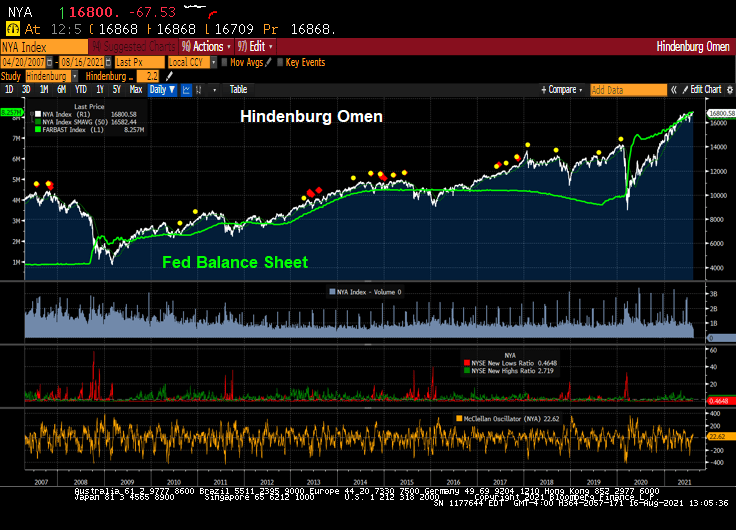
The famous Hindenburg Omen is already flashing WARNING ahead of this week’s Fed meeting at Jackson Hole. Will Powell take the punch bowl away?
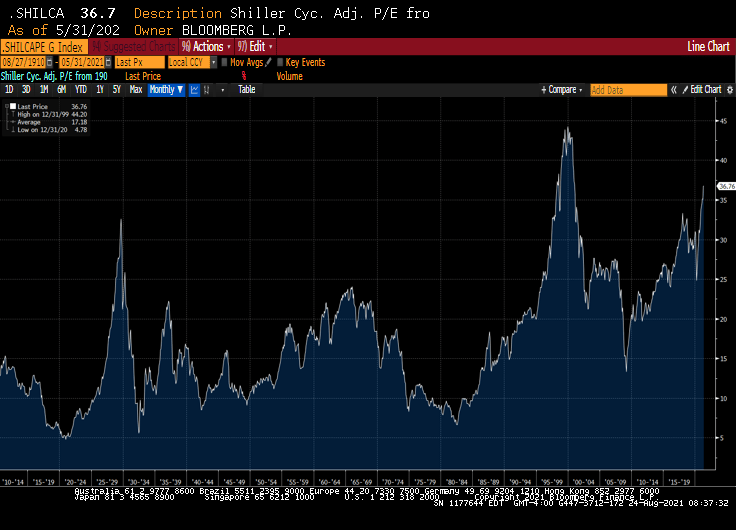
The Shiller CAPE ratio is at a high since the financial crisis and stock market correction in 2008 and early 2009.
I would expect Powell to walk softly since he has the opportunity to terrify financial markets. But I expect Powell will announce a small adjustment to the growth of The Fed’s balance sheet in line with The Fed’s DOTS project signalling interest rate increases in the futures.
Throw Covid, a slowing China and Europe into the mix, and Powell and the gang had better think long and hard about they are going to withdraw the record monetary stimulus from the cranky financial markets.
Meanwhile I hope that have a few beers from Bond’s Brewing Company, the best beer in Laramie, Wyoming!!
Powell and The Fed’s policies have veered from their mandate requiring Chairman Powell to meet 350 times with Congress to sell The Fed’s policies.
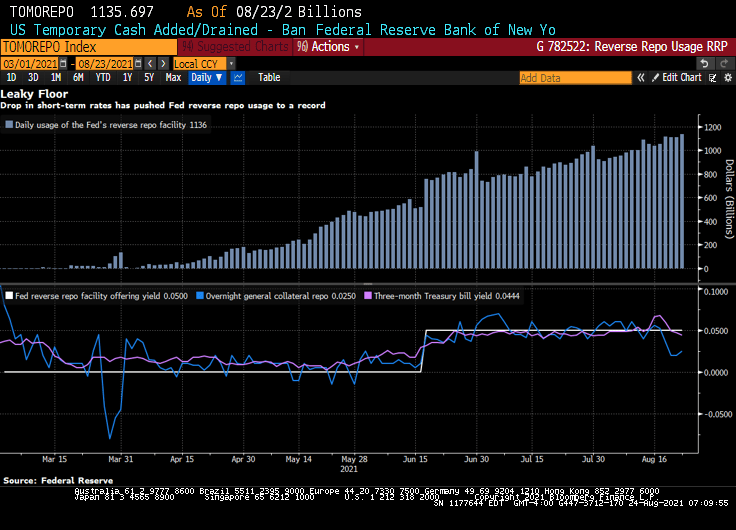
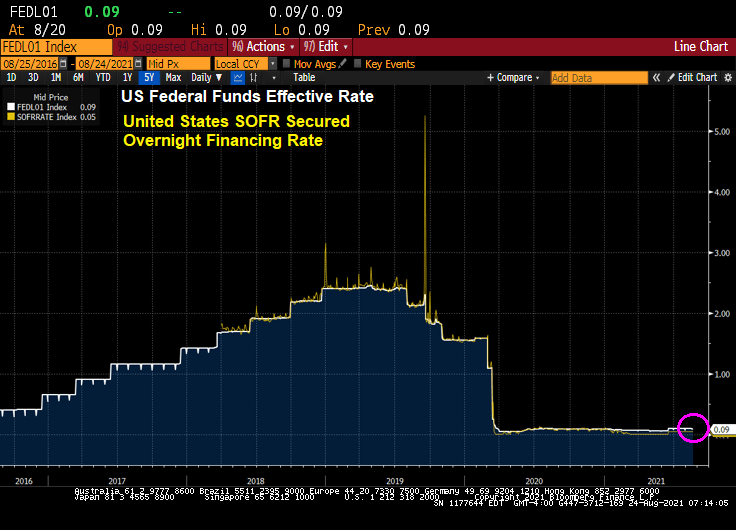
Bloomberg) — The Federal Reserve’s floor for overnight funding markets is proving to be no match for the deluge of cash.
Money-market securities ranging from Treasury bills to repurchase agreements continue to trade below 0.05% — the offering rate on the overnight reverse repo facility, which is supposed to act like a floor for the front end. The Fed at its June meeting had raised the rate by five basis points to help support the smooth functioning of short-term funding markets.
Still, usage of the tool climbed to a record $1.136 trillion on Monday, eclipsing the previous high of $1.116 trillion on Aug. 18.
Demand for the so-called RRP facility has surged as a flood of dollars threatens to overwhelm funding markets. That’s in part a result of the central bank’s long-standing asset purchases and drawdowns of the Treasury’s cash account, which is pushing reserves into the system. As a result, liquidity has been swelling, especially as the Treasury cuts supply to create more borrowing room under the debt ceiling.
The pressure pushing down overnight rates toward zero is proving a major headache for money-market funds. It hampers their ability to invest profitably, and can lead to further disruptions as they begin to waive fees to avoid passing on negative rates to shareholders. A number of firms including Vanguard Group shut down prime money-market funds last year after struggling to cover operating costs in the low-interest-rate environment.
Yes, overnight rates such as the US SOFR rate, are near zero.
Powell’s Charm Offensive in Congress Positions Him to Keep Job
Perhaps that is why Federal Reserve Chair Jerome Powell is acting as a lobbyist with Congress for The Fed’s nontraditional approach to monetary policy.
(Bloomberg) Since he took the helm of the Fed in February 2018, through June of this year, he’s held at least 350 meetings, dinners or phone calls with members of Congress, according to his monthly calendars. That’s almost nine per month, and many of those included more than one lawmaker. The tally doesn’t count at least 16 appearances as chair before numerous congressional committees.
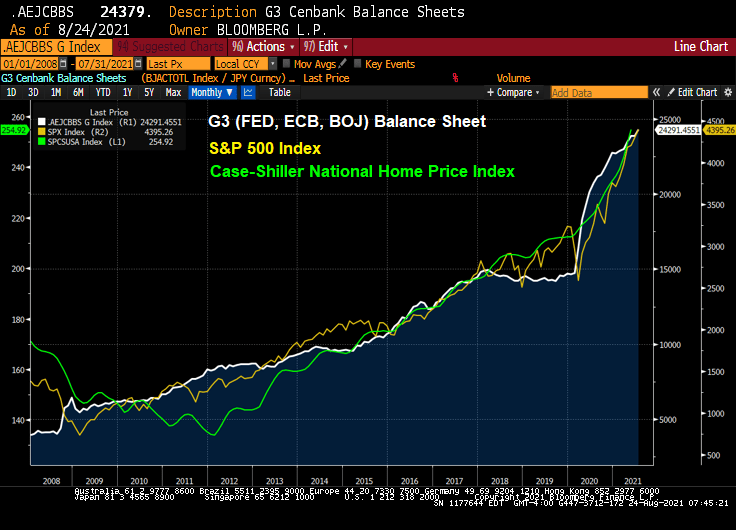
Well, the stock market has zoomed-up since Bernanke and The Fed adopted zero-interest rate (ZIRP) policies and the now famous quantitative easing (QE) policies in late 2008.
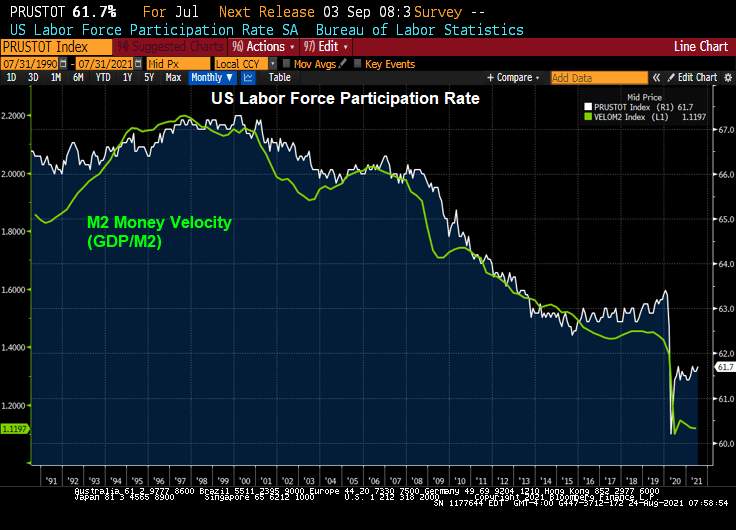
Congress member Alexandria Ocasio-Cortez asked Fed Chair Powell about the Fed helping with US unemployment. We are already at zero rates (on the short-end), and Congress should look at their policies on why labor force participation is slow to recover from the Covid epidemic.
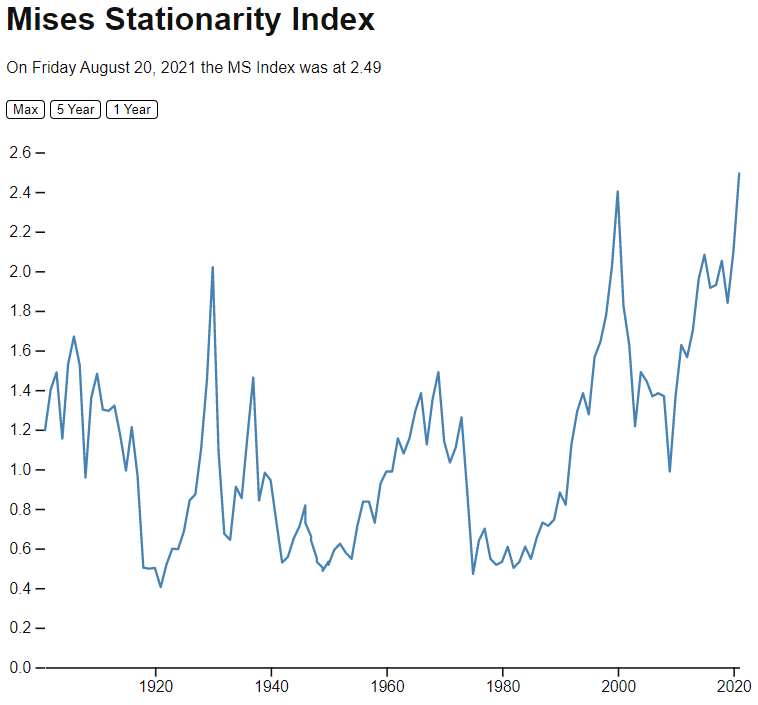
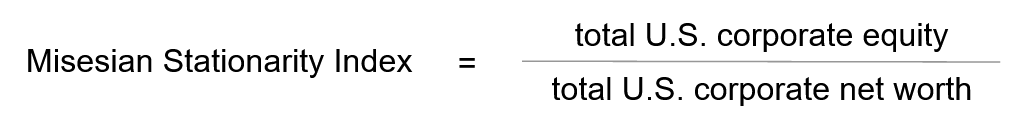
The Mises Stationarity Index is different than the Shiller CAPE index, which is showing equities as being overpriced, but not yet in dot.com bubble zone.
The famous Hindenburg Omen, the technical indicator that predicted the 2008 correction in the stock market, has just flashed “ALARM” again.
To be sure, there hasn’t been a major correction in the stock market since the financial crisis, primarily because The Federal Reserve has constantly goosed the markets since late 2008.
Just as the Shiller CAPE ratio is signalling ALARM!
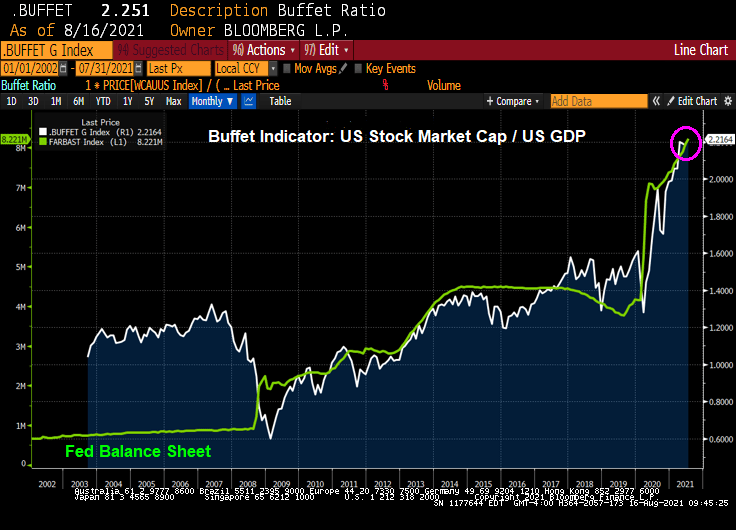
As is the Buffet Indicator.
I have no doubts that the Fed will withdraw its monstrous stimulus from the market after the Jackson Hole Fed conference. … NOT!!!!
Maverick Capital posted this nugget today showing The Buffet Indicator (US equity market cap/GDP) and US Corporate Profits / GDP. All I can say is “simply unsustainable.”
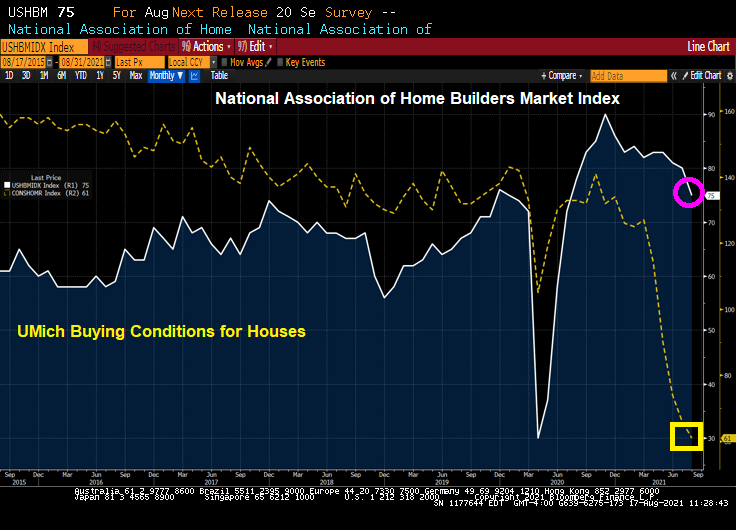
Of course, then we have the University of Michigan conditions for buying a home crashing as well.
Rising home prices and rising construction material costs? Yikes.
Of course, the NAHB had this to say:
“Our expectation is that production bottlenecks should ease over the coming months and the market should return to more normal conditions,” NAHB Chief Economist Robert Dietz said in a statement.
Perhaps, but The Fed needs to slow down its money printing as well.
There are a variety of measures of an asset bubble. And each one points to an unsustainable bubble in the stock market.
Let’s start with the Buffett Indicator. The ratio of Total Market Capitalization of all US stocks (WCAUUS ) to total nominal GDP of the United States (GDP CUR$ ).
There is also the GLOBAL Buffett ratio produced by Holger Zschäpitz. Global market cap now equal to 139% of global GDP, way above Buffett’s 100% bubble threshold.
Shiller’s Cyclically-adjusted Price-earnings ratio? Still climbing and resembles the Dot.com bubble of 2000.
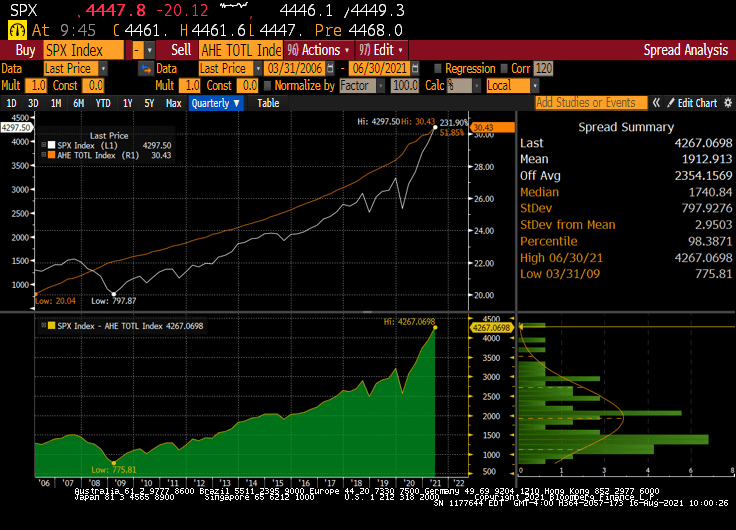
How about gold to Average Hourly Earnings (similar to the Bichler and Nitzan “Power” measure. The spread (bottom chart) sees the S&P 500 index soaring away from average hourly earnings.
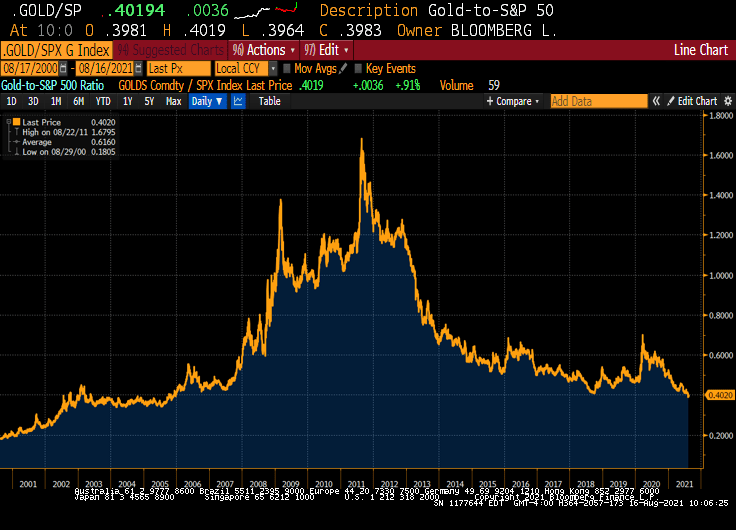
We also have the Gold to SPX ratio that is now back to pre-financial crisis levels.
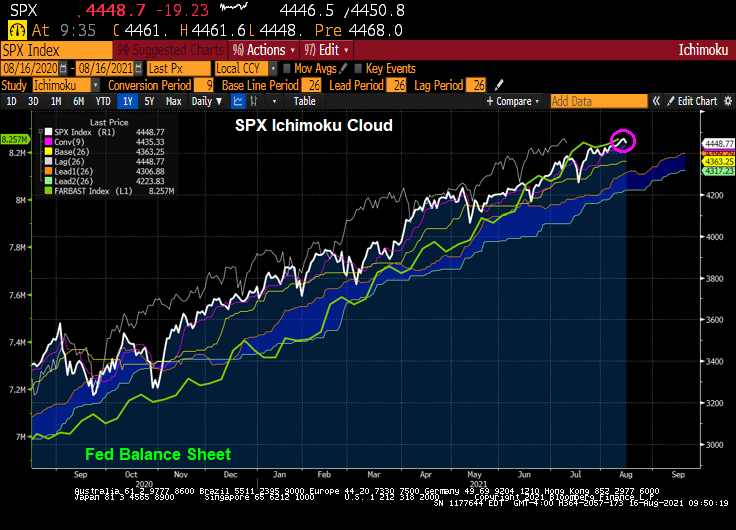
How about the Ichimoku cloud, where the SPX is currently ABOVE the cloud?
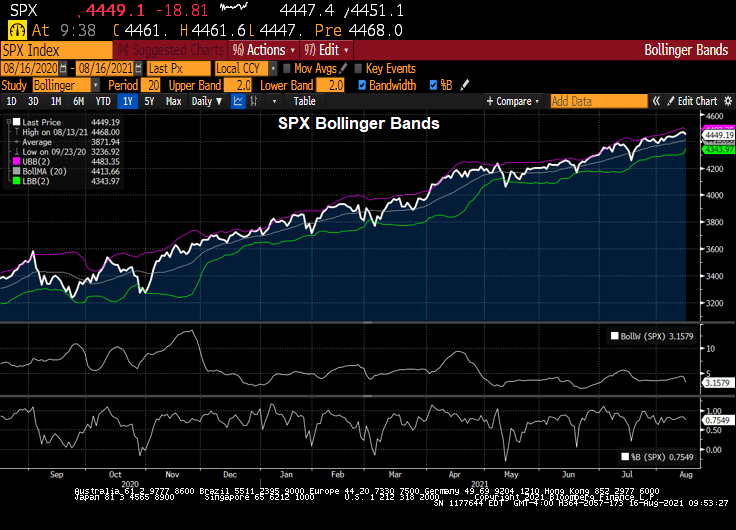
SPX and Bollinger Bands? The SPX index is close to the upper band.
How about The Hindenburg Omen, a technical indicator that was designed to signal the increased probability of a stock market crash. It compares the percentage of new 52-week highs and new 52-week lows in stock prices to a predetermined reference percentage that is supposed to predict the increasing likelihood of a market crash.
So it looks like a have a bubble in the stock market.
Fed Chair Jerome Powell sees the ghost of the Dot.com bubble.


You must be logged in to post a comment.