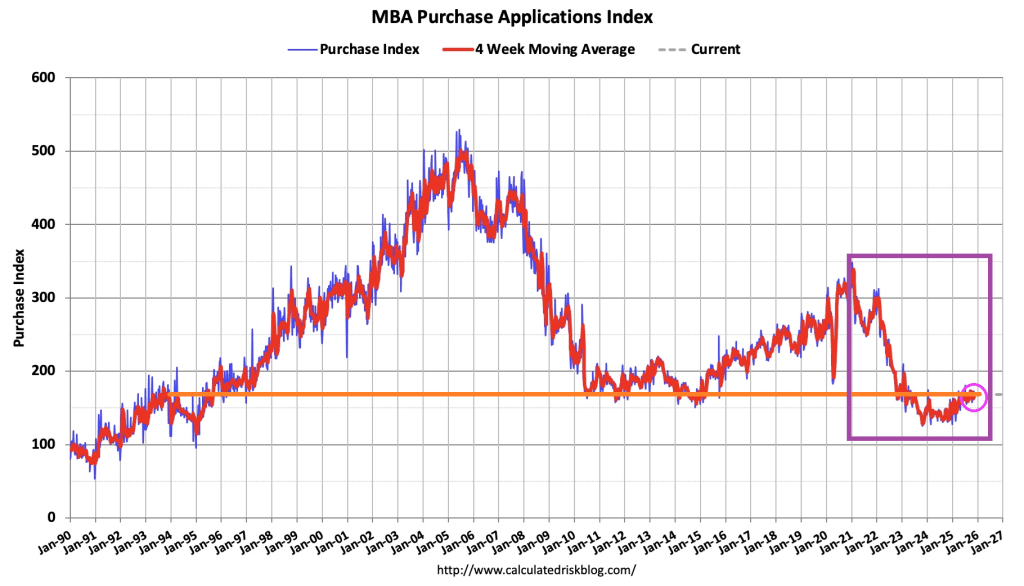
Mortgage applications decreased 5.2 percent from one week earlier, according to data from the Mortgage Bankers Association’s (MBA) Weekly Mortgage Applications Survey for the week ending November 14, 2025.
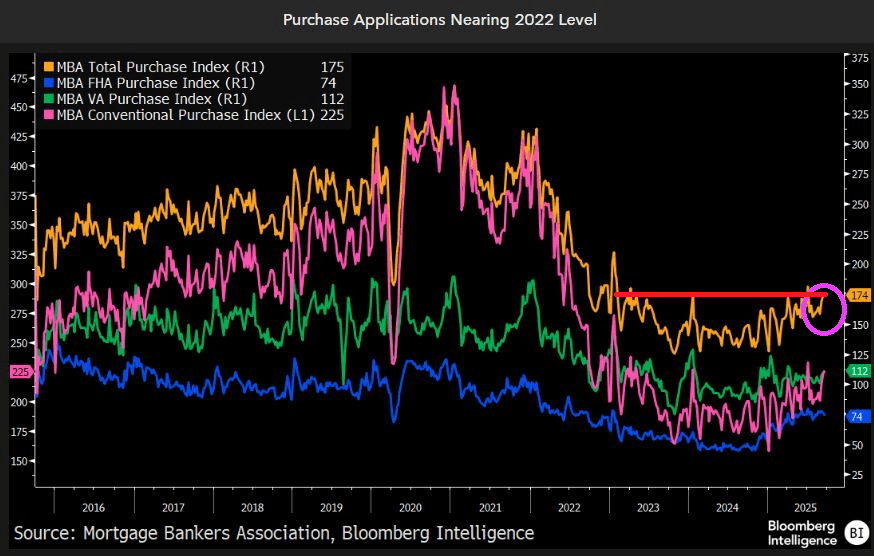
The Market Composite Index, a measure of mortgage loan application volume, decreased 5.2 percent on a seasonally adjusted basis from one week earlier. On an unadjusted basis, the Index decreased 7 percent compared with the previous week. The seasonally adjusted Purchase Index decreased 2 percent from one week earlier. The unadjusted Purchase Index decreased 7 percent compared with the previous week and was 26 percent higher than the same week one year ago.
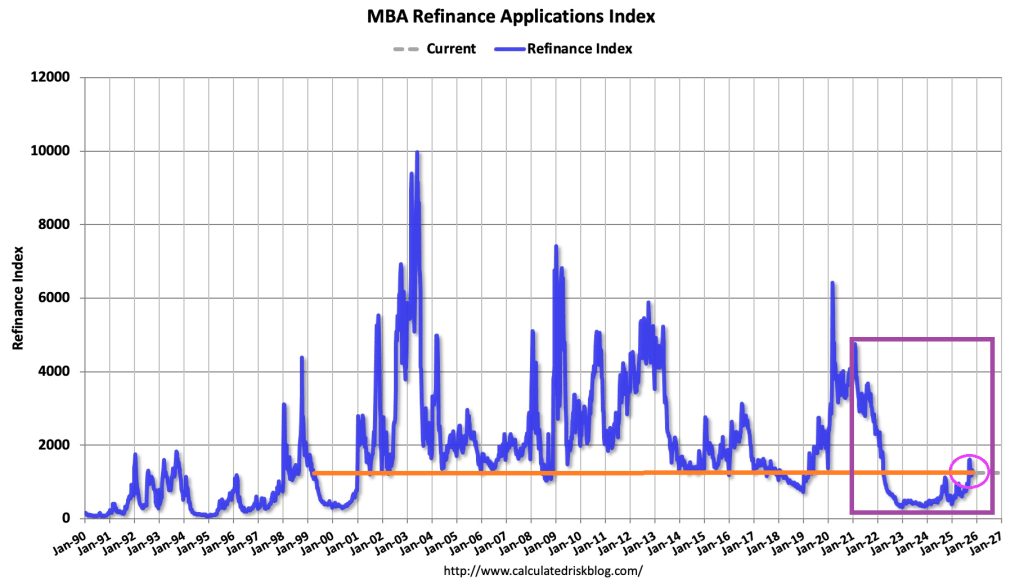
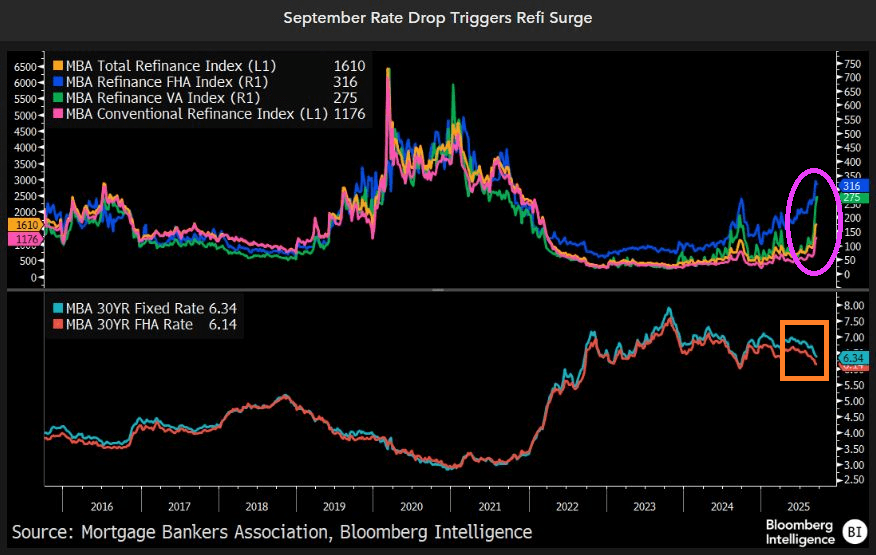
The Refinance Index decreased 7 percent from the previous week and was 125 percent higher than the same week one year ago.
The average contract interest rate for 30-year fixed-rate mortgages with conforming loan balances ($806,500 or less) increased to 6.37 percent from 6.34 percent, with points remaining unchanged at 0.62 (including the origination fee) for 80 percent loan-to-value ratio (LTV) loans.
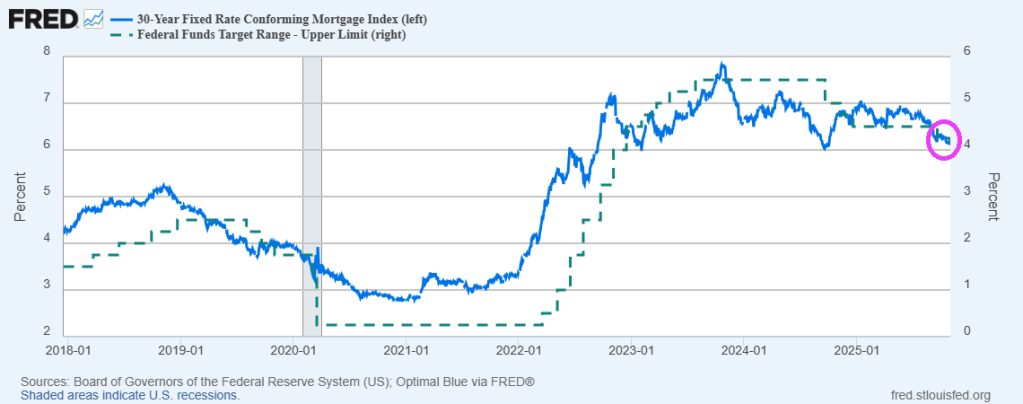
Mortgage rates increased for the third consecutive week, with the 30-year fixed rate inching higher to its highest level in four weeks at 6.37 percent.
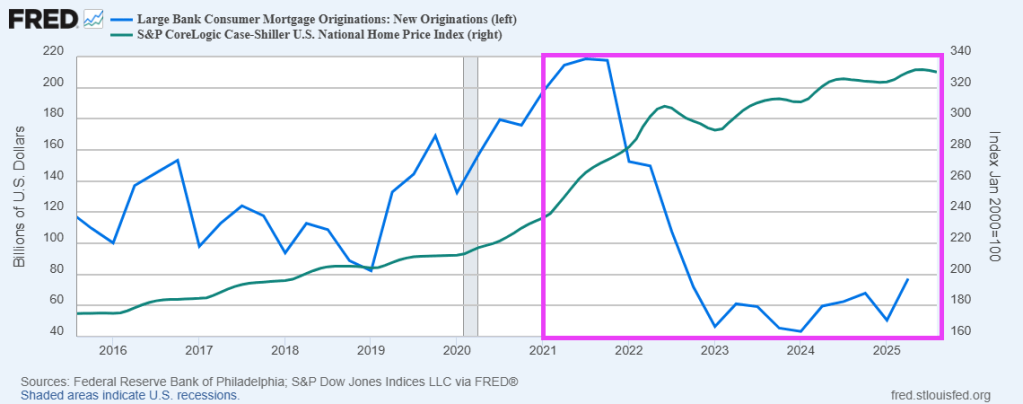
2020. A year that goes down in infamy. The Covid outbreak and the government’s insane overreaction to it. Masks and massive spending, driving up housing prices.
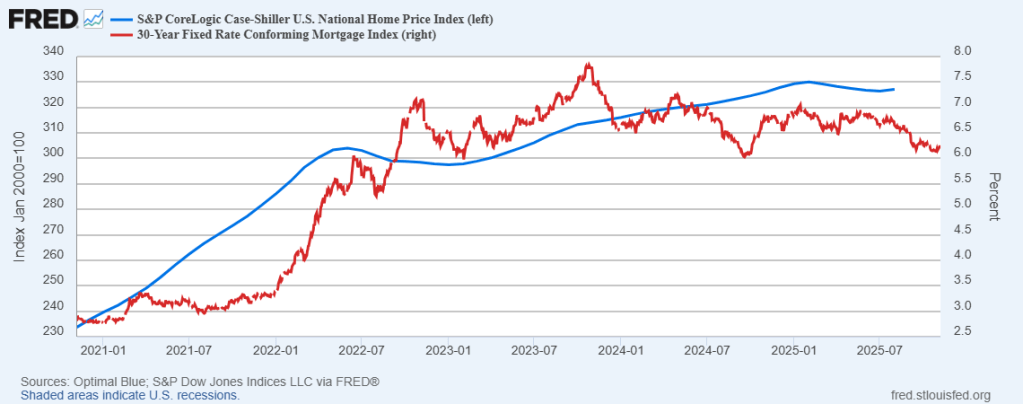
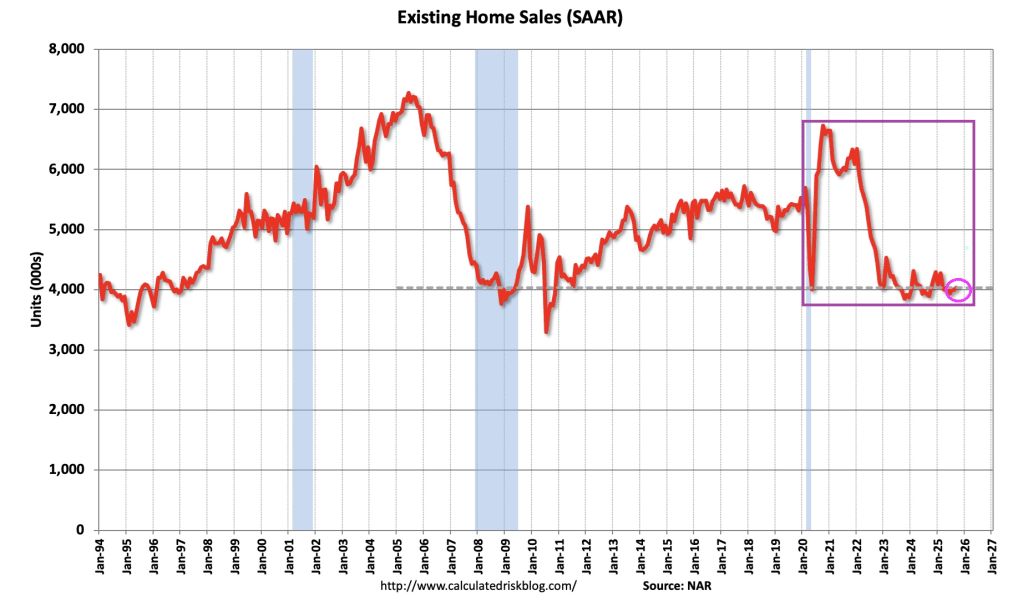
After 2020, mortgage originations plummeted while housing prices soared.
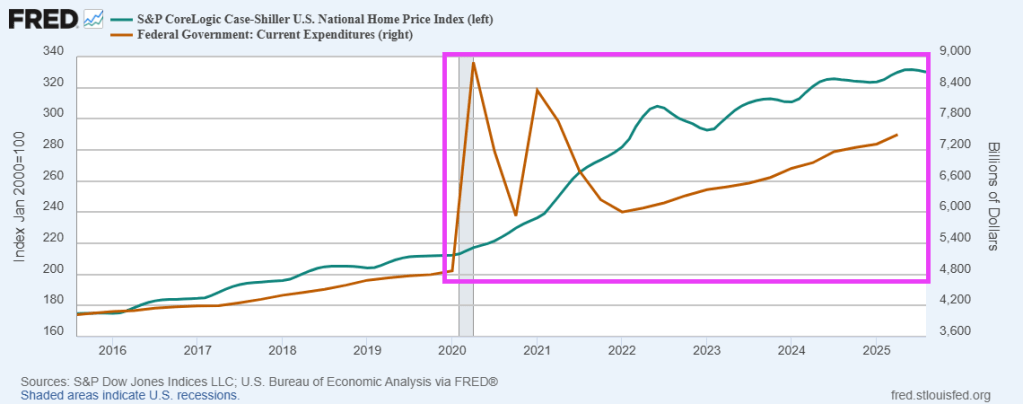
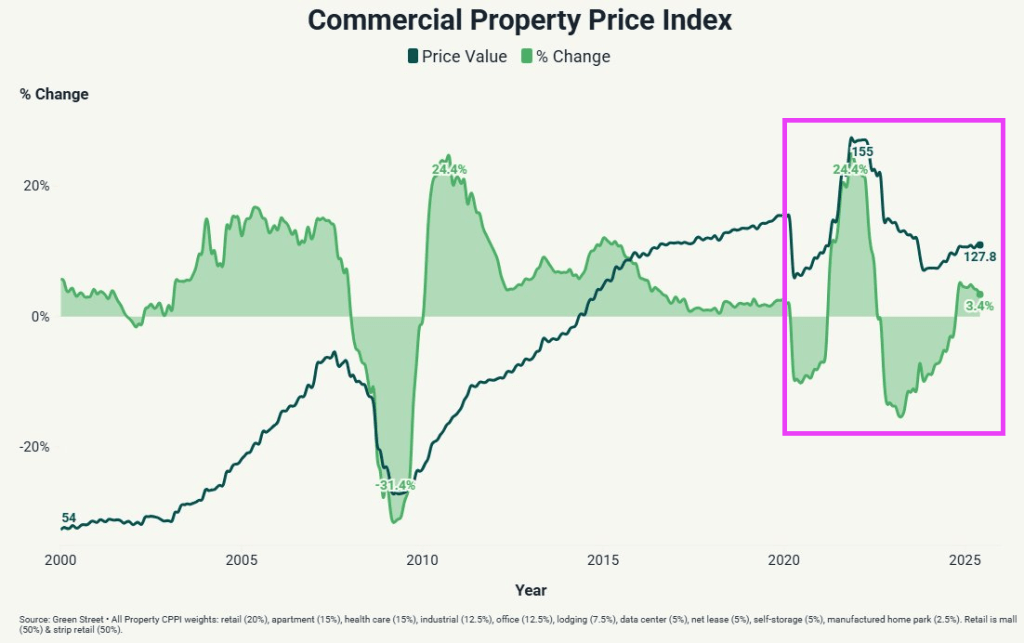
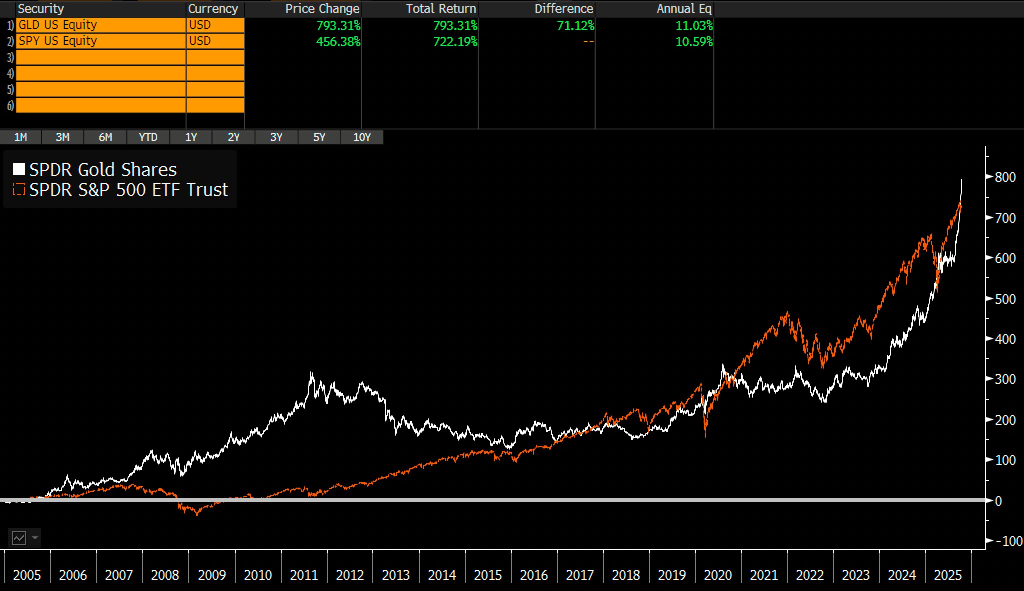
US home prices took off like a scalded cat after the Federal government went on a massive spending spree in 2020.
The US mortgage market is “livin’ on a prayer.” As a result, former homebuilder and current FHFA Director Bill Pulter has suggested 2 mortgage products to make US homes more “affordable”, adding to the legacy of stupid government policies to increase homeownership.
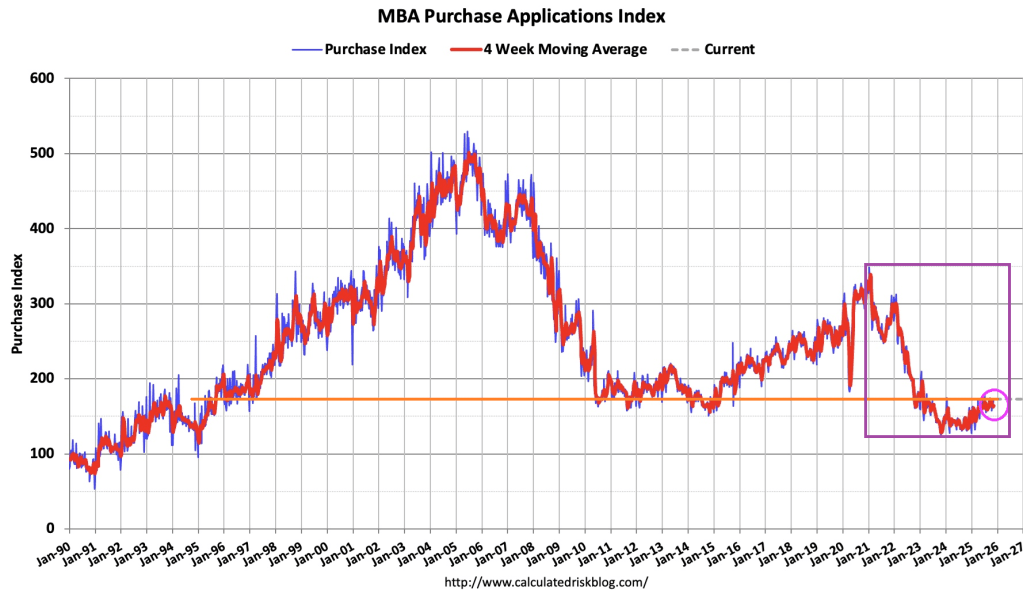
But first, current mortgage demand. Mortgage applications increased 0.6 percent from one week earlier, according to data from the Mortgage Bankers Association’s (MBA) Weekly Mortgage Applications Survey for the week ending November 7, 2025.
The Market Composite Index, a measure of mortgage loan application volume, increased 0.6 percent on a seasonally adjusted basis from one week earlier. On an unadjusted basis, the Index decreased 1 percent compared with the previous week. The seasonally adjusted Purchase Index increased 6 percent from one week earlier. The unadjusted Purchase Index increased 3 percent compared with the previous week and was 31 percent higher than the same week one year ago.
The Refinance Index decreased 3 percent from the previous week and was 147 percent higher than the same week one year ago.
Now on to Pulte’s stupid mortgage proposals.
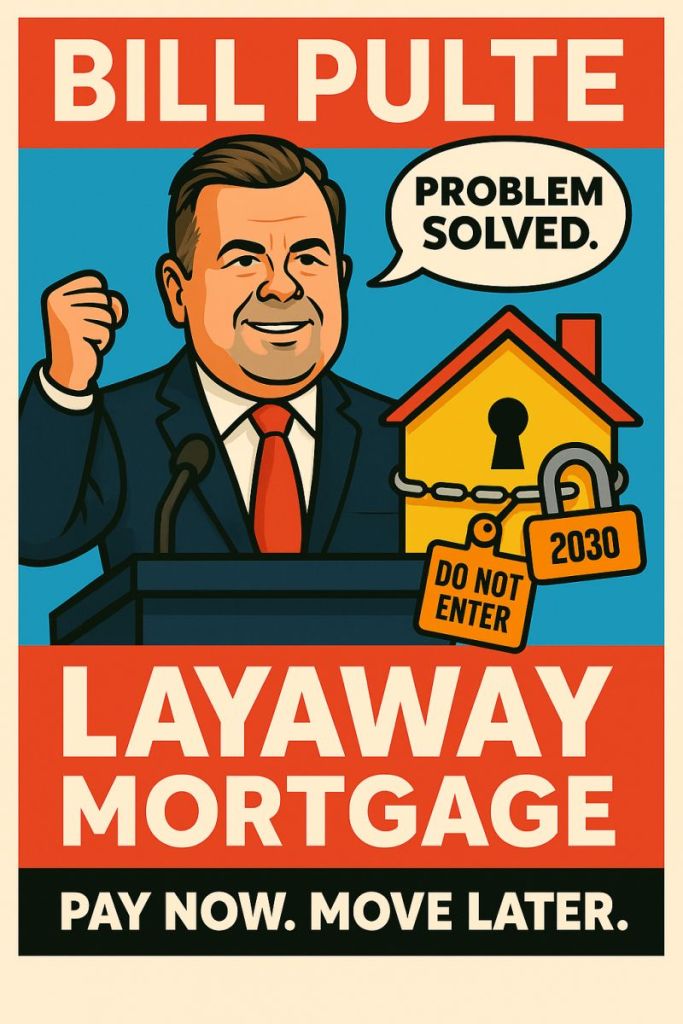
Pulte Doubles Down After 50-Year Backlash, Proposes “Layaway Mortgage”
The 50-year mortgage is a stupid idea. True, it can reduce the monthly mortgage payment by several hundred dollars. But it extends the life of the mortgage from 30 to 50 years, keeping the outstanding mortgage balance elevated for longer, exposing the lender (or mortgage owner) to greater losses in the case of default. Not surprising since the duration risk of a 50-year mortgage is greater than on a 30-year mortgage. Who is going to hold these mortgages??
So, Pulte hearing that the mortgage market thinks this is a stupid idea, introduced another stupid mortgage idea: the “layaway mortgage” where buyers make payments for 5-10 years before they’re allowed to move into the home. This is a variation of “rent to own.”
Under Pulte’s Layaway Mortgage program:
▪️ Buyers select a home and begin making monthly payments immediately ▪️ They continue paying for 5-10 years (the “layaway period”) ▪️ During this time, they cannot live in the home, modify it, or even visit without an appointment ▪️ After the layaway period ends, buyers can move in and begin their 40-year mortgage ▪️ If they miss a payment during layaway, they forfeit everything and the home goes back on the market.
So, in other word, a 50-year mortgage (40+10 layaway).
Note: Japan used to offer 100-year mortgages during their housing bubble, but now 35-year mortgages are more common.
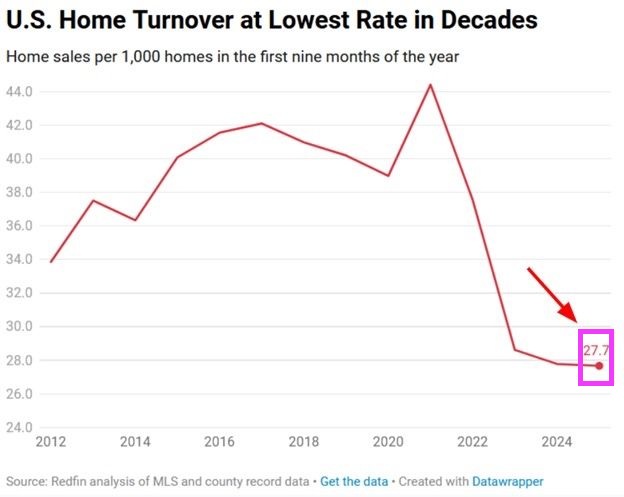
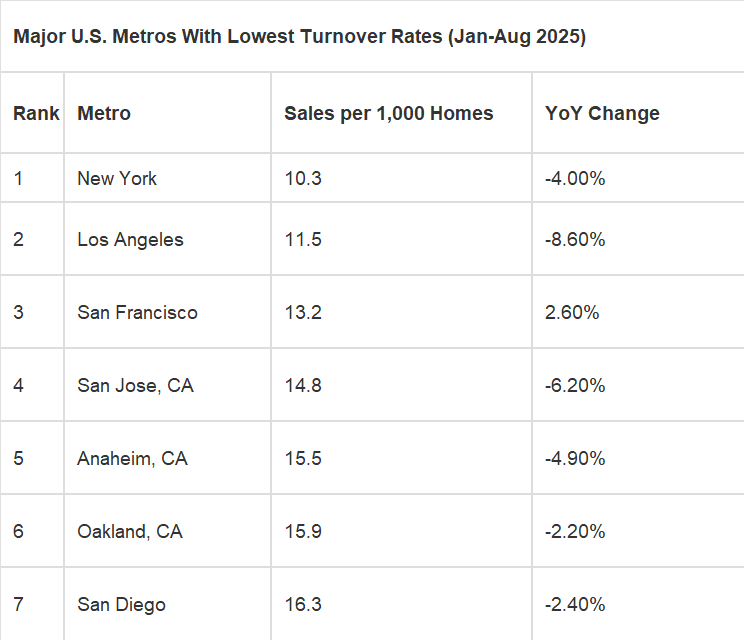
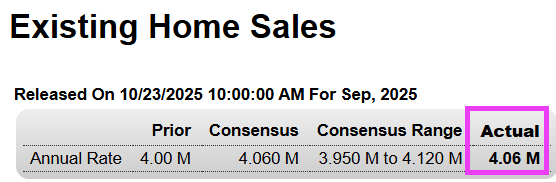
Just 2.8 homes out of every 1,000 changed owners in the first nine months of 2025—the lowest turnover rate in at least three decades. This marks a 38% plunge from the 2021 frenzy, when 44 per 1,000 homes sold, and is 44% below the pre-pandemic 2019 pace of 40 per 1,000.
Why the freeze? – Rate lock-in: Over 70% of homeowners are sitting on sub-5% mortgages and are reluctant to trade them for today’s rates exceeding 6%.
Sticker shock: Record prices combined with high borrowing costs have left many potential buyers on the sidelines. The result is a housing market that remains stagnant.
*Home prices are relatively high as are mortgage rates.
Someone will undoubtedly write me to look at Singapore. Yes, I know. Been there, done that. Or London.
In the US, the lowest turnover rates are in Democrat strongholds New York and California.
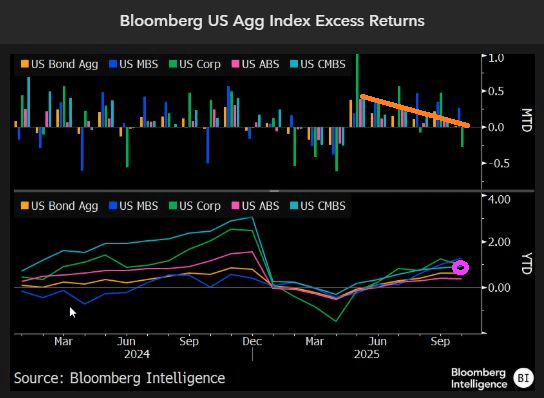
The September drop in mortgage rates is sparking the biggest boom in refinancings since the pandemic. Mortgage-refinancing applications have surged above the decade average, despite that period including the record-breaking refi boom of 2020-21 when rates fell to all-time lows. Purchase-loan demand has also rebounded to its best for this time of year since 2022, yet remains well below pre-pandemic levels.
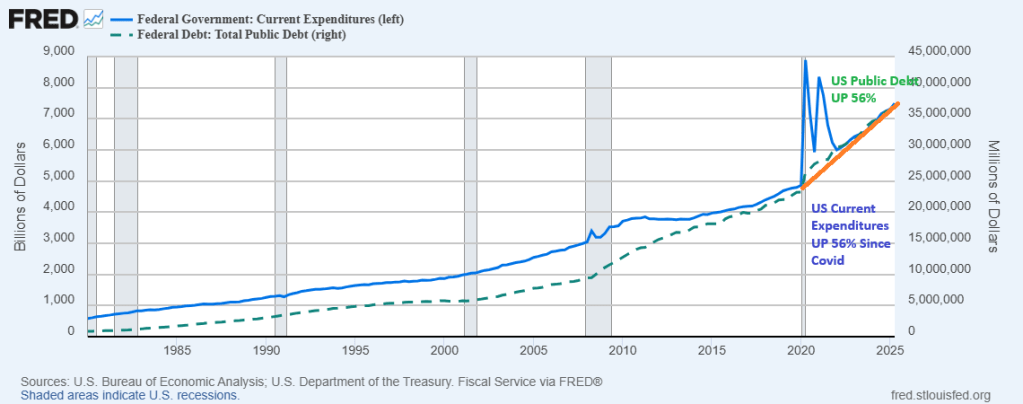
Can we ask the US House and Senate if they will ever return US Federal government spending to pre-Covid levels? Both US Federal government spending and public debt are up 56% since the Covid outbreak in 2020.
The answer is no. Politicians thrive on Federal spending.


You must be logged in to post a comment.