The Fed’s new theme song is “Hold That Tiger” meaning that despite soaring inflation rates, The Fed kept their target rate at 0.25%. Way to really pull a Volcker and raise rates to choke off inflation. … NOT!
However, The Fed doubled the pace of tapering to $30 billion a month. Median forecast shows three rate hikes in 2022, three in 2023.
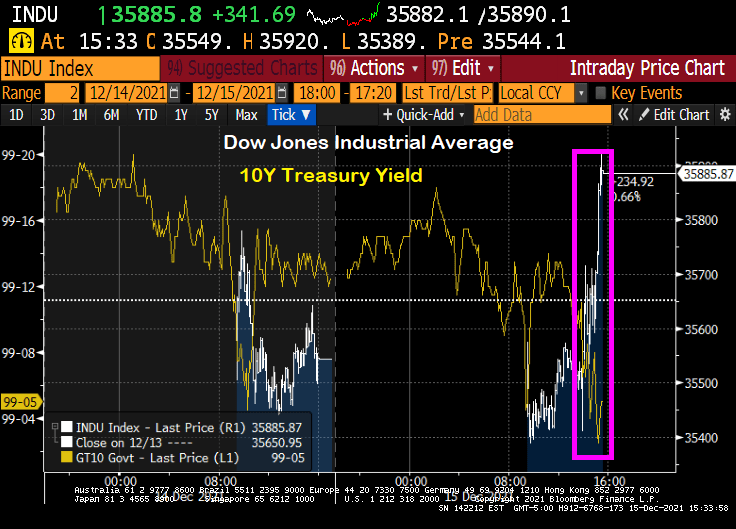
The reaction? The Dow rose 363 points as of 3:36pm EST and the 10-year Treasury yield rose a measly 1.9 bps as markets celebrate The Fed DOING NOTHING TO CURB INFLATION.
If price stability is squandered, financial stability is put at risk. If financial stability is lost, the economy is imperiled and the social contract is threatened.
During the past several quarters, U.S. inflation has surged—now running about triple the Federal Reserve’s 2% target. The surge in prices is unlikely to reverse on its own. The longer that prices are unstable, the greater the challenge to the conduct of macroeconomic policy. The last thing the country needs is its third major economic upheaval in a decade and a half.
The consequences of inflation—and the attendant risks—have long been understood. In 1898 economist Knut Wicksell explained: “Changes in the general level of prices have always excited great interest. Obscure in origin, they exert a profound and far-reaching influence on the whole economic and social life of a country.”
I agree with the op-ed, but as Paul Harvey liked to say, “And now for the rest of the story.”
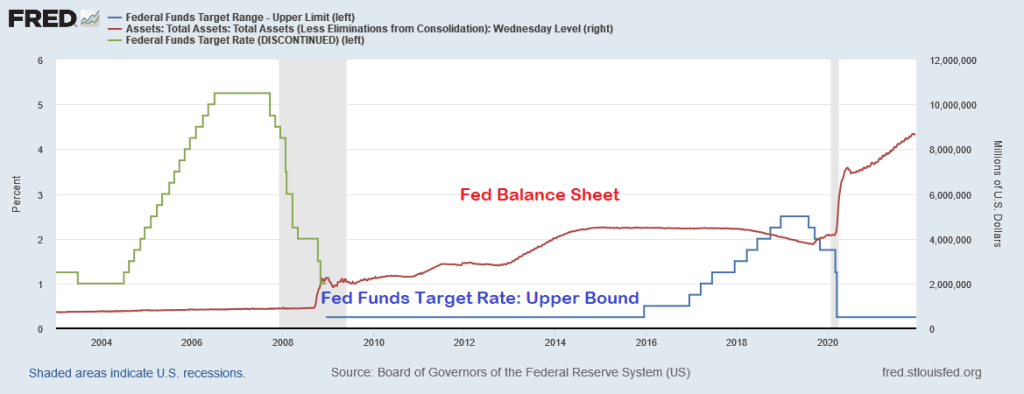
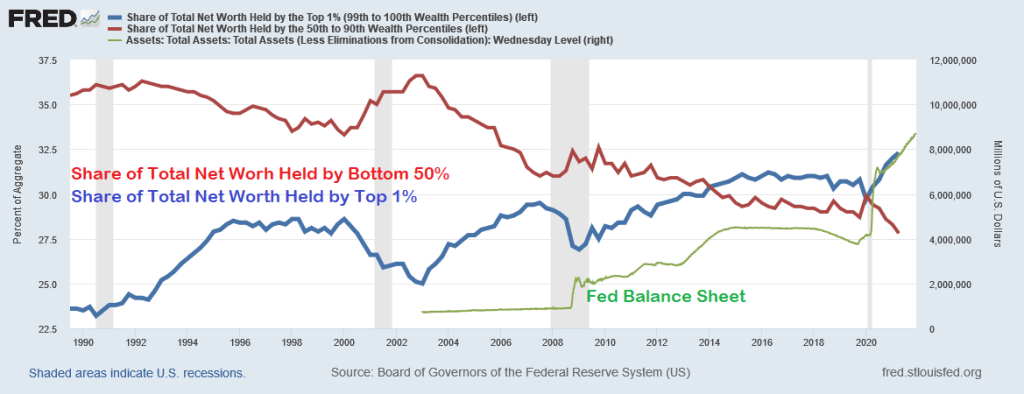
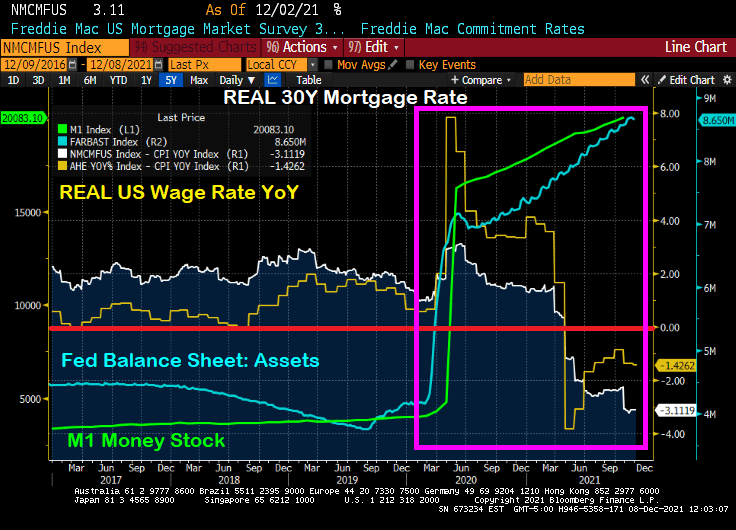
The Federal Reserve is only half of The Federal government “Stimulypto.” Starting in late 2008, The Fed crashed their target rate to 25 basis points and began their quantitative easing (QE) program where The Fed purchased Treasuries and Agency Mortgage-backed Securities (MBS) amongst other assets. Notice in the chart below that QE was adjusted, but never went away and The Fed’s target rate only was increased once before Trump’s election as President, then raised eight times then decreased five times. And no rate increases under Biden. So The Fed scorecard is Obama/Biden: 1 rate increase. Trump: 13 rate changes. And The Fed’s balance sheet has gone bananas since the COVID outbreak.
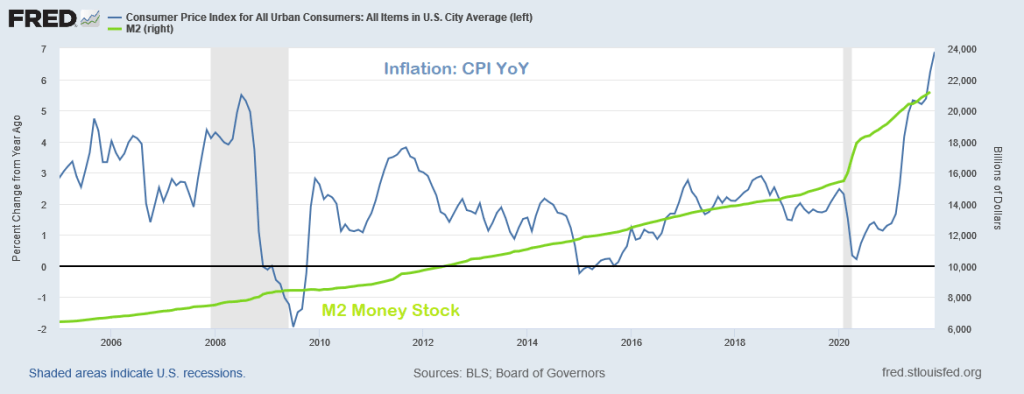
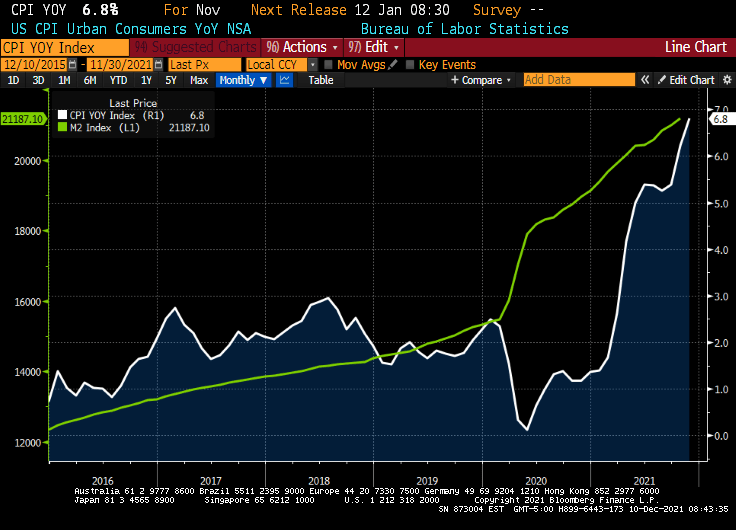
Inflation, as measured by the Consumer Price Index (CPI) didn’t really take-off until March 2021 as a result of STIMULYPTO (excessive monetary stimulus + Federal government spending).
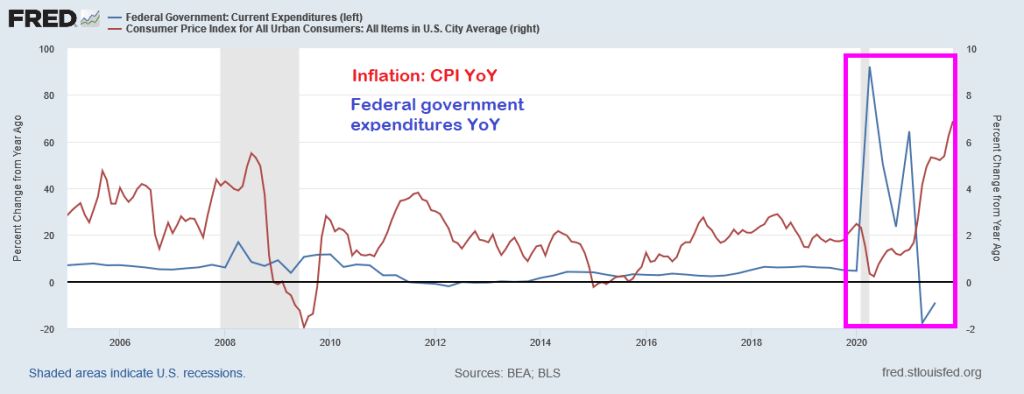
Here is the Federal government spending surge that helped generate the highest inflation in a generation.
So while the op-ed author blames inflation solely on The Federal Reserve, The Fed was unable to achieve its inflation goal for much of the post-financial crisis period. It was the double whammy of Fed monetary stimulus + Federal government stimulus (spending) that pushed inflation to 6.8%.
Following Paul Harvey’s “The Rest of the Story,” I choose baseball player Whammy Douglas to represent the double whammy of Fed + Fed government stimulus to produce inflation. THAT is the rest of the story.
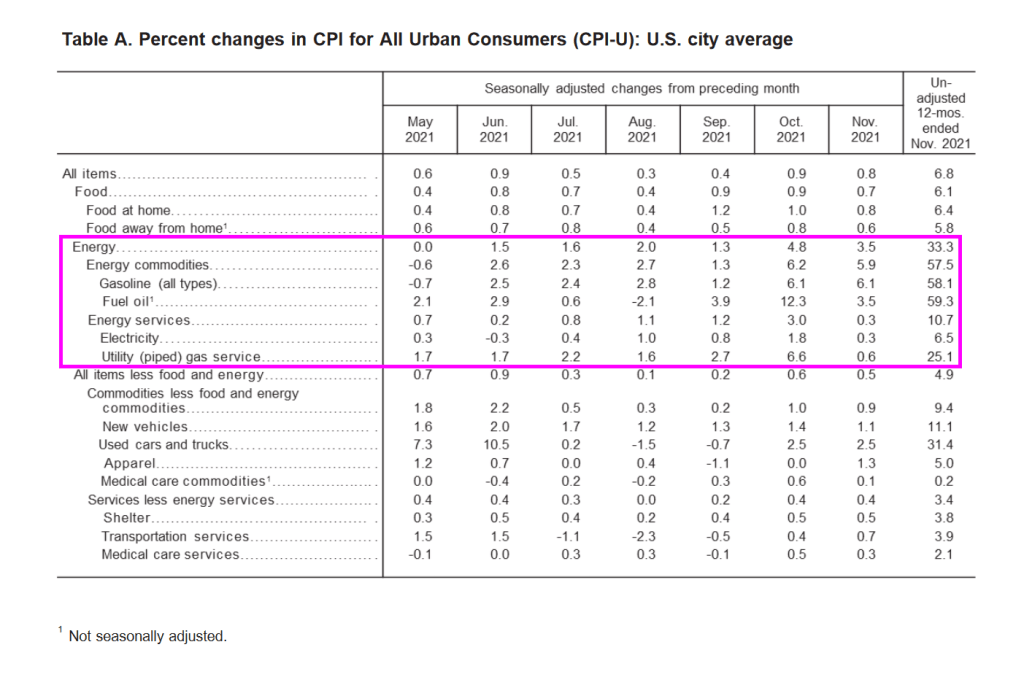
Throw in the Biden Administration’s war on fossil fuels (driving up energy costs by over 50%) and we have a TRIPLE WHAMMY!!
The WSJ op-ed author was focused only blaming The Fed. Sorry, it was a Double Whammy.
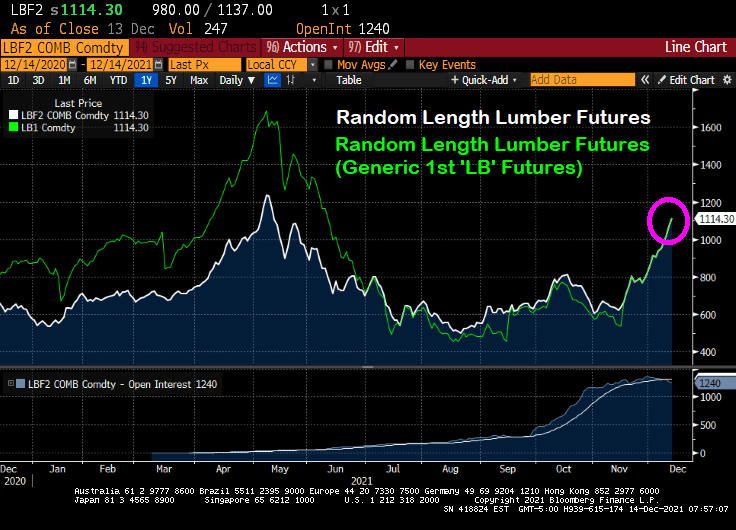
According to Markets Insider, lumber prices are up 127% from its most recent low. With demand high and supplies low, record low interest rates still drive homeowners to the market, so much that builders are struggling to keep up.
Note the surge in lumber futures prices back in April and May 2021 that eased. But lumber futures prices are gaining steam again.
Let’s see what happens to lumber prices and new home prices if and when The Federal Reserve decides to takes its gargantuan foot off the monetary accelerator pedal.
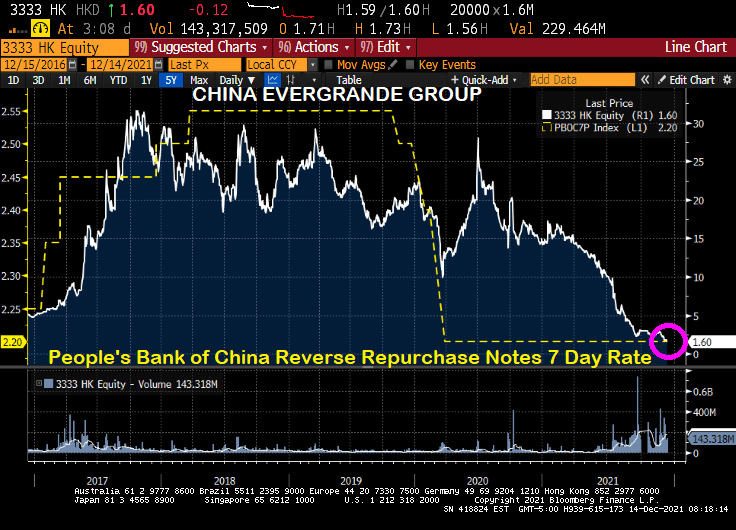
In other housing-related news, China’s Evergrande remains in the news as its stock price founders.
“The Congressional Budget Office and the staff of the Joint Committee on Taxation project that a version of the bill modified as you have specified would increase the deficit by $3.0 trillion over the 2022–2031 period.”
The Penn-Wharton Budget Model estimates that — if Congress follows White House policy to make most provisions permanent — then Build Back Better will reduce the long-term GDP by 2.8 percent, reduce wages by 1.5 percent, and reduce work hours by 1.3 percent. The only thing it will expand is government debt, by 25 percent.
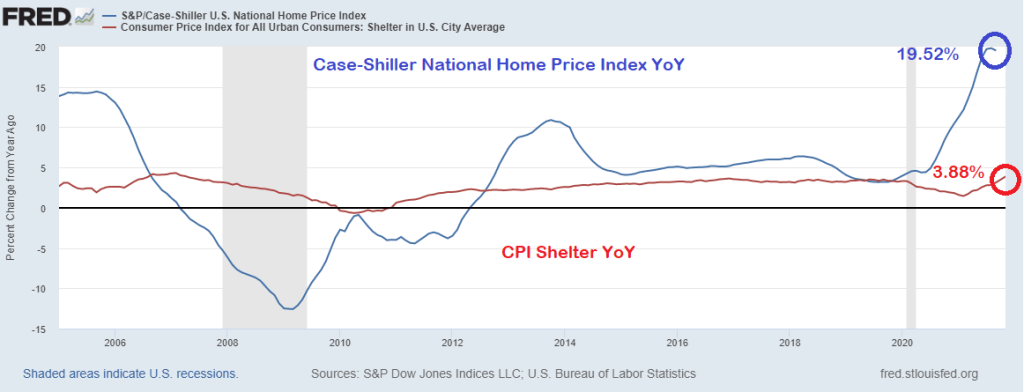
But that 6.9% YoY is very misleading because of the strange way the Bureau of Labor Statistics measures the largest asset in most households’ expenditures: housing.
The BLS measures inflation in housing using the Shelter measurement. Which was only 3.88% YoY. The problem is that the Case-Shiller National Home Price Index was 19.52% in its last reading. That is quite a discrepancy.
So, if we substitute the Case-Shiller National home price index for the CPI Shelter, we get an inflation rate of greater than 11%.
The U.S. is poised to enter Year Three of the pandemic with both a booming economy and a still-mutating virus. But for Washington and Wall Street, one Covid aftershock is starting to eclipse almost everything else.
Already-hot inflation is forecast to climb even further when November data comes out on Friday, to 6.8%. That would be the highest rate since Jimmy Carter was president in the early 1980s — and in the lifetimes of most Americans.
And the CPI change since last year, according to the Federal Reserve of St Louis FRED is a staggering 16.262%.
And with U.S. Jobless Claims plunge to 52-year low, its about time that The Fed begins removing the humongous monetary stimulus.
After all, largely thanks to Federal Reserve policies, we have seen the greatest wealth redistribution in US history … to the top 1%.
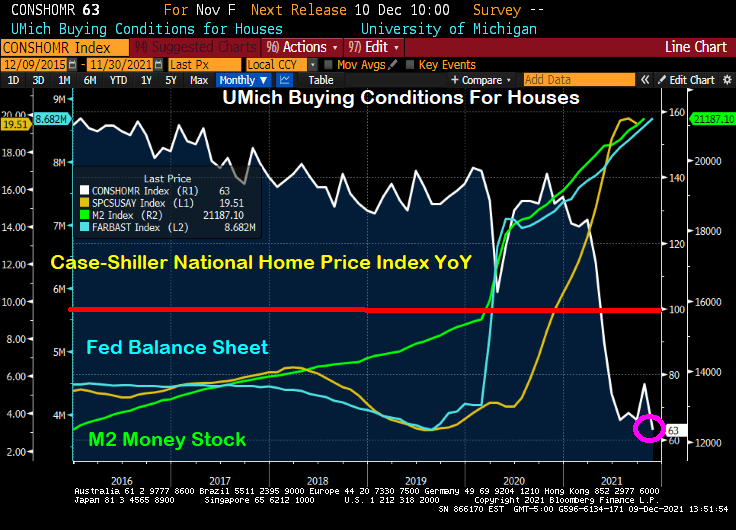
Just look at this chart of the University of Michigan Buying Conditions For Houses index. It was positive (meaning above 100) until shortly after COVID struck and The Federal Reserve rode to the rescue. National home price growth was already at 4.57% YoY in March 2020, then ballooned to 19.51% YoY at the last reading.
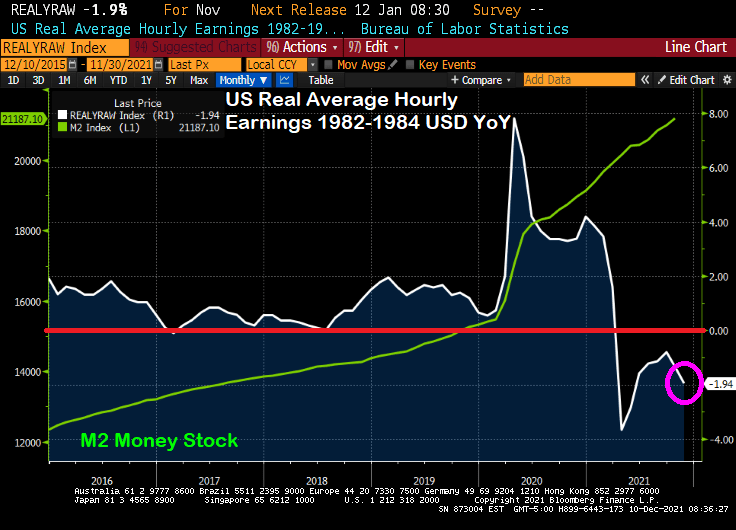
Here is the same chart with the broader M2 Money stock and The Fed’s Balance sheet. Same results, just not as dramatic as M1.
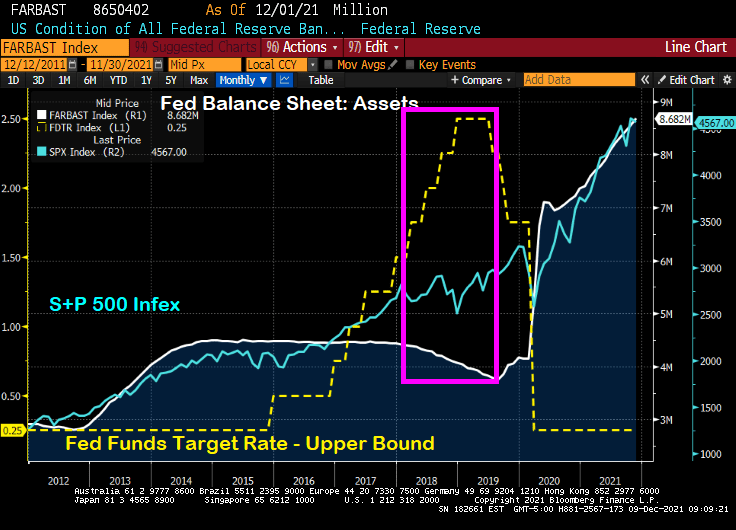
We will soon find out if The Federal Reserve will announce a rate hike or taper news. They are likely to confirm tapering, particularly if they believe that tapering won’t roil markets. After all, then Fed Chair Janet Yellen and the FOMC decided to let the Fed’s balance sheet taper (white line) while, at the same time, increasing the Fed’s target rate (yellow line). The S&P 500 index rose 9.5% over the taper/rate increase period of 12/29/2017 to 8/30/2019.
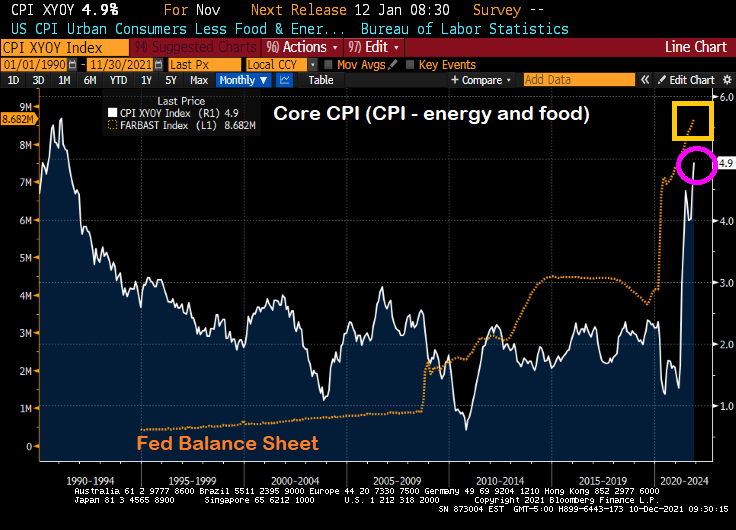
But since Stimulypto (2/28/2020 to 11/30/2021), the Fed’s balance sheet doubled+ from $4,158,637 to $8,681,771. And The Fed Funds Target Rate (UB) immediately fell from 1.75% in February 2020 to 0.25% in March 2020 … and has stayed there ever since. The S&P 500 index rose 54.6% over this Stimulypto period.
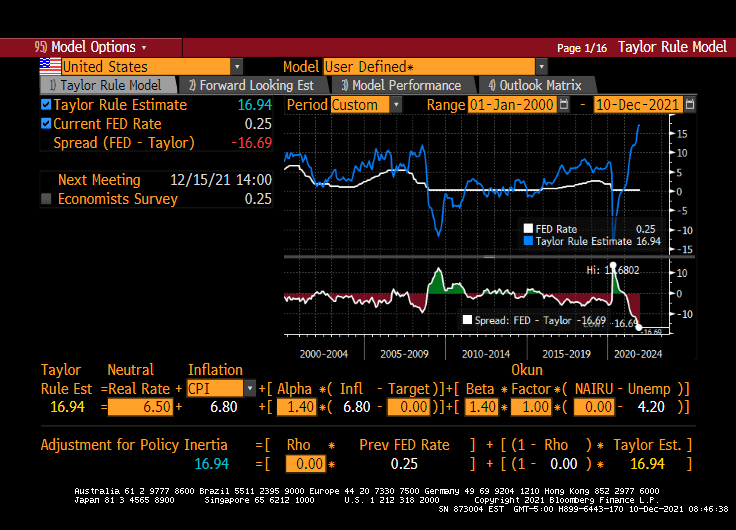
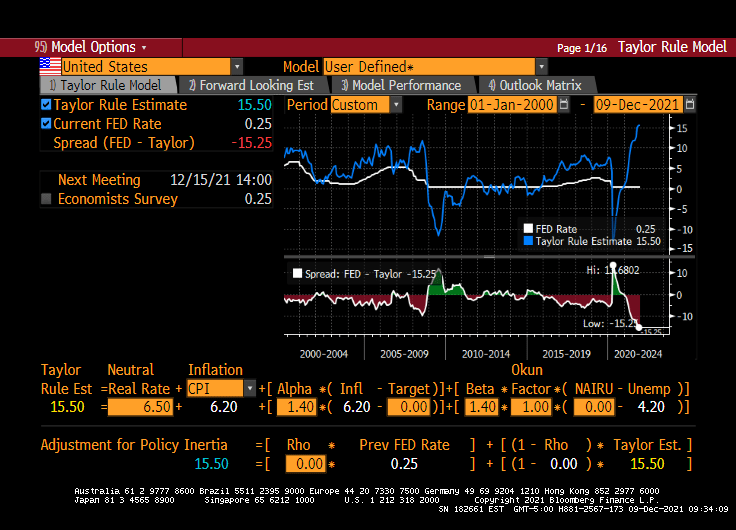
But The Fed’s upcoming decision on December 15, 2021 may be a Yellen-pivot (taper balance sheet, but raise The Fed Funds Target rate). But, then again, maybe not. The Fed is getting really bad about forward guidance and choose instead to surprise us. Hence, this is why an a-political rule is preferred (such as the Taylor Rule).
Unfortunately, the Taylor Rule infers a Fed Funds Target rate of 15.50% (using CPI YoY running at 6.20% YoY. If The Fed raises their target rate by 25-50 basis points at the December 15th meeting, color me surprised.
So, the Powell Pivot may just be the Yellen Pivot after all.
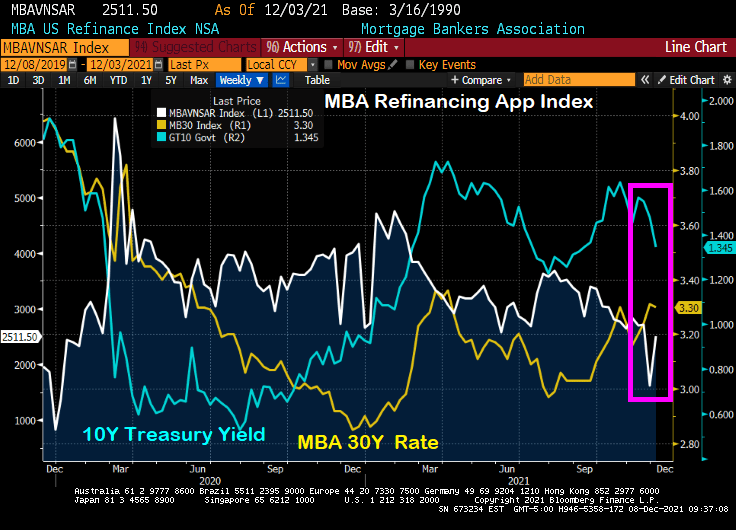
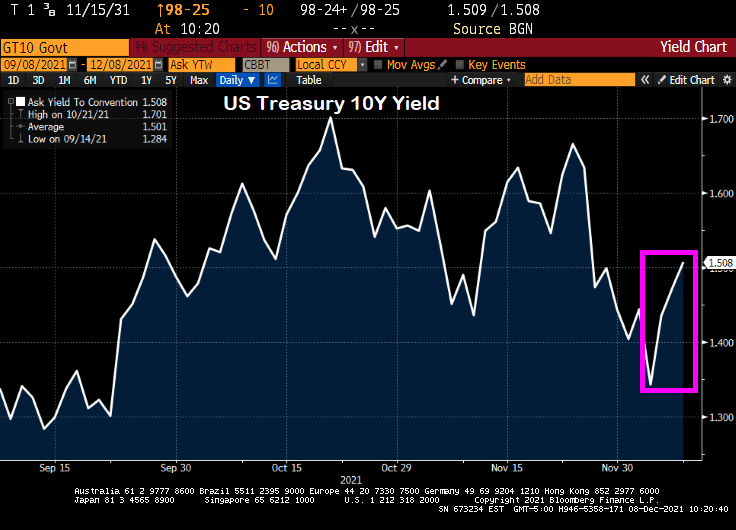
Despite the “Talk, Talk” from The Federal Reserve about balance sheet taper and rate “normalization,” we actually saw the 10-year Treasury yield fall from 1.6651% on 11/23/2021 to 1.343 on 12/3/2021. While the 30-year mortgage rate only fell from 3.31% to 3.3%, it is the SIGNAL that The Fed is sending that people should refinance their mortgages ASAP.
You can see the rise in mortgage refinancing applications of 56% week-over-week (WoW) (white line) with the drop in the 10-year Treasury yield (blue line) despite the relatively small drop in the Mortgage Bankers Association (MBA) tiny drop in their 30-year mortgage rate index.
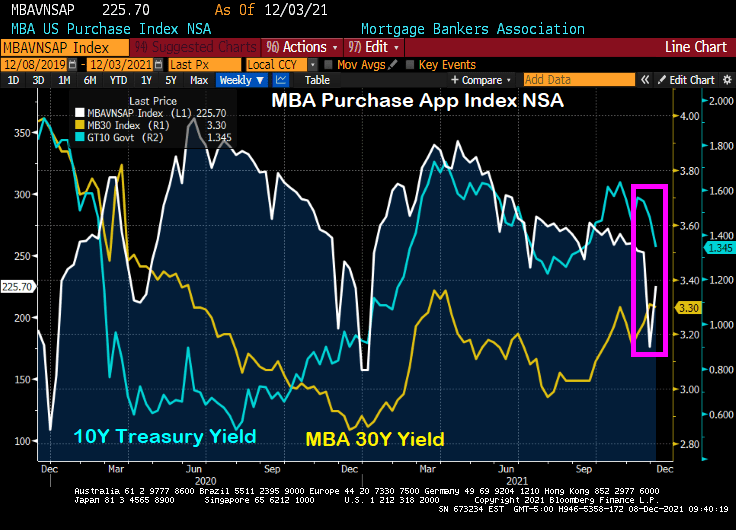
Ditto for the MBA mortgage purchase application index. The drop in the US Treasury yield (blue line) resulted in a 28% WoW increase in mortgage purchase applications.
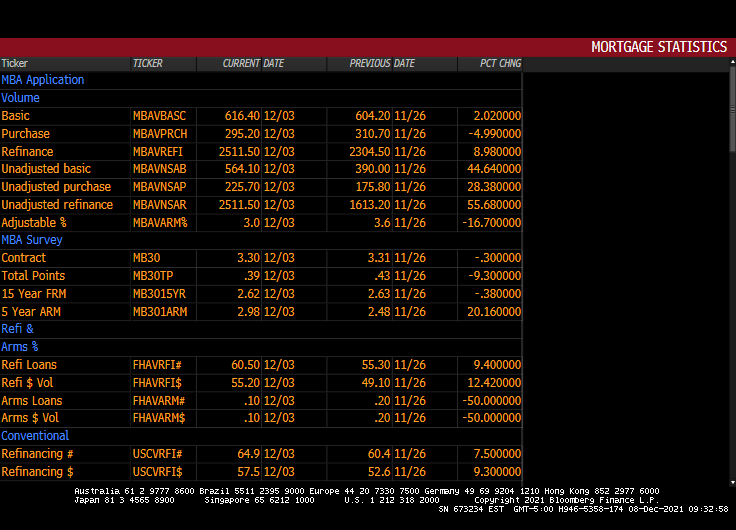
Here is the table of MBA data for the week of 12/03.
Please note that the 10-year Treasury yield have jumped since 12/03 indicating that mortgage application activity for the week of 12/10 will be lower.
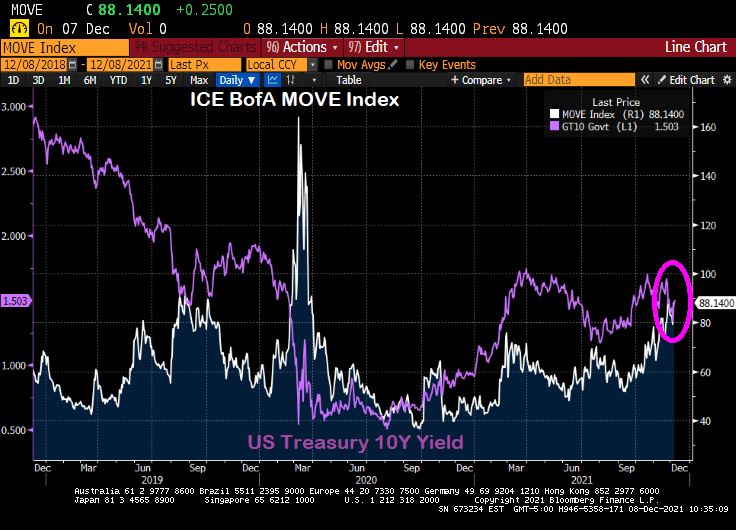
Here is the MOVE bond volatility index and the US Treasury 10-yield chart. Can you spot the COVID outbreak??


You must be logged in to post a comment.