I just watched Dennis Quaid in “Reagan”. Excellent film. But it reminded me of how Reagan sank the Soviet Union: by outspending the Soviet Union on the arms race. It worked! The Soviet Union, hamstrung by grossly inefficent central planning, couldn’t keep up and collapsed under President George H.W.Bush.
Fast forward to today. Starting with Barack Obama and Joe Biden in 2009, following the financial crisis in 2008. The Federal government ramped up Federal spending, and Federal debt. While The Federal Reserve, the hand maiden to the Federal government, ramped up M2 Money supply.
“You never want a serious crisis to go to waste. And what I mean by that is an opportunity to do things that you think you could not do before.” – Rahm Emmanuel
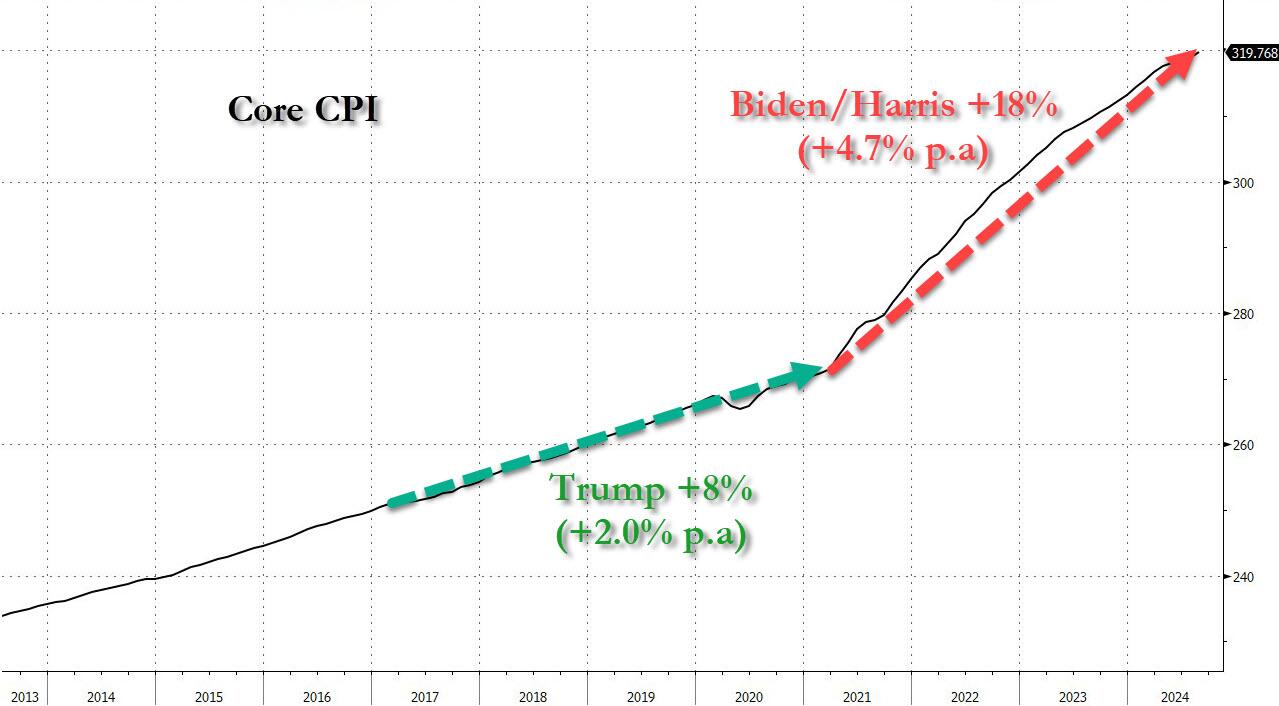
Then came Biden/Harris who drove Federal debt and spending to absurb level (orange box). Like the financial crisis, fans of big government and big government spending will utter the word “Covid.” But that is gross misleading. Covid was the excused for wild spending and debt issurance. And MORE Fed money printing. It’s almost as if Obama/Biden/Harris were replicating Reagan’s bankrupcy strategy in reverse! That is, collapsing the US from within.
As we are all painfully aware, the US Debt now stands at $36 TRILLION with $220.3 TRILLION in unfunded liabilities. Too bad total US Assets are only $217 TRILLON.
Do I believe that Obama/Biden/Harris want a “Great Reset”? Absolutley. Just look at our fiscally unsustable open borders and our politiicians blatanly lying to us. :Like Ohio’s Senator Sherrod Brown who brags about his helping write the border bill that would reverse Trump’s deportations and fund the speeding up of immigration.
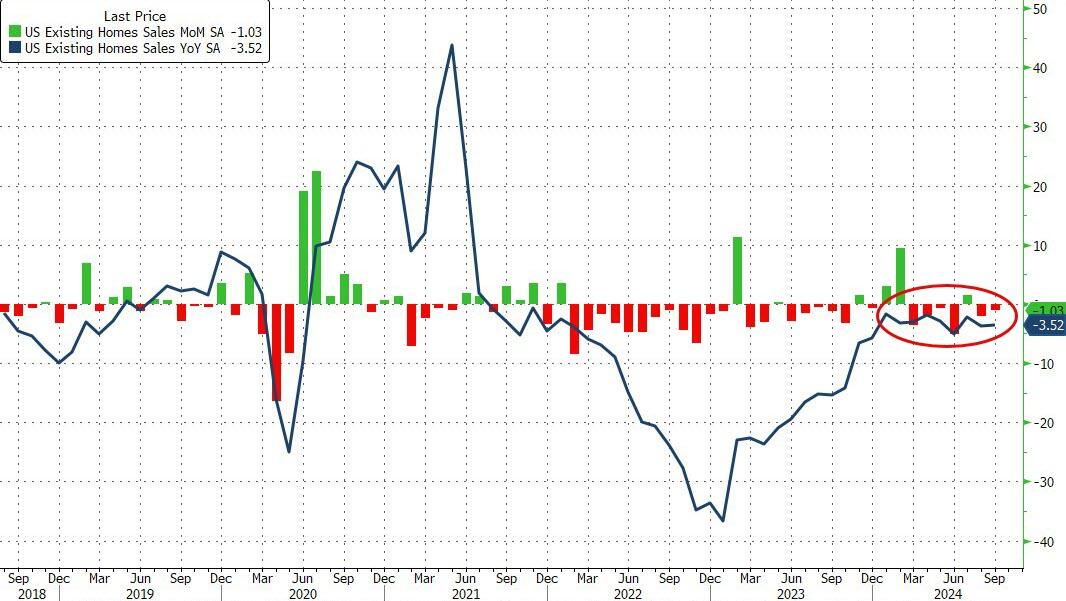
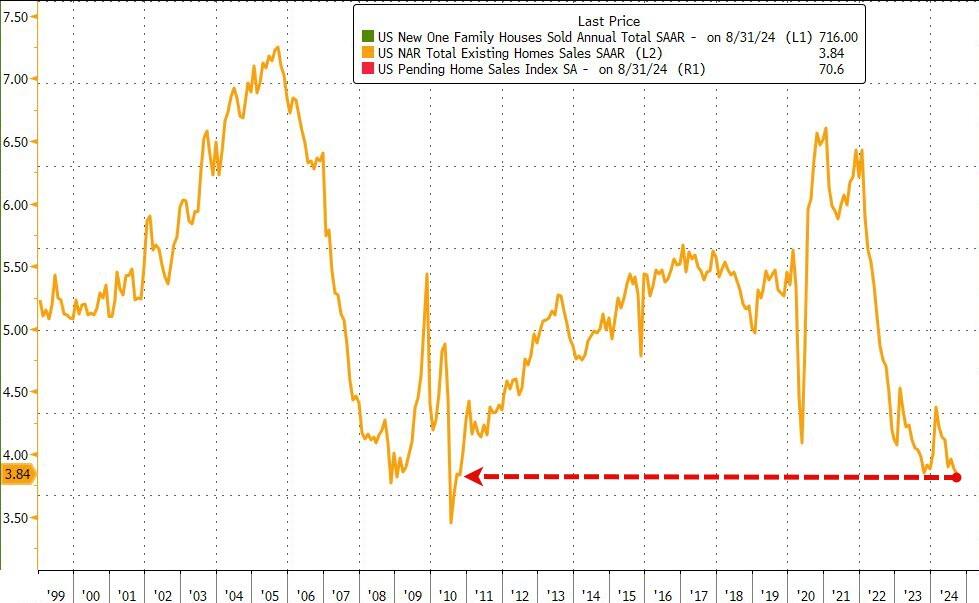
Total sales SAAR dropped to 3.84mm, the lowest since 2010…
Source: Bloomberg
Even with the weaker September sales figures, “factors usually associated with higher home sales are developing,” Lawrence Yun, NAR chief economist, said in his ubiquitously optimistic statement.
“There are more inventory choices for consumers, lower mortgage rates than a year ago and continued job additions to the economy.”
First-time buyers made up 26% of purchases, matching an all-time low.
Some 1.39 million homes were for sale in September, up 23% from a year earlier, the NAR report showed. The supply of homes still remains below pre-pandemic levels.
At the current sales pace, available inventory would last 4.3 months, the longest in more than four years.
The median sales price rose 3% in September from a year ago to $404,500.
Around the country, previously owned home sales dropped in three of four regions, including a 1.7% decline in the South to the slowest pace since the start of 2012.
Closings fell 2.2% in the Midwest to a 13-year low, and 4.2% in the Northeast. Sales rose 4.1% in the West, driven by California and Arizona.
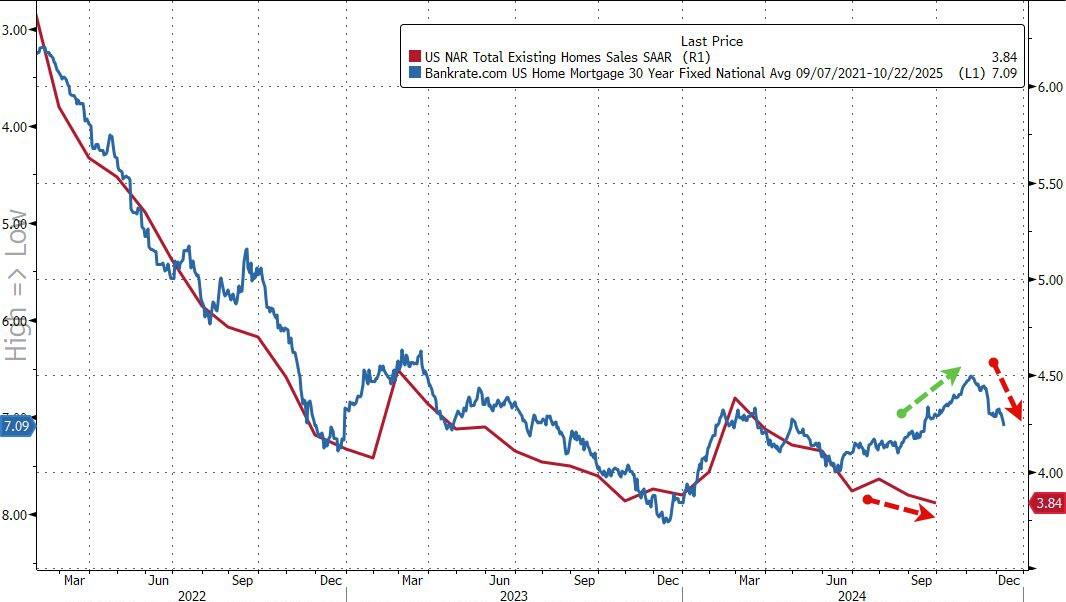
While the short-term (lagged) may bring an improvement in existing home sales (based on the lagged impact of declining mortgage rates), as the chart below shows, since The Fed unleashed its rate0cutting cycle, mortgage rates have risen aggressively once again…
Source: Bloomberg
…not a good sign for the housing market’s affordability.
However, inventory problems could persist since “84 percent of mortgaged homes have a rate below 6%, so the number of sellers that would be financially incentivized to sell would remain limited,” Odeta Kushi, deputy chief economist at title insurance giant First American Financial Corp. said in the report.
Tennessee Ernie Ford sang it best. $36 tons of debt. Another day older and deeper in debt. Notice virually no political candidate will acknowledge or discuss.
The federal government spent $1.8 trillion more than it collected in tax revenue in fiscal year 2024, according to figures released Friday by U.S. Treasury Department.
Congress has run a deficit every year since 2001. In the past 50 years, the federal government has ended with a fiscal year-end budget surplus four times, most recently in 2001.
The deficit for fiscal 2024 was $1.8 trillion, or $138 billion higher than the prior year’s deficit. As a percentage of GDP, the deficit was 6.4%, an increase from 6.2% in fiscal 2023. The 2024 deficit is $196 billion lower than in 2023, excluding the effect of the Supreme Court’s 2023 decision in Biden v. Nebraska regarding student loan programs, according to year-end data from the September 2024 Monthly Treasury Statement of Receipts and Outlays of the United States Government.
And then we have the REAL disaster in the form of unfunded liabilities of $220 TRIILLION (or $651,000 per citizen). For a family of 5 citizens (like my household), that amounts to $3.26 MILLION per household of 5.
Imagine Kamala’s filibustering a response to a question about the national debt and unfunded liabilities. Other than “Donald Trump.”
I would like to see Kamala Harris explain why mortgage purchase applications are down -60% under Biden/Harris Presidency. Other than a word salad answer. Or Cottage Cheese.
Mortgage applications decreased 17.0 percent from one week earlier, according to data from the Mortgage Bankers Association’s (MBA) Weekly Applications Survey for the week ending October 11, 2024.
The Market Composite Index, a measure of mortgage loan application volume, decreased 17.0 percent on a seasonally adjusted basis from one week earlier. On an unadjusted basis, the Index decreased 17 percent compared with the previous week. The seasonally adjusted Purchase Index decreased 7 percent from one week earlier. The unadjusted Purchase Index decreased 7 percent compared with the previous week and was7 percent higher than the same week one year ago.
The Refinance Index decreased 26 percent from the previous week and was 111 percent higher than the same week one year ago.
Housing prices are up 34.2% under Biden/Harris while mortgage rates are up 138.6%.
It turns out that Powell’s “emergency” 50bps rate cut was – drumroll – another major policy mistake by the Fed. Or it is Presidential election interference by The Biden/Harris Administration giving Cacklin’ Kamala as talking point?
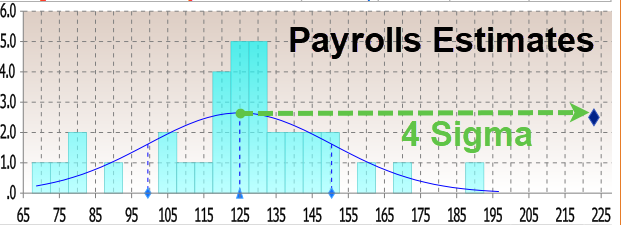
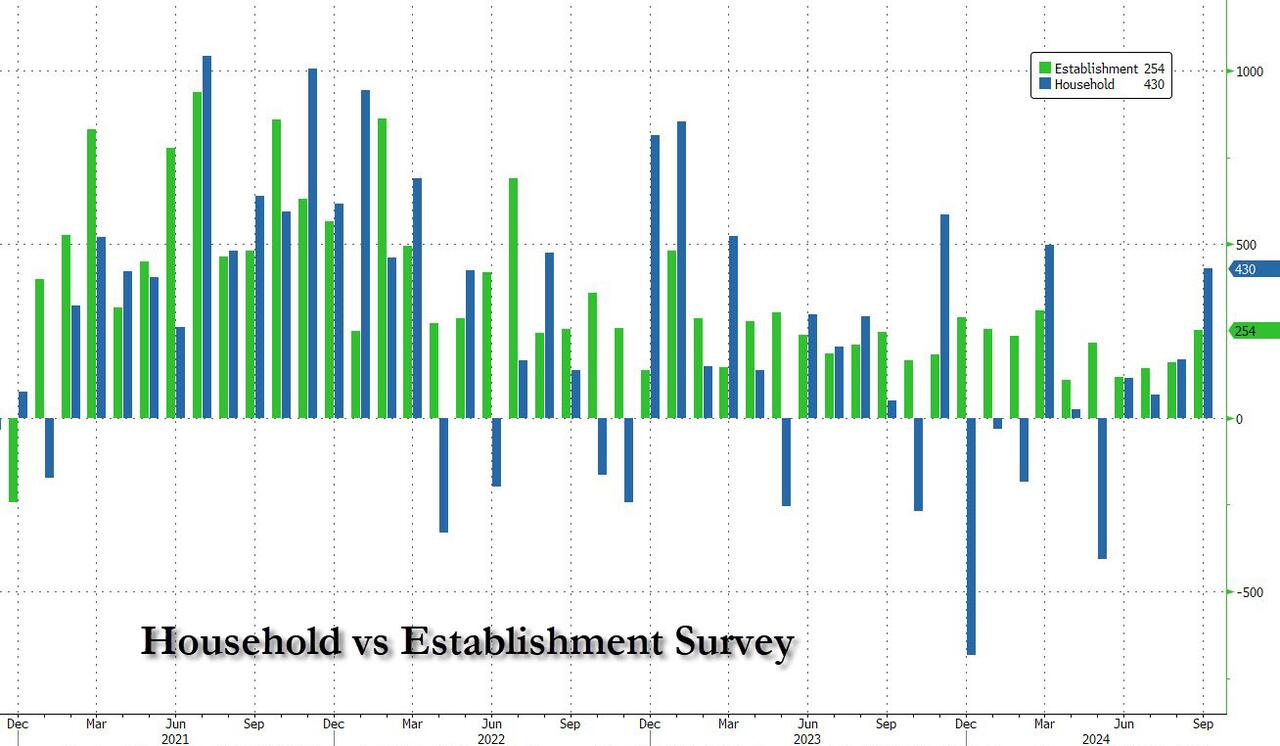
Moments ago, the BLS reported that at a time when prevailing consensus was for jobs to continue their recent downward slide sparked by the near-record annual jobs revision and several months of downbeat jobs reports, in September the US unexpectedly added a whopping 254K jobs, the biggest monthly increase since March…
There’s more: unlike previous months where we saw repeat downward job revisions, the BLS said that both prior months were revised up, to wit: the change in total nonfarm payroll employment for July was revised up by 55,000, from +89,000 to +144,000, and the change for August was revised up by 17,000, from +142,000 to +159,000. With these revisions, employment in July and August combined is 72,000 higher than previously reported.
Some context: as UBS notes, the moving six-month average on nonfarm payrolls is 167k. The estimate is that 150k is about consistent with a return of the economy to trend growth. Which means that inflation is about to come back with a vengeance, just as the Fed launches its easing cycle.
Remarkably, while payrolls jumped by the most in half a year, the number of employed people also surged, rising by a whopping 430K, also the biggest one-month jump since March.
It wasn’t just the payrolls, however, which came in far stronger than estimates: the unemployment rate also came in stronger than expected, and thanks to the jump in employed workers coupled with the decline in unemployed workers (from 7.115MM to 6.834MM), it dropped from 4.2% to 4.1% (and down from 4.3% two months ago which spared the entire recession panic).
Among the major worker groups, the unemployment rate for adult men (3.7 percent) decreased in September. The jobless rates for adult women (3.6 percent), teenagers (14.3 percent), Whites (3.6 percent), Blacks (5.7 percent), Asians (4.1 percent), and Hispanics (5.1 percent) showed little or no change over the month.
And here is the rub, because in a vacuum the super strong jobs numbers would have been fantastic, the only issue is that the September blowout comes as the Fed launches an easing cycle and as wages are once again rising as we have warned for the past 3 months. Indeed, in September, the average hourly earnings rose 0.4% sequentially, beating the estimate of 0.3%, while on an annual basis, wage growth was 4.0%, up from an upward revised 3.9% and beating the 3.8% estimate.
One note here: the average workweek for all employees edged down by 0.1 hour to 34.2 hours in September, which means the hourly earnings increase is not “pure” but rather a function of denominator adjustments. In manufacturing, the average workweek was unchanged at 40.0 hours, and overtime edged down by 0.1 hour to 2.9 hours. The average workweek for production and nonsupervisory employees on private nonfarm payrolls remained at 33.7 hours.
What sector had the biggest growth? UNPRODUCTIVE government workers! A record 785,000 government workers were added in September, pushing total govt workers also to a new record high.
The Biden/Harris Administration has given away billions of dollars to foreign nations (like Ukraine) and illegal immigrants so far this year,
– $24,400,000,000 to Ukraine.
– $11,300,000,000 to Israel.
– $1,950,000,000 to Ethiopia.
– $1,600,000,000 to Jordan.
– $1,400,000,000 to Egypt.
– $1,100,000,000 to Afghanistan.
– $1,100,000,000 to Somalia.
– $1,000,000,000 to Yemen.
– $987,000,000 to Congo.
– $896,000,000 to Syria.
– $9,000 per illegal immigrant that has entered the U.S.
And claim that FEMA has no money left for Hurricane Helene victims who have received only $750 per person. So I have plenty of reasons to have no trust or confidence in the Biden/Harris Mal-administration.
Options imply a +/-1.1% move in S&P 500 for the 18-Sept FOMC meeting; this compares to an average of +/-1.2% move priced into SPX ahead of FOMC meetings since the beginning of 2022.
Arguably, this is an unusually important FOMC meeting due to the expected start of a cutting cycle.
On average, the S&P 500 has moved +/-1.3% during FOMC events since the beginning of 2022, coming above options implied moves.
In the July FOMC meeting the index moved +/-1.6% vs. an options implied expectations for a +/-1.1% move.
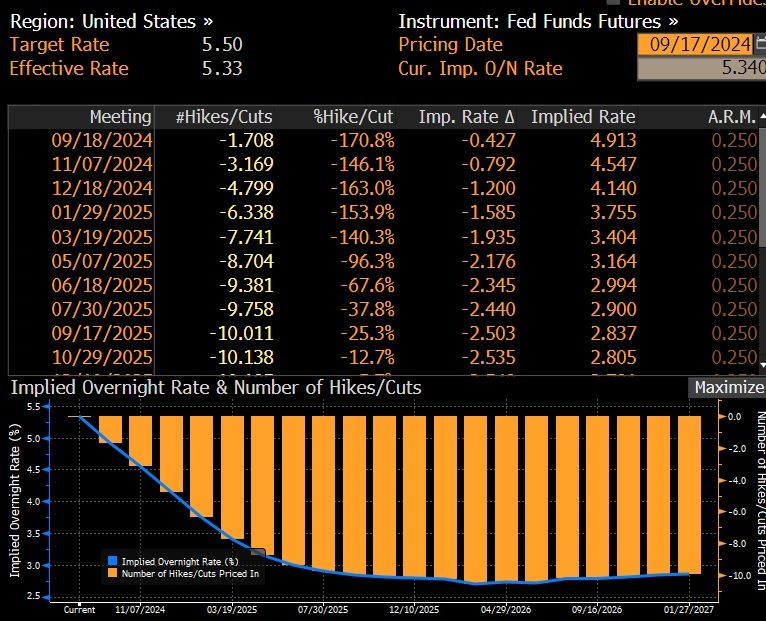
Goldman’s economists expect the September FOMC meeting to be the start of the Fed easing cycle with a 25bp rate cut followed by two consecutive 25bp rate cuts in November and December, and an eventual terminal rate of 3.25-3.5%.
They see differing asset performances around the start of the easing cycle depending on what motivated the Fed cuts.
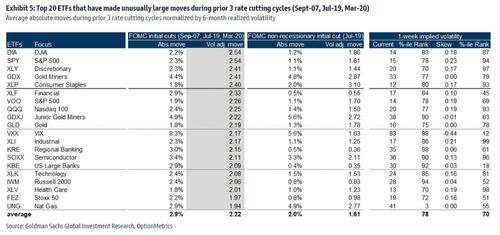
Goldman analyzed moves across stocks and ETFs during the first Fed rate cut in the prior 3 Fed easing cycles (18-Sep-2007, 31-Jul-2019 & 3-Mar-2020).
Rate cuts during the 2007 and 2020 easing cycles were associated with a recession while the 2019 cut was due to a growth scare.
In the tables below are the top 20 names that saw unusual moves during the prior 3 Fed easing cycles and for the 2019 cycle separately.
Financials and Tech were major movers during the beginning of the prior 3 Fed easing cycles while the 2019 cycle also saw unusual moves in Consumer Staples.
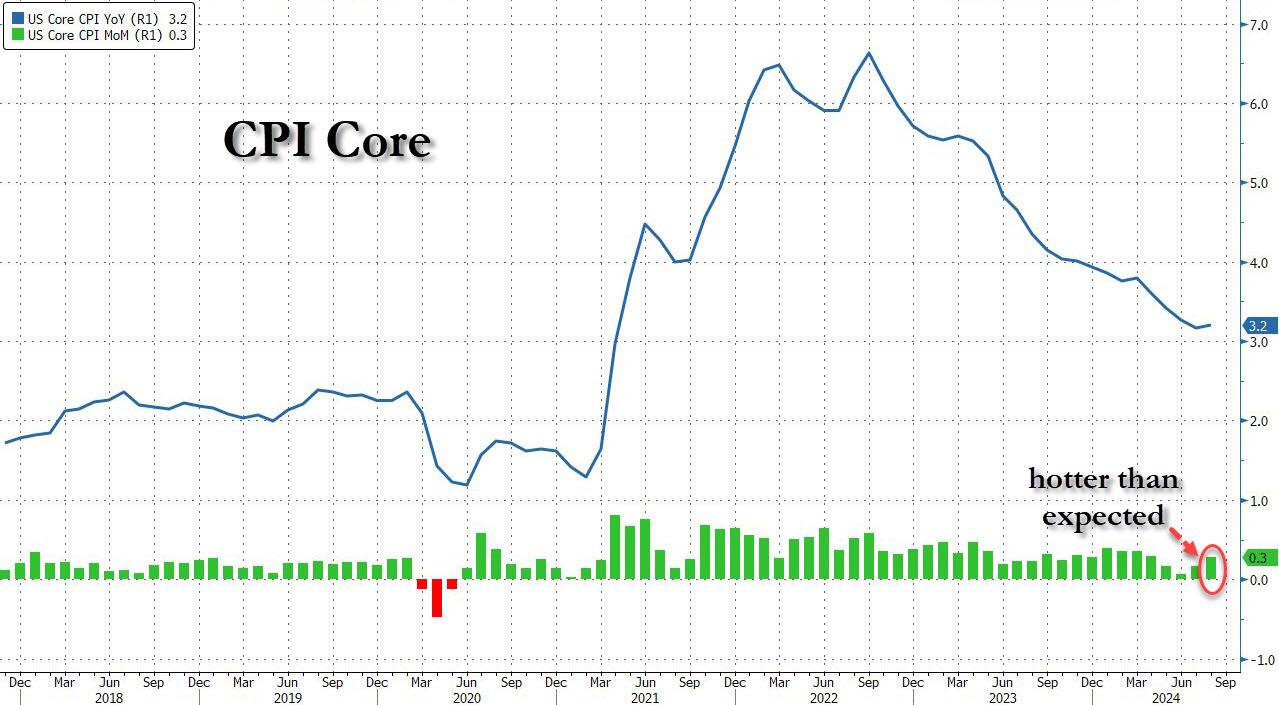
Following last month’s modest miss in CPI which sparked speculation about a 50bps cut, which was then boosted by the jobs report miss and the huge downward revision, moments ago the BLS reported that – as only a handful of Wall Street strategists warned – CPI actually came in hotter than expected at the core level, rising 0.3% MoM vs expectations of a 0.2% print, with all remaining metrics coming in line, to wit:
CPI 0.2% MoM (or 0.187% unrounded), Exp. 0.2% – in line
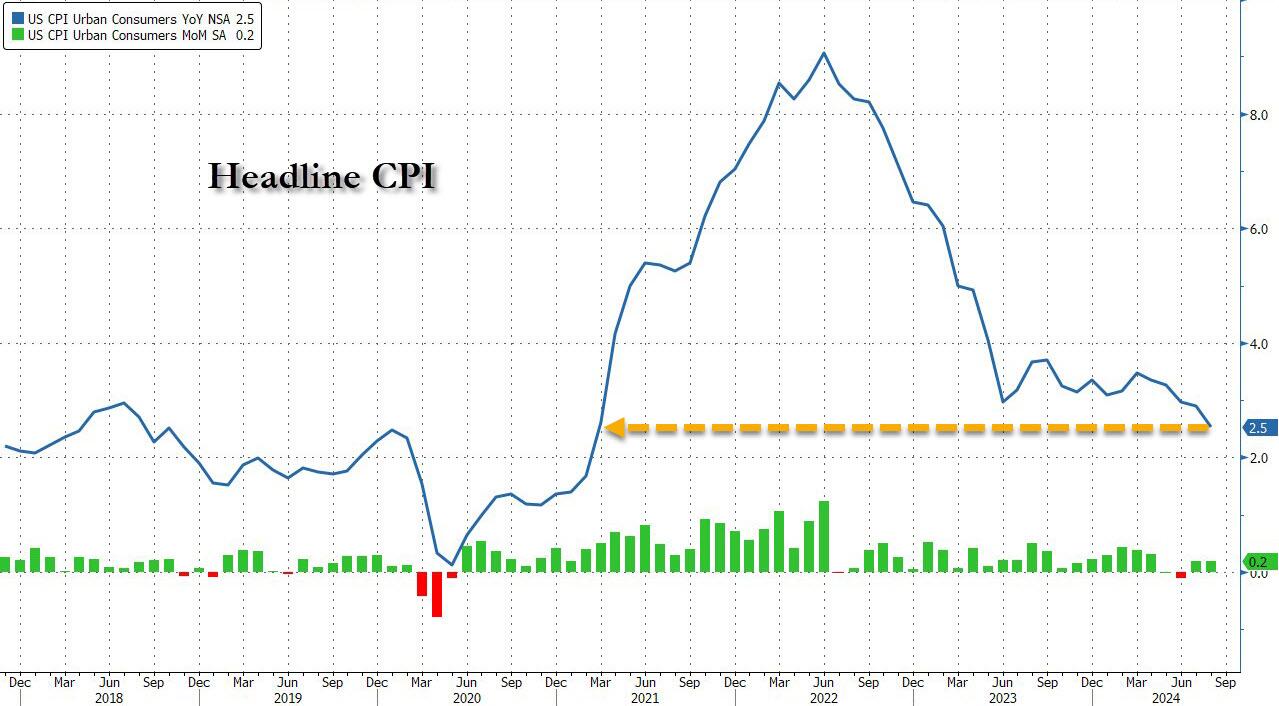
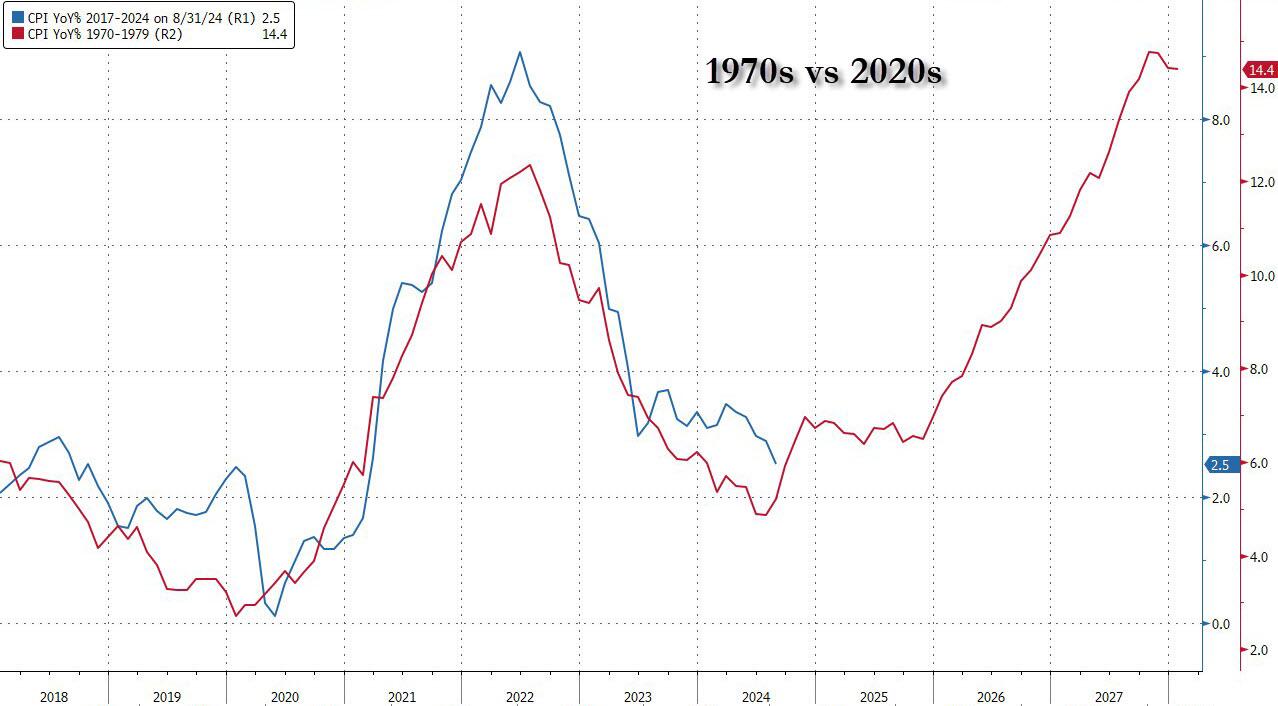
And visually, here is the headline print, where the annual CPI increase dropped to just 2.5% from 2.9%, the lowest since February 2021…
.. and the core….
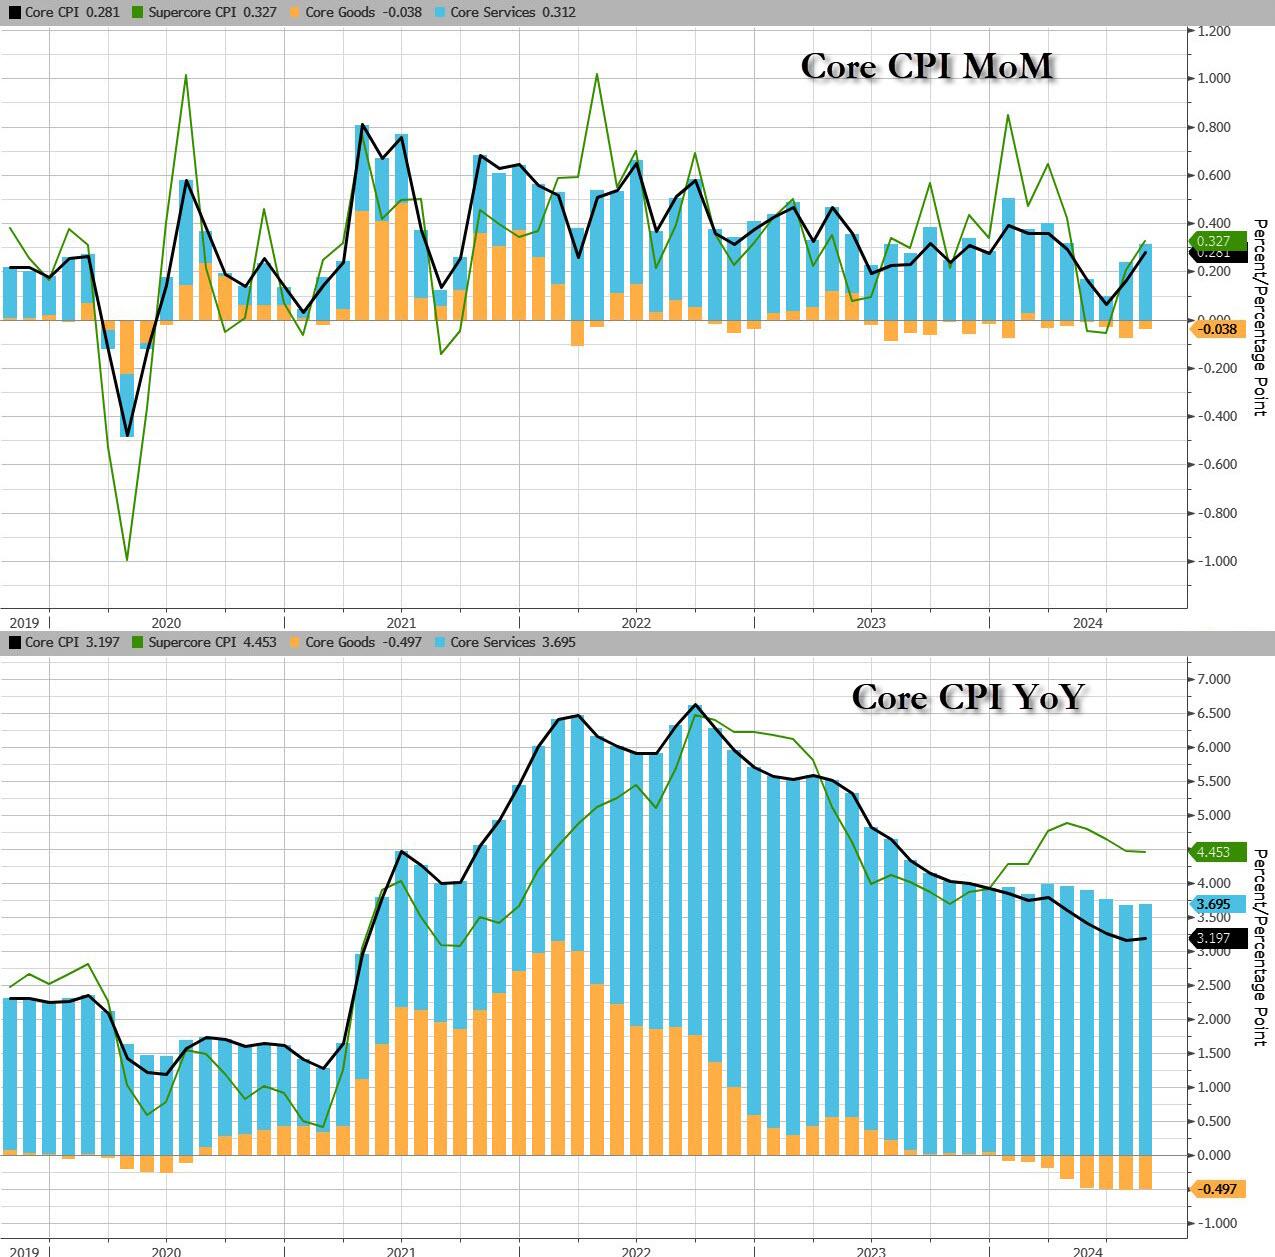
…. as goods deflation is stalling and may even print positive in the coming months, while core service inflation remains the biggest driver.
That was s the 51st straight month of MoM increases in Core CPI, and a new record high.
Under the hood, used car prices fell 1.0%, moderating from last month’s 2.3% drop, while airline fares jumped 3.9%, a big reversal to last month’s bizarre -1.2% drop. Car insurance costs jumped another 0.6%, after rising 1.2%; furniture prices dropped 0.3% reversing last month’s 0.3% rise.
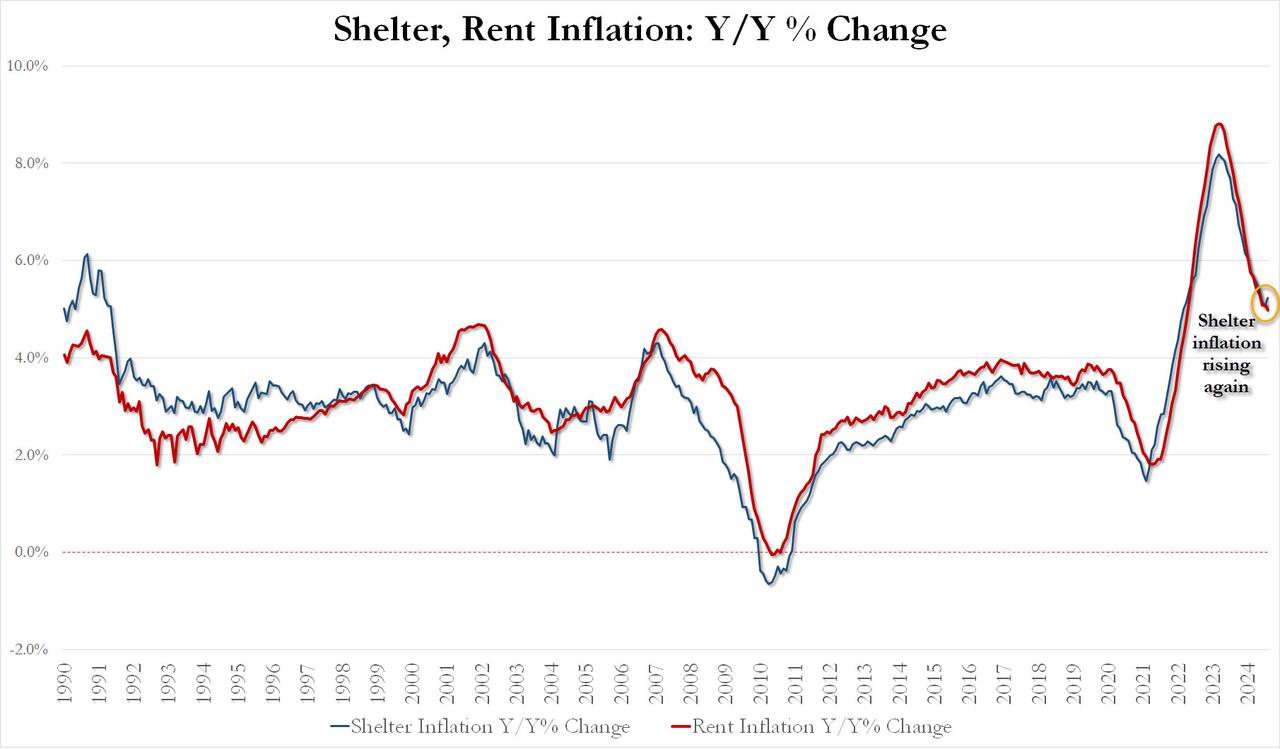
Perhaps more worrying is the fact that while rent inflation has flatlined, shelter inflation posted its first increase since early 2023!
August Shelter inflation up 0.43% MoM and up 5.23% YoY vs 5.05% in July
August Rent Inflation up 0.39% MoM and up 4.97% YoY vs 5.09% in July
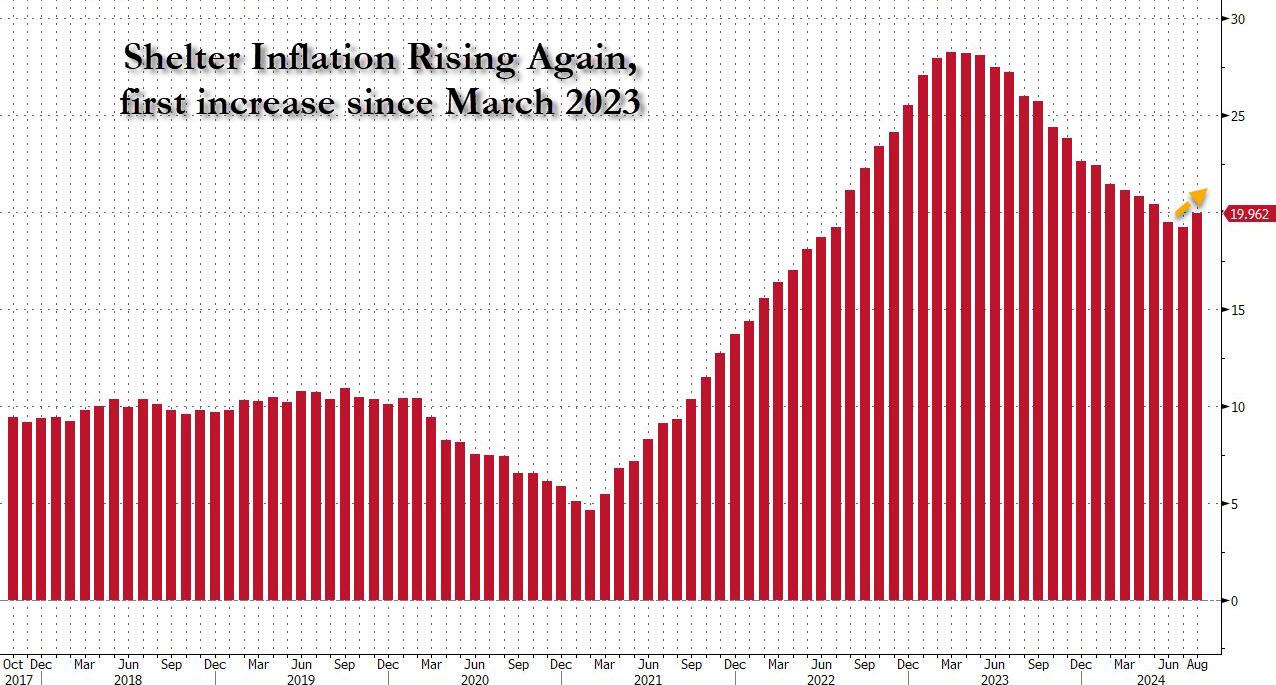
And the first monthly increase since March 2023 highlighted:
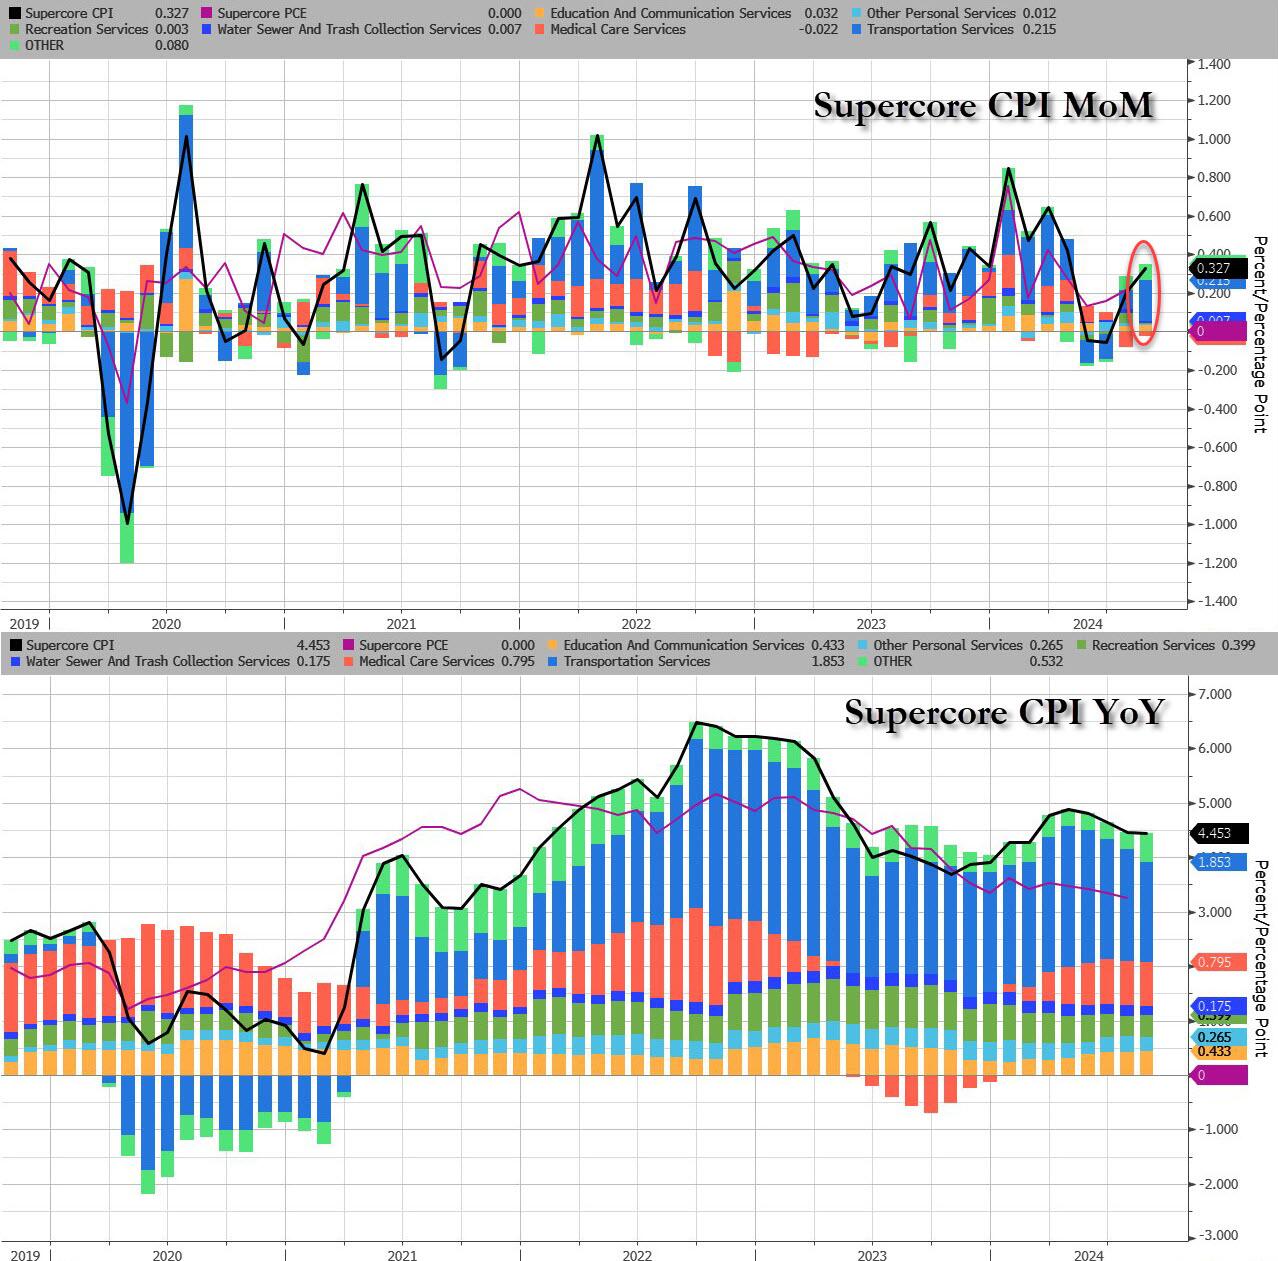
Last, but not least, and perhaps most ominous of all, is that while inflation refuses to be “killed” even as the Fed is about to start cutting rates, Supercore CPI rose 0.33% MoM, the biggest monthly increase since April, driven by continued acceleration in transportation services, which jumped the most in 5 months.
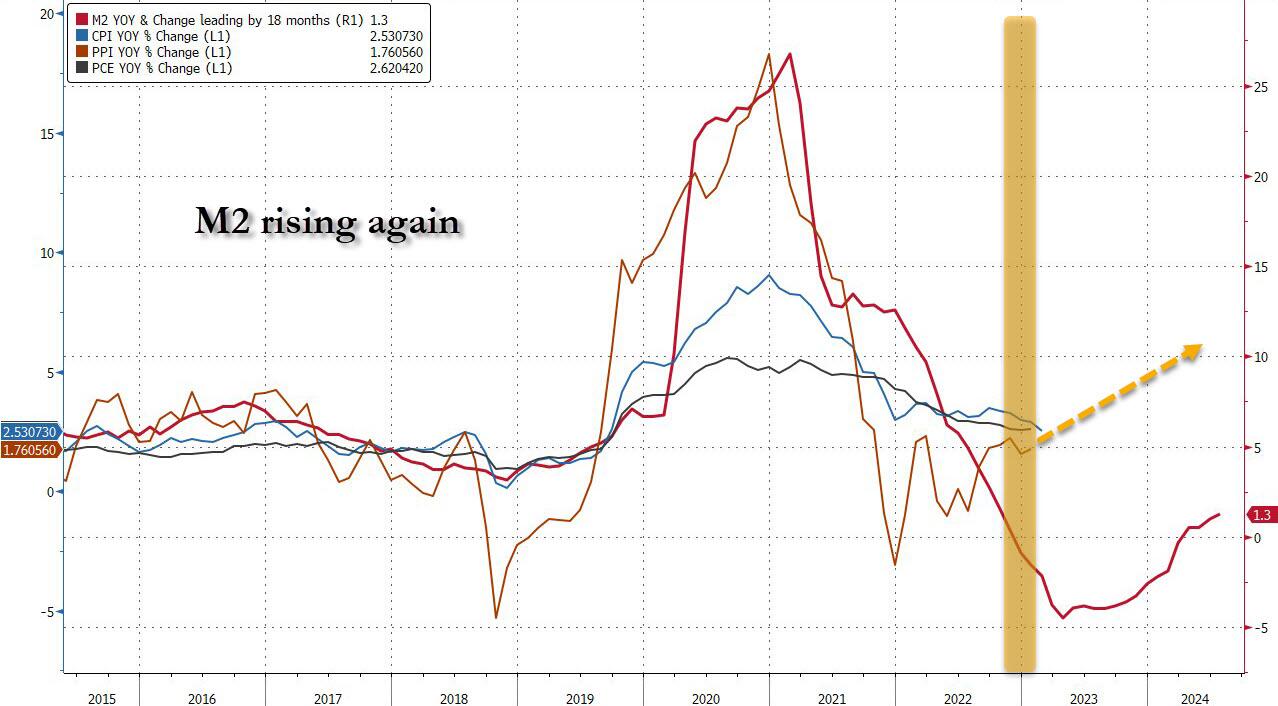
Finally, money supply growth is reaccelerating…
Which begs the question: how long until the Fed’s next easing cycle unleashes the Arthur Burns fed:
Putting it all together:
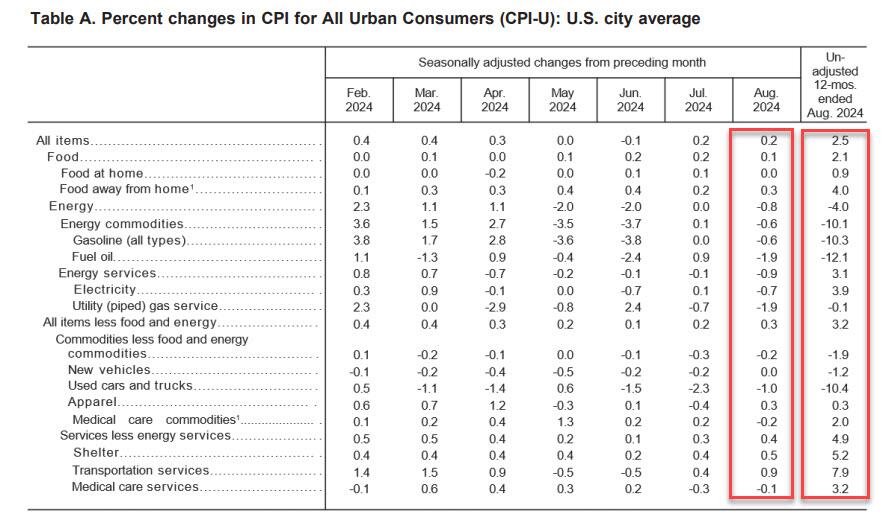
Underlying inflation unexpectedly picked up, as core CPI increased 0.3% from July, the most in four months, and 3.2% from a year ago
Only five of the 65 forecasts in Bloomberg’s survey called for a 0.3% increase in the core CPI. Almost everyone else was at 0.2%, and four had it at 0.1%. The five were right.
Shelter prices, the largest category within services, climbed 0.5%, the most since the start of the year and the second month of acceleration, defying widespread expectations for a downshift. Owners’ equivalent rent — a subset of shelter and the biggest individual component of the CPI — rose at a similar pace.
Airfares rose a hefty 3.9% in August after falling for the previous five months while costs for energy and used vehicles fell
Risk assets pumped and dumped and bond yields rose. S&P 500 futures dropped steeply immediately after the report came out, before paring losses. The yield on 10-year Treasuries advanced two basis points to 3.66%. The dollar wavered.
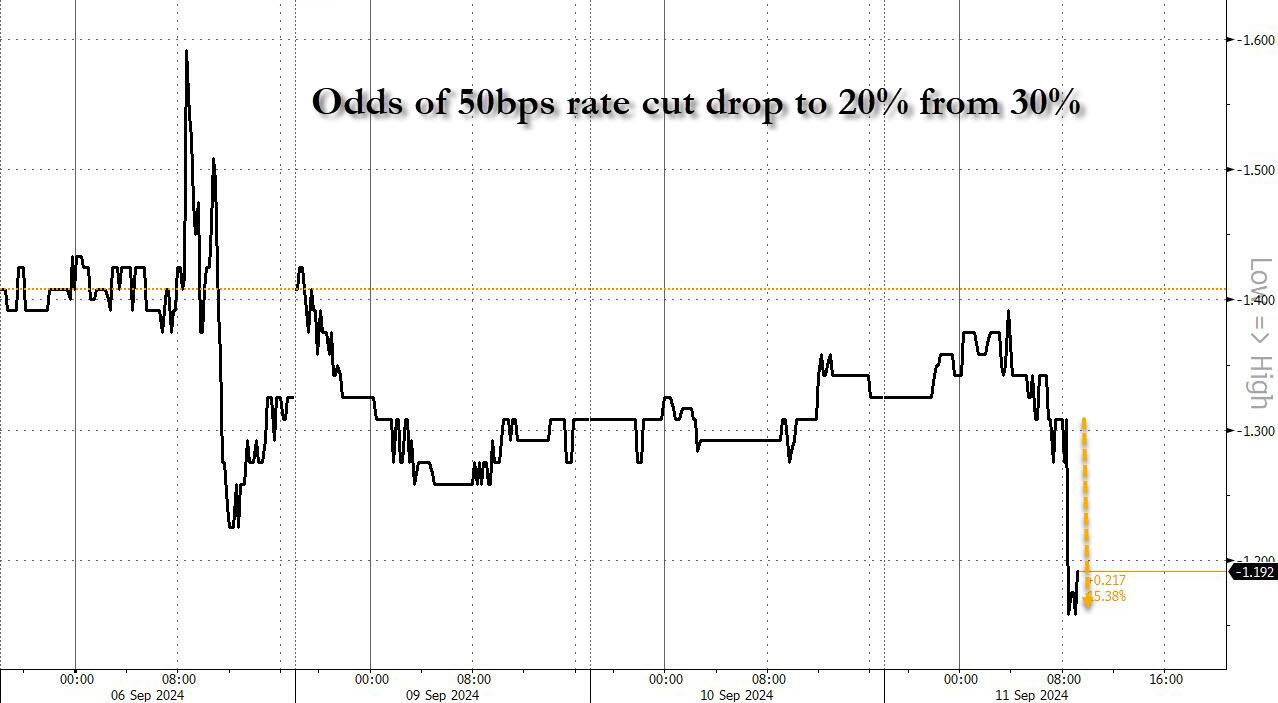
And while one can stick a fork in the market’s hopes for a 50bps rate cut (odds slumped from 30% to 20%… and from 50% last Friday)…
… the question remains: will the Fed really cut rates as shelter inflation inflects higher for the first time since 2023.
After last night’s ABC Presidential debate. Where Kamala acted like she was auditioning for part in the movie “Mean Girls” and the ABS moderators acted like pure Soviet-era Russian journalists.
Mortgage applications decreased 3.9 percent from one week earlier, according to data from the Mortgage Bankers Association’s (MBA) Weekly Applications Survey for the week ending July 26, 2024.
The Market Composite Index, a measure of mortgage loan application volume, decreased 3.9 percent on a seasonally adjusted basis from one week earlier. On an unadjusted basis, the Index decreased 4 percent compared with the previous week. The seasonally adjusted Purchase Index decreased 2 percent from one week earlier. The unadjusted Purchase Index decreased 1 percent compared with the previous week and was 14 percent lower than the same week one year ago.
Note the decline in mortgage purchase demand after Biden/Harris were sworn into office in Janaury 2021.
The Refinance Index decreased 7 percent from the previous week and was 32 percent higher than the same week one year ago. The average contract interest rate for 30-year fixed-rate mortgages with conforming loan balances ($766,550 or less) remained unchanged at 6.82 percent, with points increasing to 0.62 from 0.59 (including the origination fee) for 80 percent loan-to-value ratio (LTV) loans.
Because of rising rates under Biden/Harris economic policies, mortgage refinancing demand has gotten crushed.
We are in the latter half of the year, so seasonalility will kill off purchase mortgage demand compared to the Spring and early Summer.
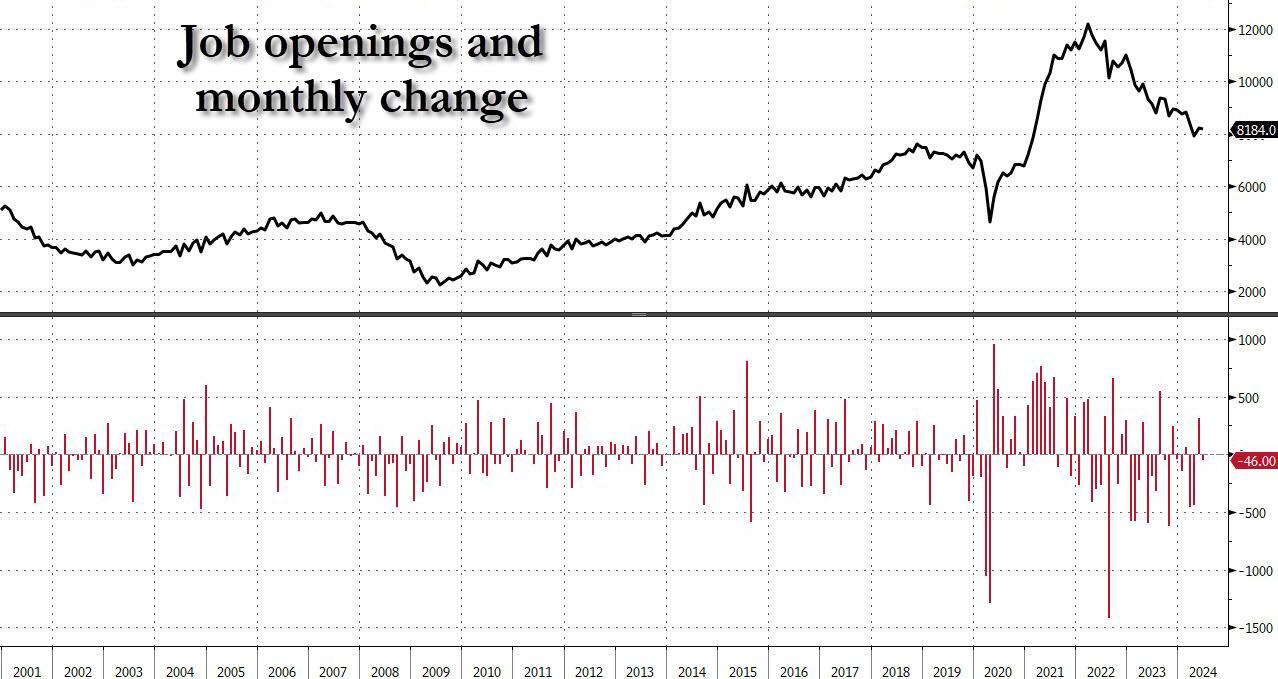
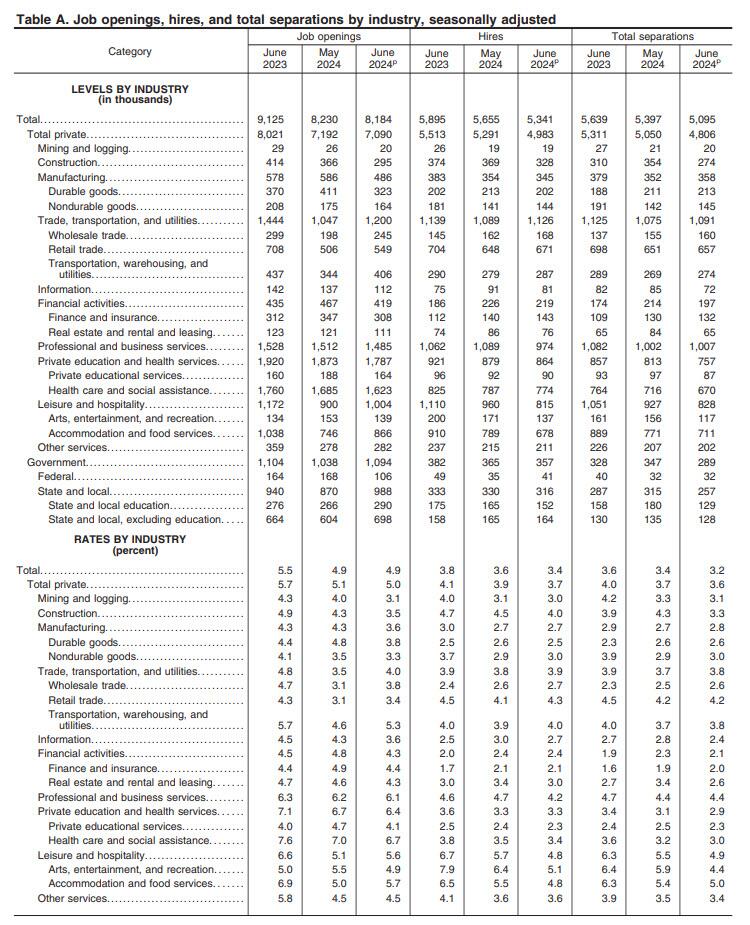
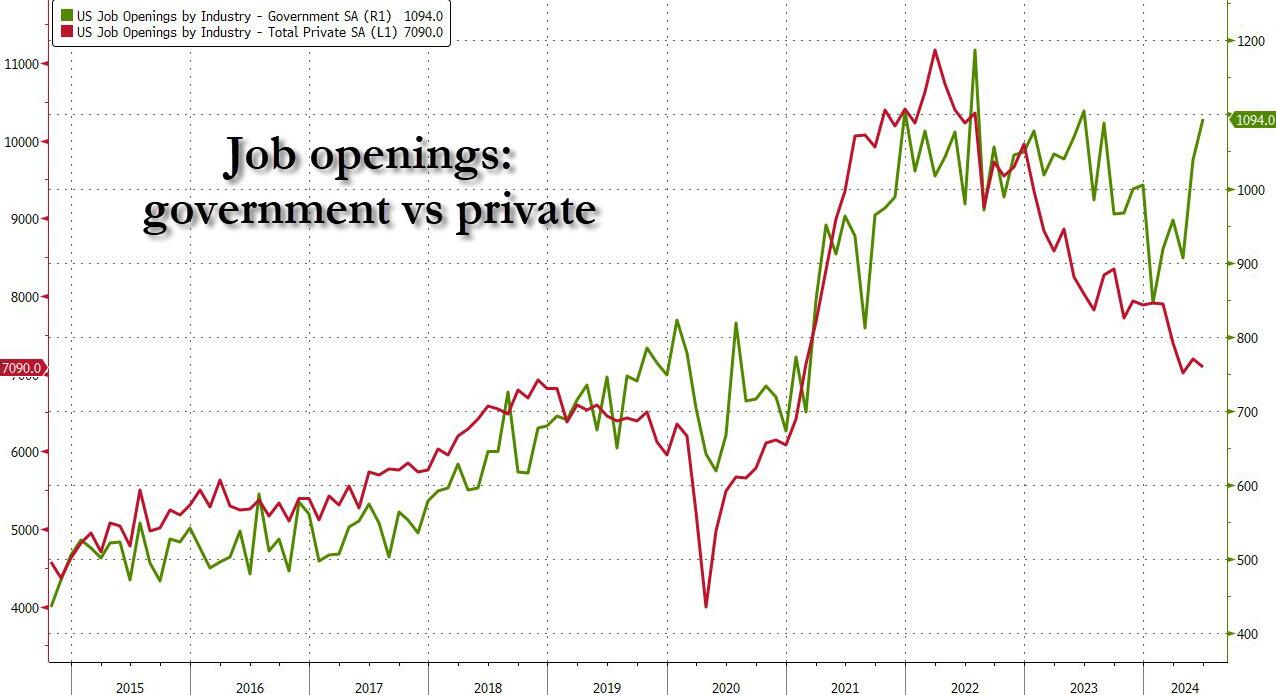
And yet, the same data rigging observed last month took place once again, because a quick look at the breakdown shows that while private jobs saw another broad drop in openings across private sectors…
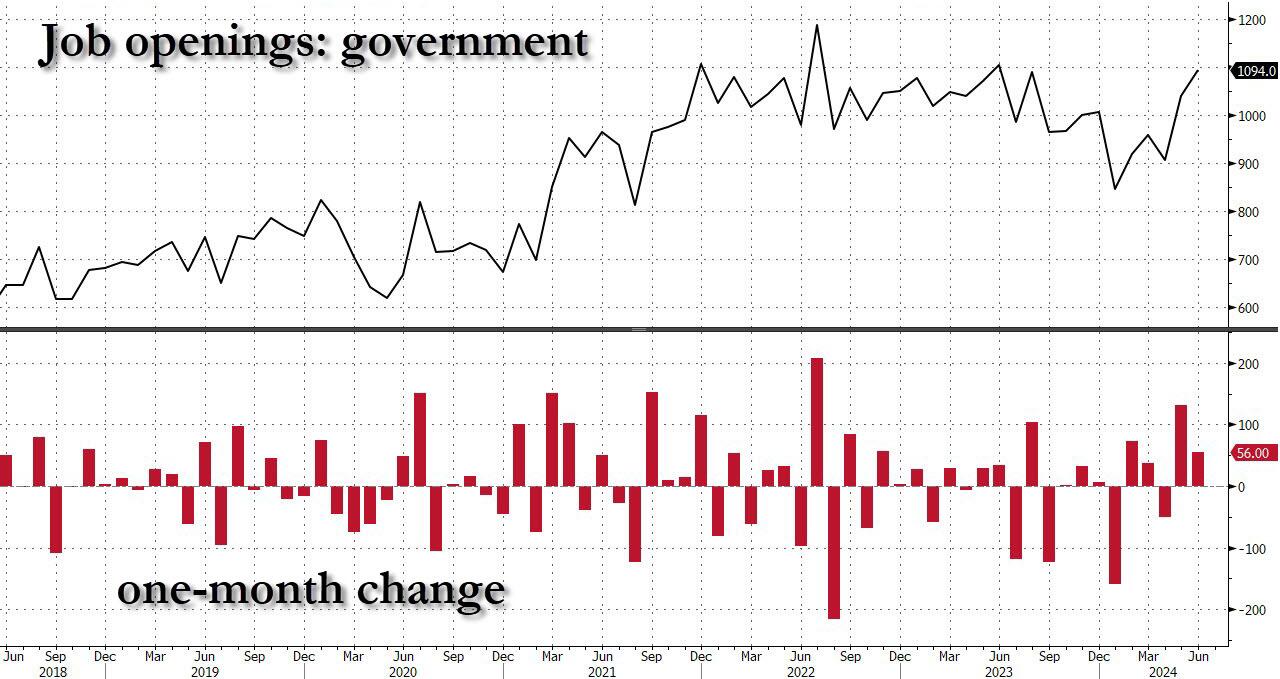
… this was almost fully offset by the relentless surge in government job openings.
Yes, while May was indeed revised lower, June saw another bizarre jump in government job openings, surging to a near record 1.094 million, driven by a 118K spike in State and Local job openings.
Putting it all together, while private sector job openings plunged to a level seen back in late 2018, government job openings are just shy of a record high!
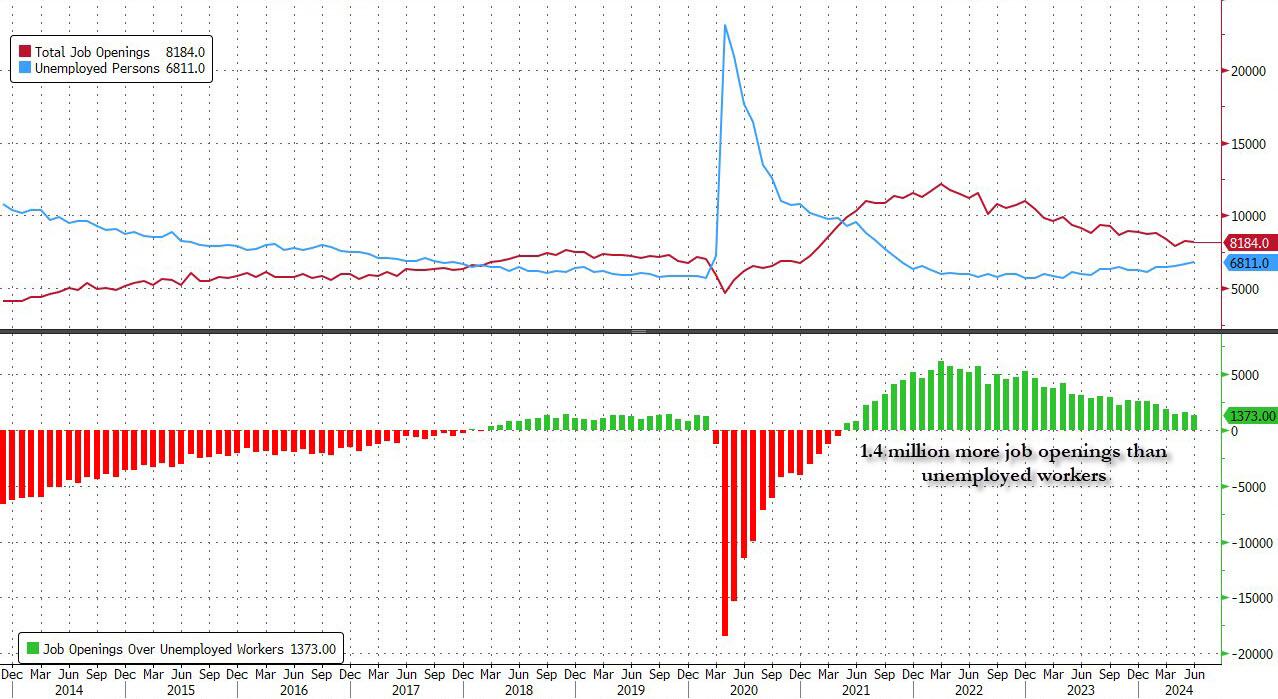
Ignoring the data manipulation, in the context of the broader jobs report, in June the number of job openings was 1.373 million more than the number of unemployed workers (which the BLS reported was 6.811 million), down from last month’s 1.581 million and the lowest since the summer of 2021.
Said otherwise, in April the number of job openings to unemployed dropped to just 1.24, a sharp slide from the March print of 1.30, the lowest level since June 2021 and now officially back to pre-covid levels.
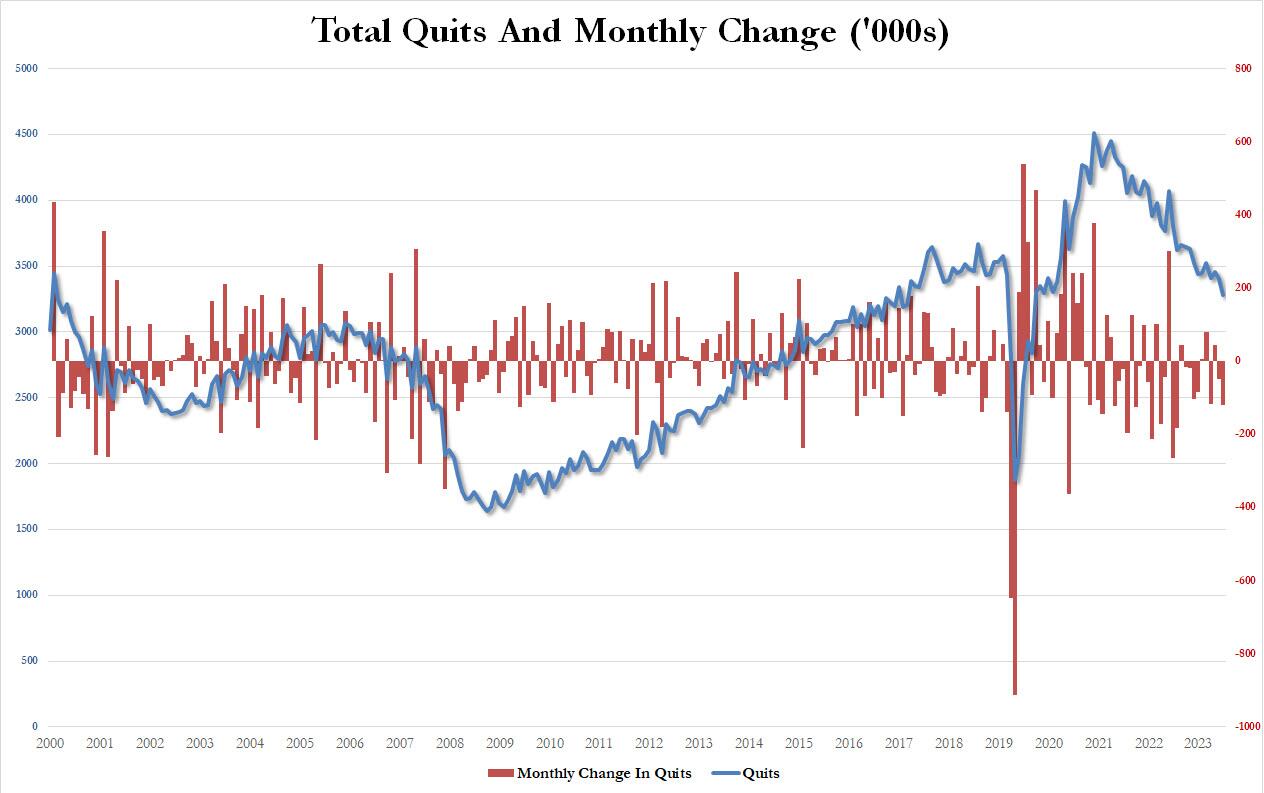
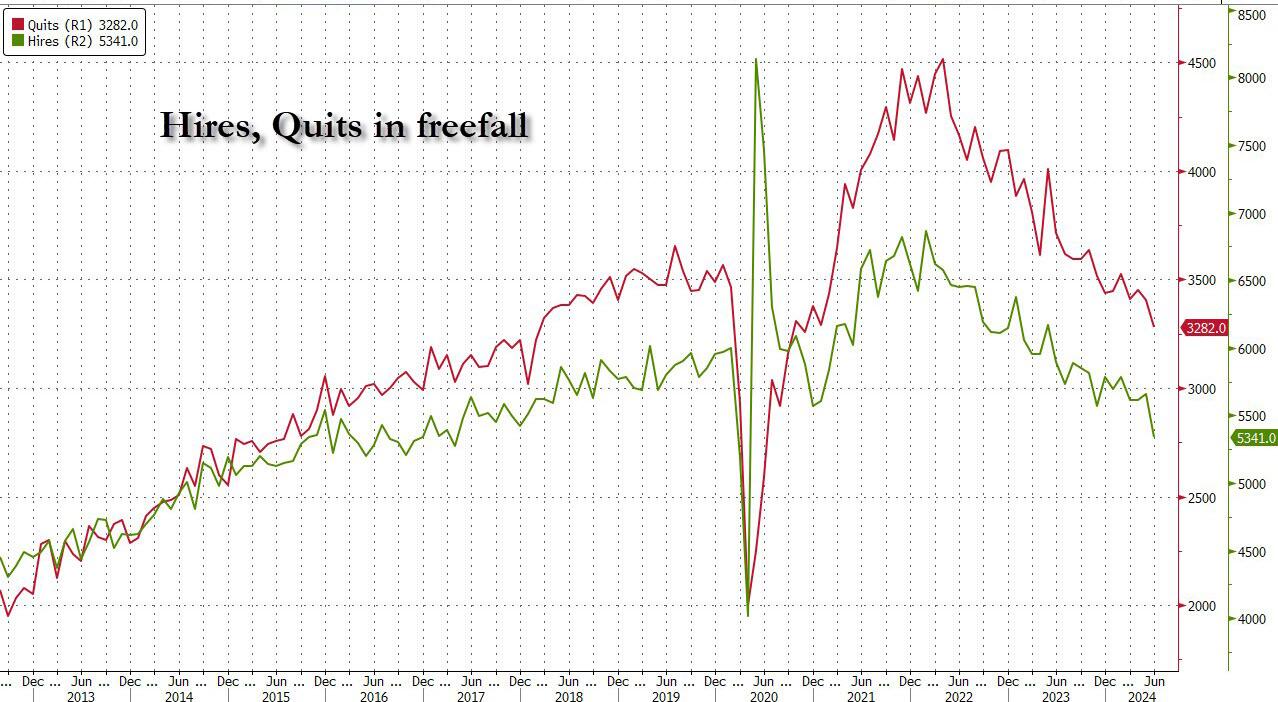
But wait there’s more: confirming that if one ignores the clearly manipulated jump in government job openings (“quick, let’s hire a ton more TSA agents and deep state apparatchiks to make it seems that Kamalanomics is working”), a quick look at the number of quits – an indicator closely associated with labor market strength as it shows workers are confident they can find a better wage elsewhere – showed a plunge in June, dropping by 121K, the most since July 2023, to just 3.282 million, the lowest since August 2020!
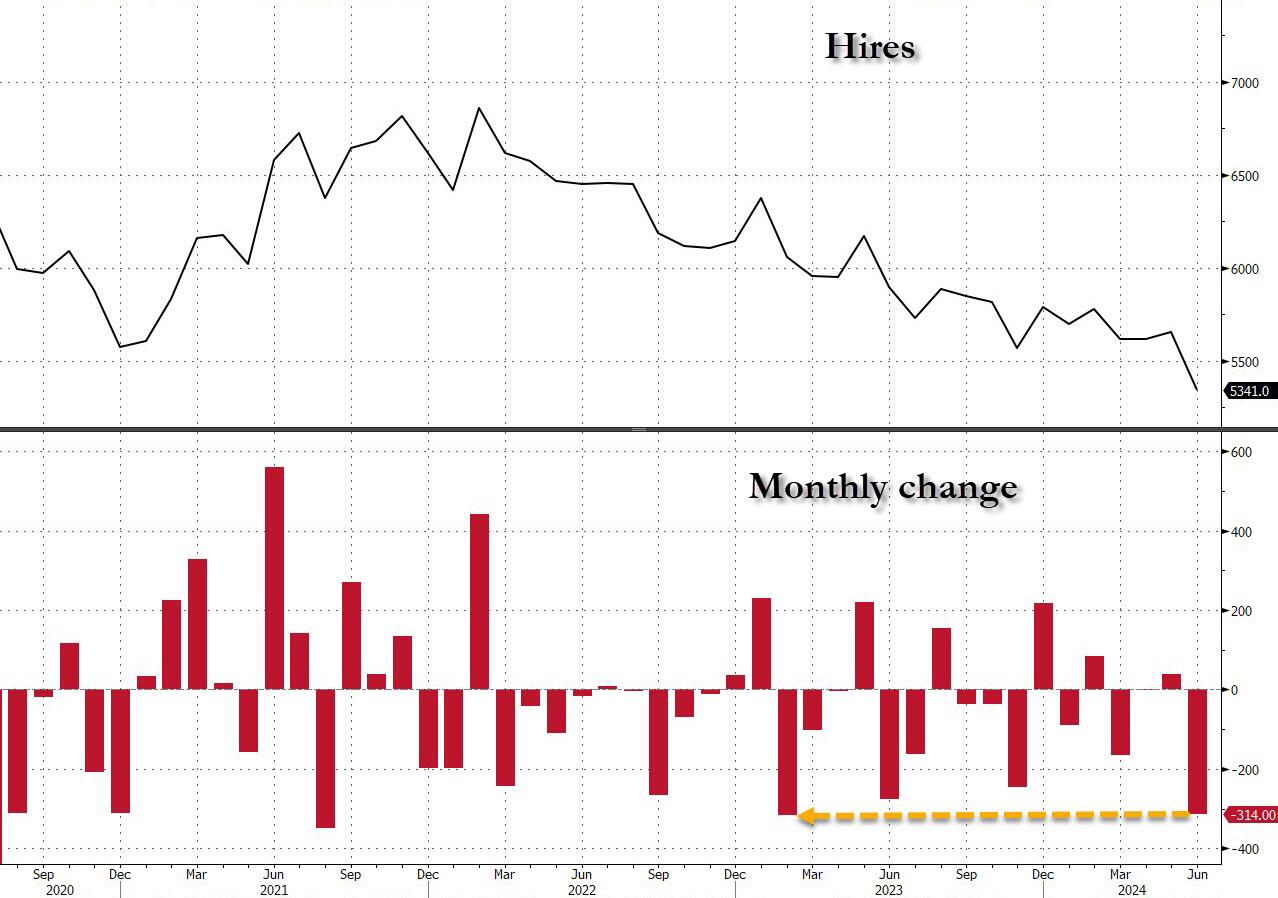
Finally, the piece de resistance was the number of actual hires, which in June also tumbled to just 5341, down a massive 314K in one month, the biggest monthly drop since February 2023…
… dragging the total to just 5.3 million, the lowest level since the depts of the covid lockdowns.
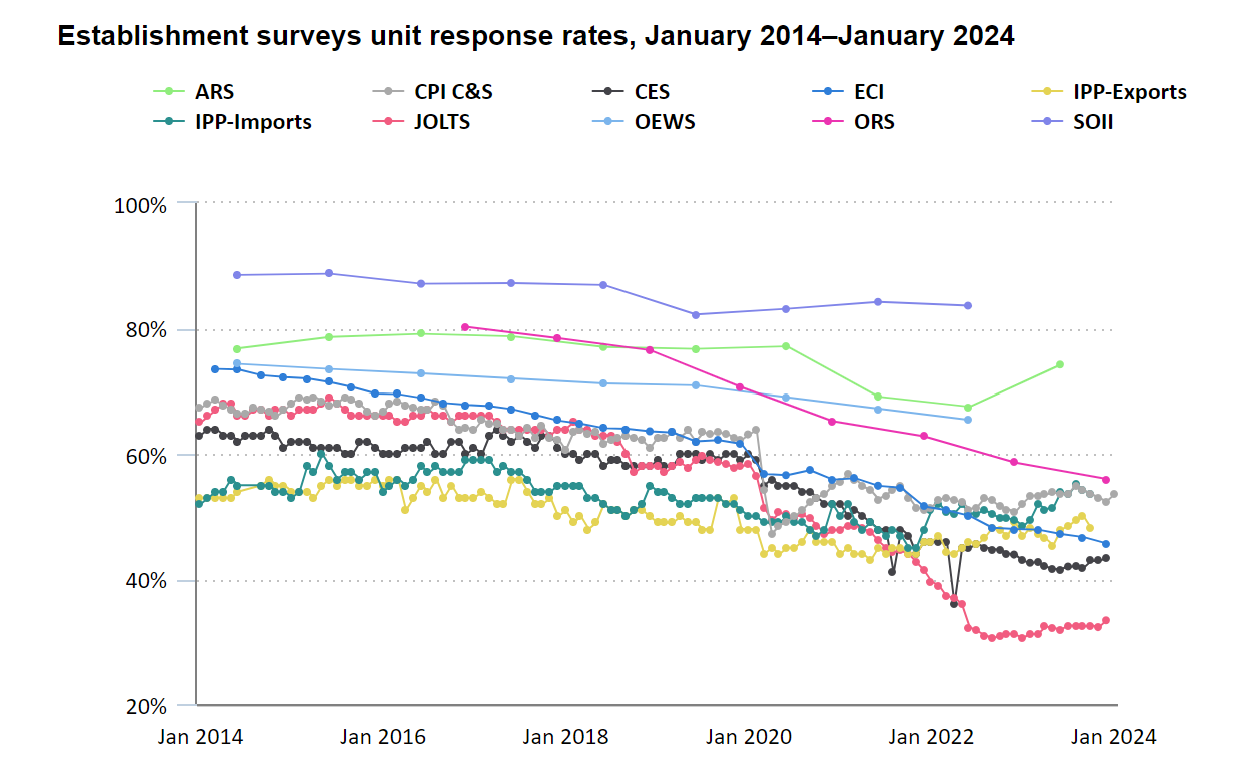
Finally, no matter what the “data” shows, let’s not forget that it is all just estimated, and it is safe to say that the real number of job openings remains still far lower since half of it – or some 70% to be specific – is guesswork. As the BLS itself admits, while the response rate to most of its various labor (and other) surveys has collapsed in recent years, nothing is as bad as the JOLTS report where the actual response rate remains near a record low 33%
In other words, more than two thirds, or 70% of the final number of job openings, is estimated!
And at a time when it is critical for Biden, pardon Kamala, to still maintain the illusion that at least the labor market remains strong when everything else in the economy is crashing and burning, we’ll let readers decide if the near record number of government job openings at a time when hiring and quitting are both crashing, is an accurate reflection of a strong labor market, or is merely a reflection of a debt-funded deep state gone full tilt. We’ll know the answer on Friday.
This scene from the film “McCabe and Mrs. Miller” sums up our political plight quite nicley. Politicians spend like crazy to stay in power (Biden/Harris) are excellent examples). Politicians promises endless money, then shoot the economy. The US is broke and relies on printing money and boowed funds to stay afloat. Harris wants to raise taxes on everyone to fund her plans like even MORE emphasis of failed green energy schemes and endless foreign wars. I doubt if Harris could defend her spending plans in light of the US already $35 TRILLION in debt.
Even more worrisome if thev fact that DC politicians have promised entitlements (Social Security, Medicare, etc. totalling $217.63 Trillion. Or 623% higher than the rapidly increasing national debt.
Biden/Harris raised thr national debt by 25% in less than 4 years. And Harris wants to increase spending! Harris wants illegal immigrants put on Social Security and Medicare, further bankrupting those entitlement programs.
Let’s see Harris explain her indefensible budget (like raising taxes and not hurting economic growth).


You must be logged in to post a comment.