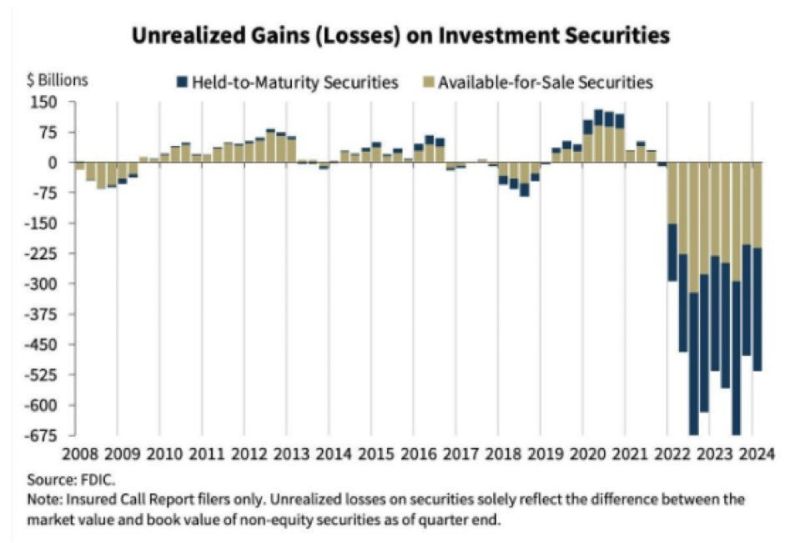
The delinquency rate on commercial mortgage-backed securities (CMBS) for offices spiked to 8.1% in July, the highest in 11 years.
The delinquency rate of office CMBS loans has QUADRUPLED in 1.5 years.
Delinquencies are currently rising at a faster pace than during the 2008 Financial Crisis. A top AAA-rated CMBS experienced a $40 million loss in May for the first time since the 2008 Financial Crisis.
While not an office, Edward Hopper painted some great real estate properties!
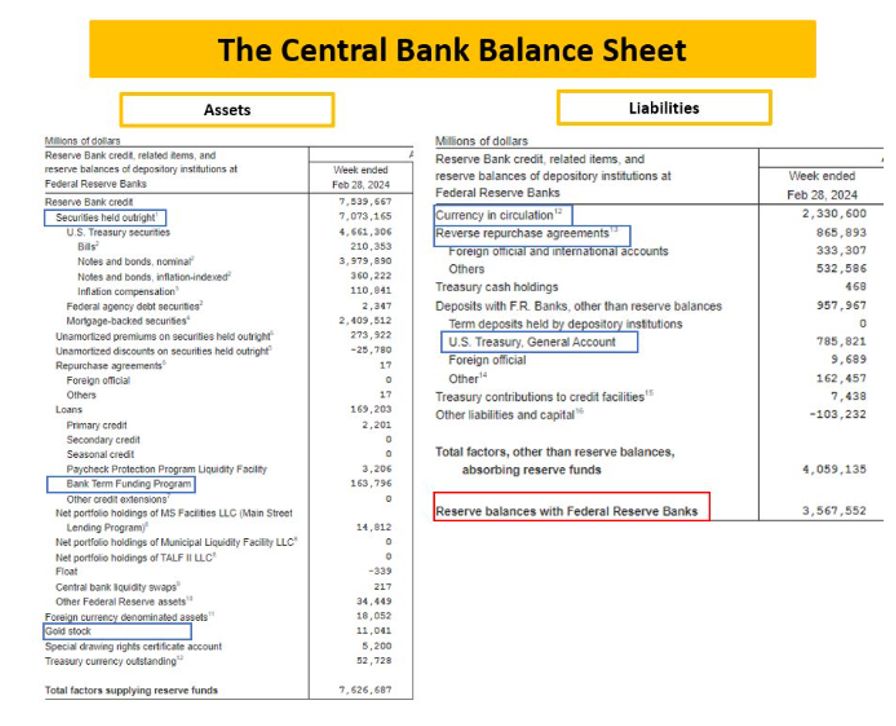
Kamala Harris, despite being VP for almost 4 years, is going to annouce her plans for taming inflation. Why doesn’t she do it now?? What Harris can’t control is The Federal Reserve that is losing money at breakneck speed.
Here is The Fed’s balance sheet.
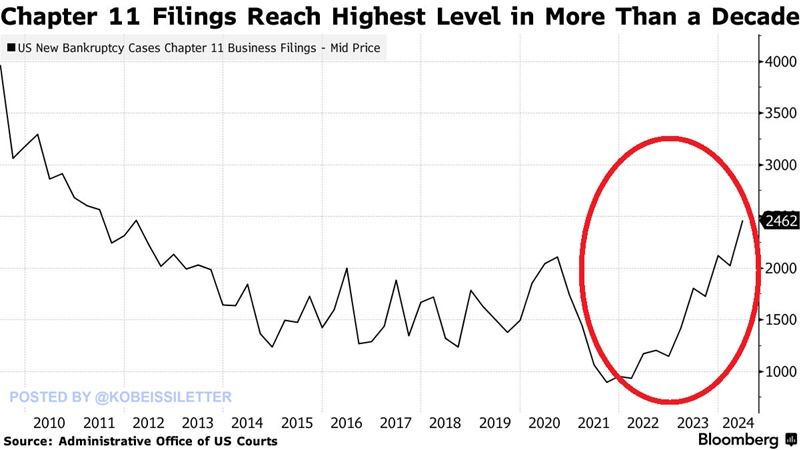
I shudder to think what Harris will propose to solve the highest bankrupty (Chap 11) rate in 13 years. Probably more Bidenomics (big wealth transfers to large corporations/donors).
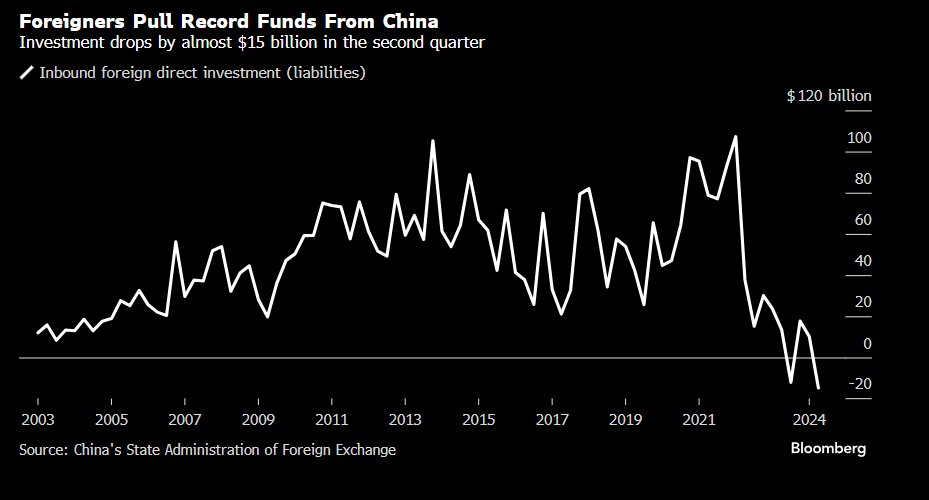
Meanwhile, foreigns pulled a record amount of funds from ailing China.
Kamala Harris will say anything to get elected, then fall back on her Communist agenda.
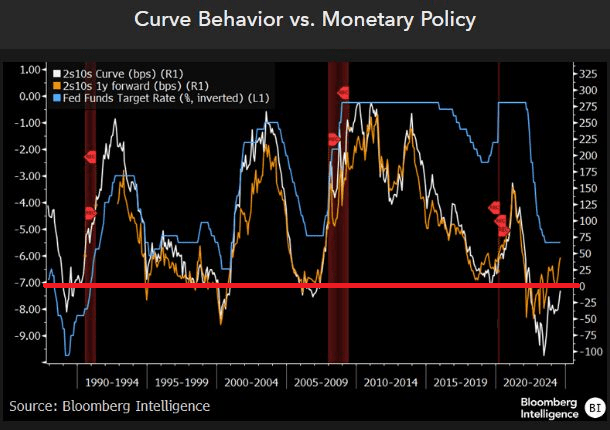
We know several things about the yield curve. First, it goes negative before recessions. Second, it is related to the inverse of The Fed’s target rate (blue line).
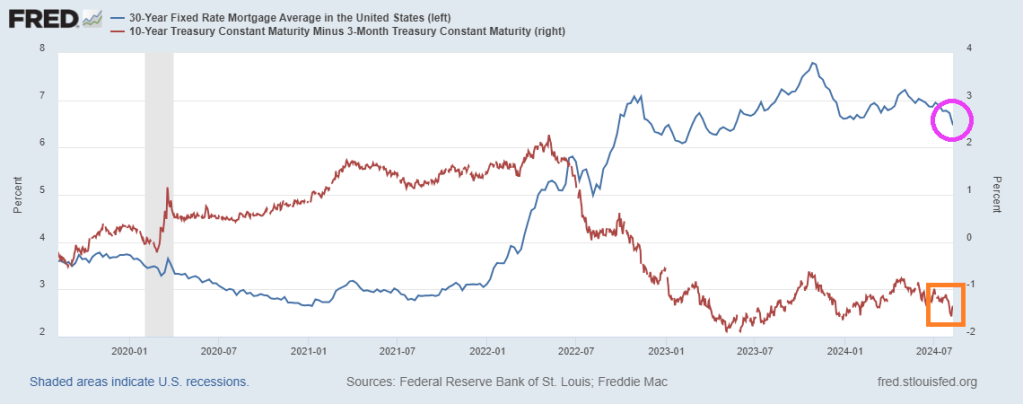
How about the US mortgage rate? Generally, US Mortgage rates are inverse to the 10Y-3M yield curve, but lately the US mortgage rate (pink circle) have declined with the 10Y-3M yield curve.
The yield curve does forecast recessions, but is unreliable in forecasting mortgage rate movements.
The slowing US economy has a silver lining: Treasury and mortgage rates are declining. And the is spurring faster mortgage prepayments.
Mortgage applications increased 6.9 percent from one week earlier, according to data from the Mortgage Bankers Association’s (MBA) Weekly Applications Survey for the week ending August 2, 2024.
The Market Composite Index, a measure of mortgage loan application volume, increased 6.9 percent on a seasonally adjusted basis from one week earlier. On an unadjusted basis, the Index increased 6 percent compared with the previous week. The seasonally adjusted Purchase Index increased 1 percent from one week earlier. The unadjusted Purchase Index increased 0.3 percent compared with the previous week and was 11 percent lower than the same week one year ago.
The Refinance Index increased 16 percent from the previous week and was 59 percent higher than the same week one year ago.
The average contract interest rate for 30-year fixed-rate mortgages with conforming loan balances ($766,550 or less) decreased to 6.55 percent from 6.82 percent, with points decreasing to 0.58 from 0.62 (including the origination fee) for 80 percent loan-to-value ratio (LTV) loans.
The deciine in rates led to an increase in MBS convexity.
Here is Biden/Harrisnomics in one chart! Treasury (interest) payments are growing faster than other government outlays and a larger than the entire Defense outlays. Leading outlays include Medicare/Medicaid and Social Security.
Here is Treasury Secretary Janet Yellen symbolically gorging on a foot-long sub. No one spends like unelected government bureaucrats!
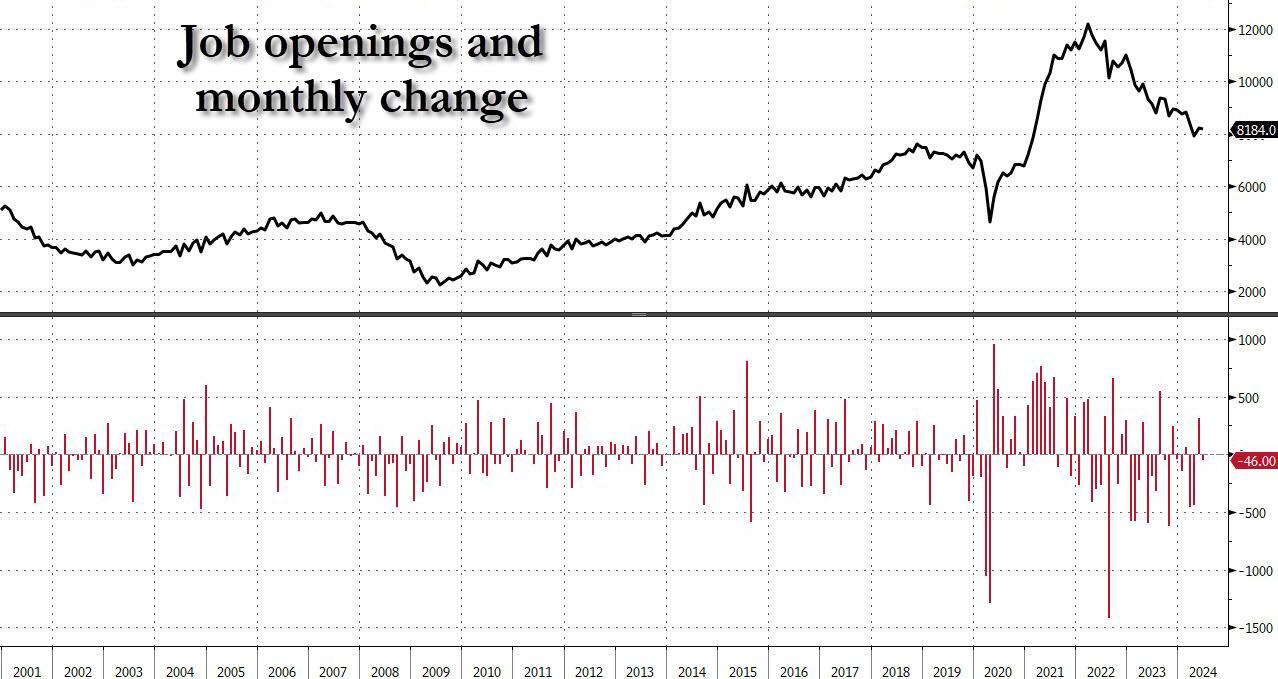
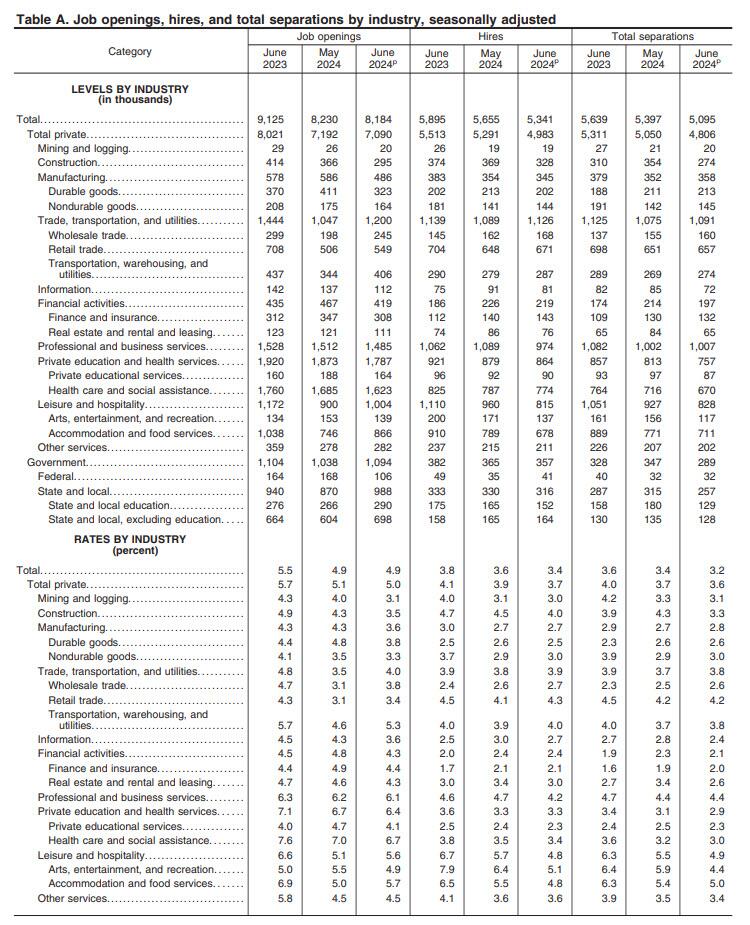
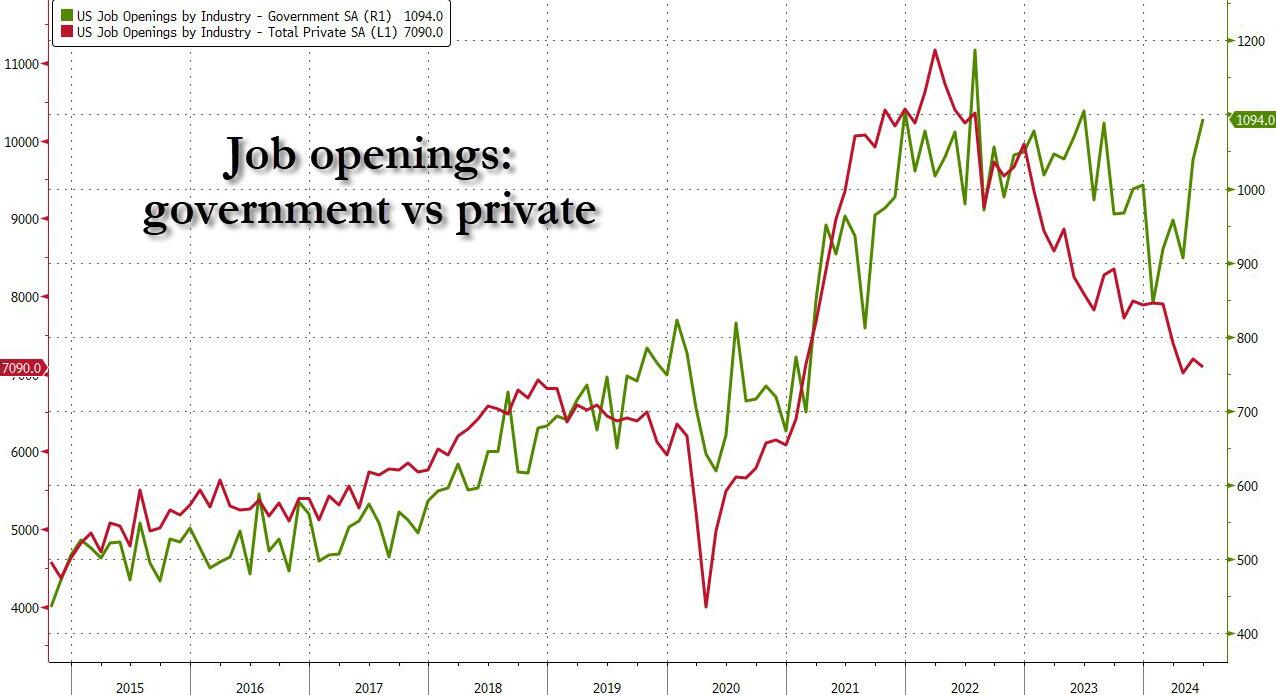
And yet, the same data rigging observed last month took place once again, because a quick look at the breakdown shows that while private jobs saw another broad drop in openings across private sectors…
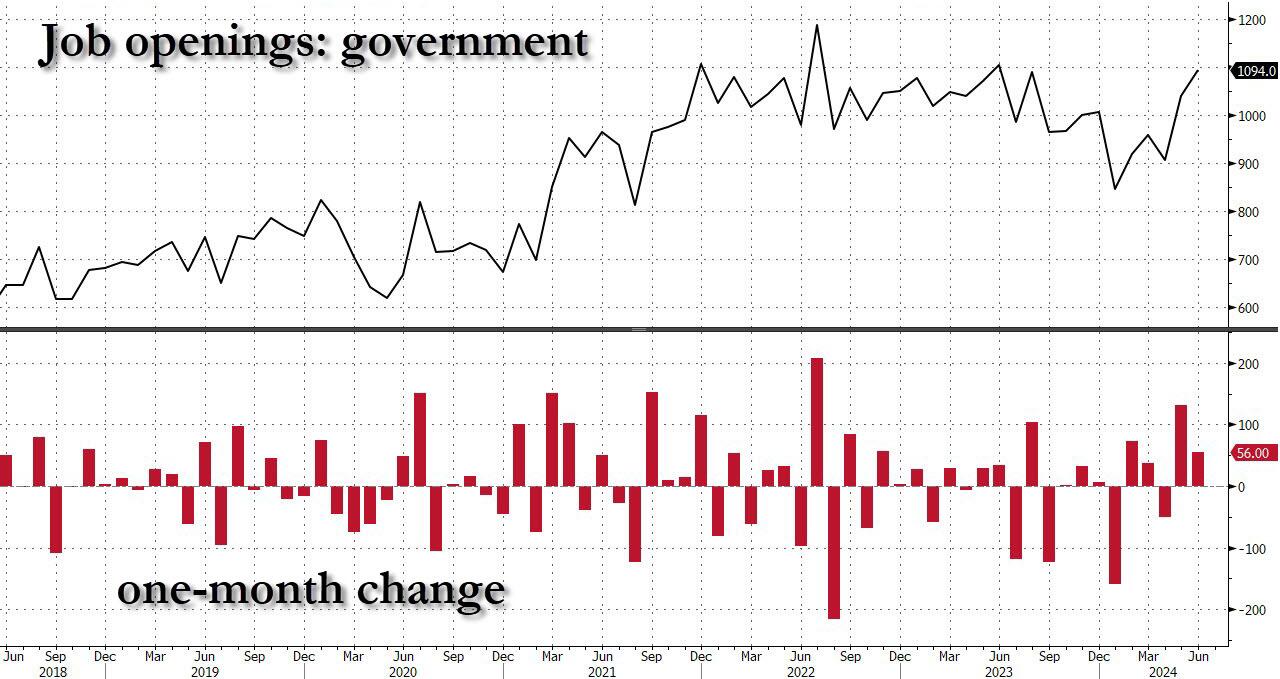
… this was almost fully offset by the relentless surge in government job openings.
Yes, while May was indeed revised lower, June saw another bizarre jump in government job openings, surging to a near record 1.094 million, driven by a 118K spike in State and Local job openings.
Putting it all together, while private sector job openings plunged to a level seen back in late 2018, government job openings are just shy of a record high!
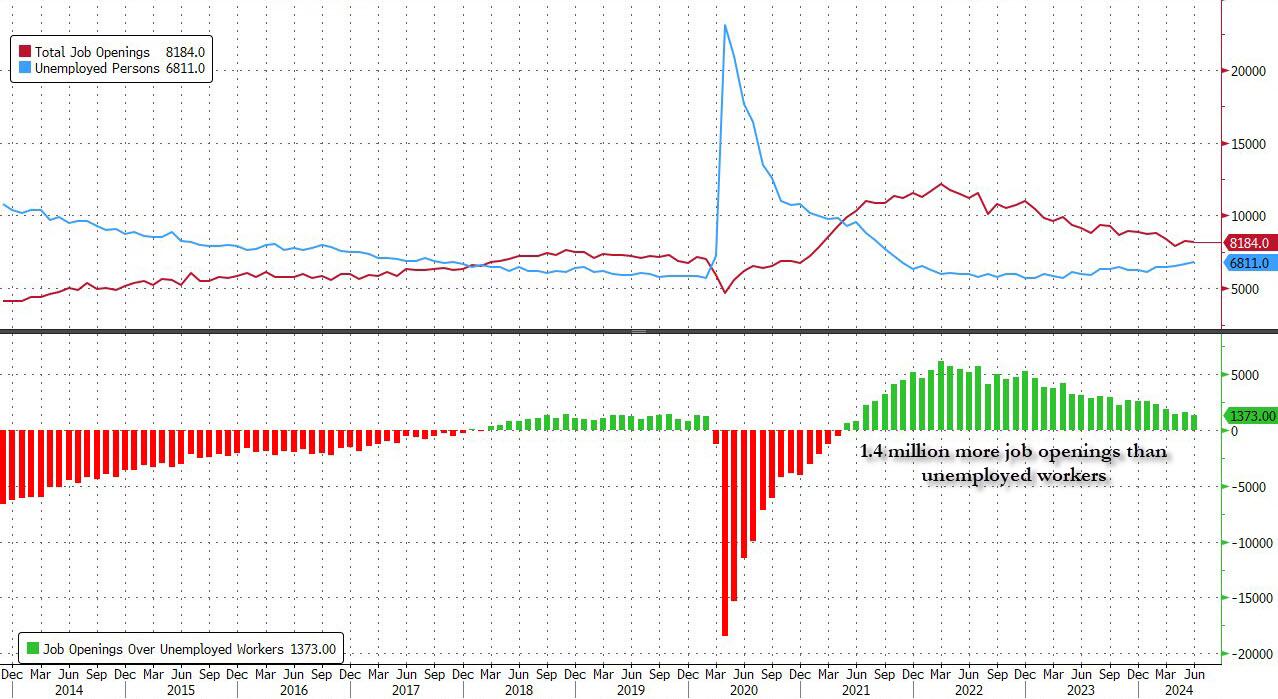
Ignoring the data manipulation, in the context of the broader jobs report, in June the number of job openings was 1.373 million more than the number of unemployed workers (which the BLS reported was 6.811 million), down from last month’s 1.581 million and the lowest since the summer of 2021.
Said otherwise, in April the number of job openings to unemployed dropped to just 1.24, a sharp slide from the March print of 1.30, the lowest level since June 2021 and now officially back to pre-covid levels.
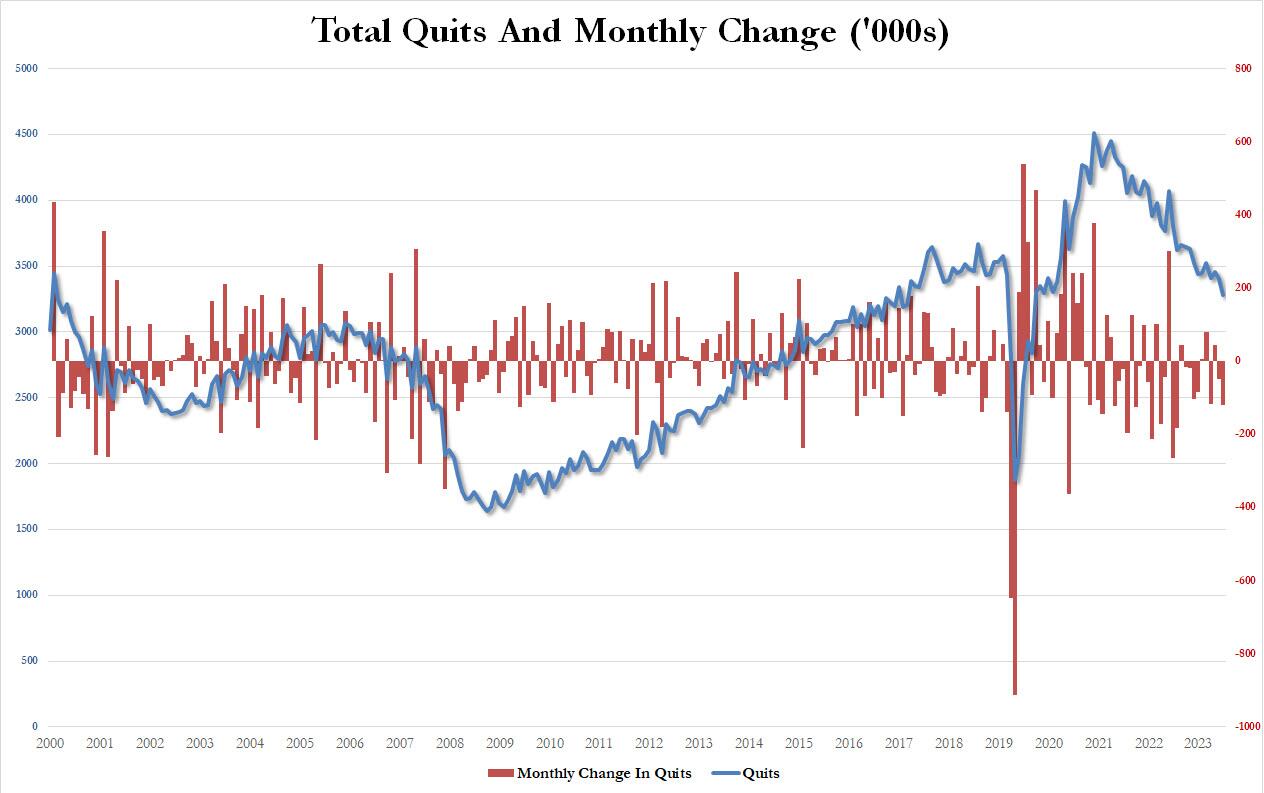
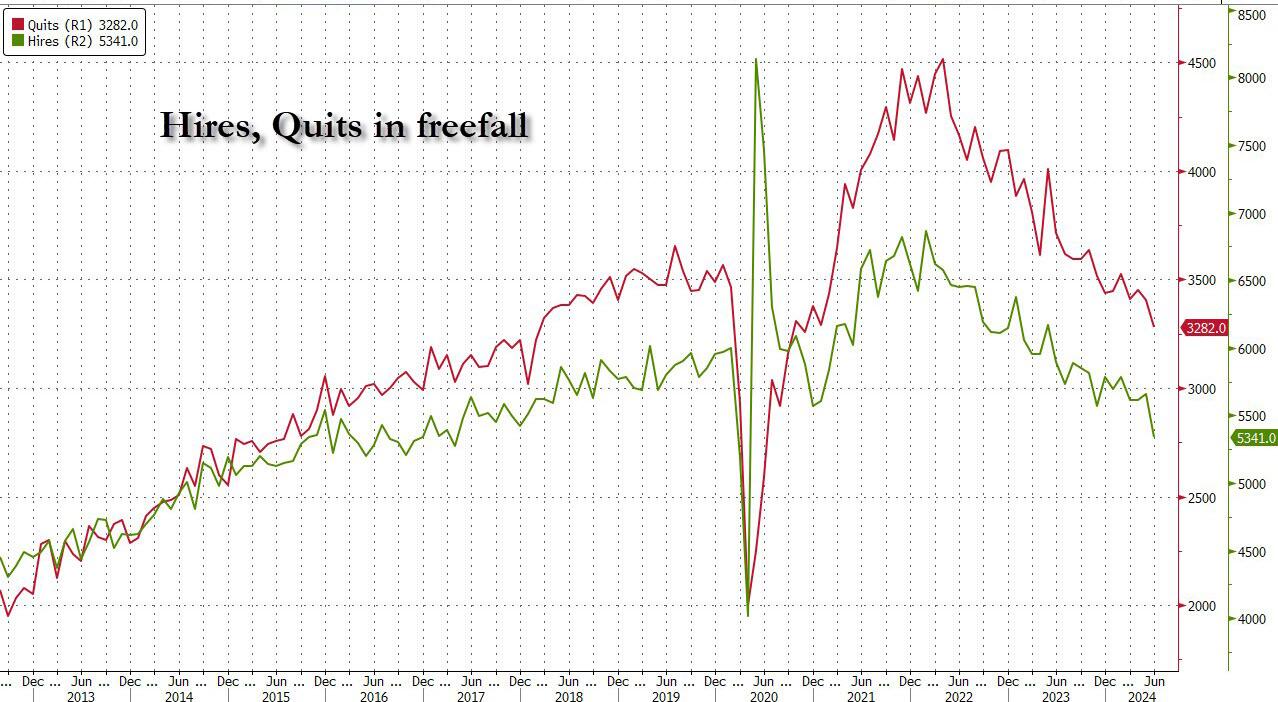
But wait there’s more: confirming that if one ignores the clearly manipulated jump in government job openings (“quick, let’s hire a ton more TSA agents and deep state apparatchiks to make it seems that Kamalanomics is working”), a quick look at the number of quits – an indicator closely associated with labor market strength as it shows workers are confident they can find a better wage elsewhere – showed a plunge in June, dropping by 121K, the most since July 2023, to just 3.282 million, the lowest since August 2020!
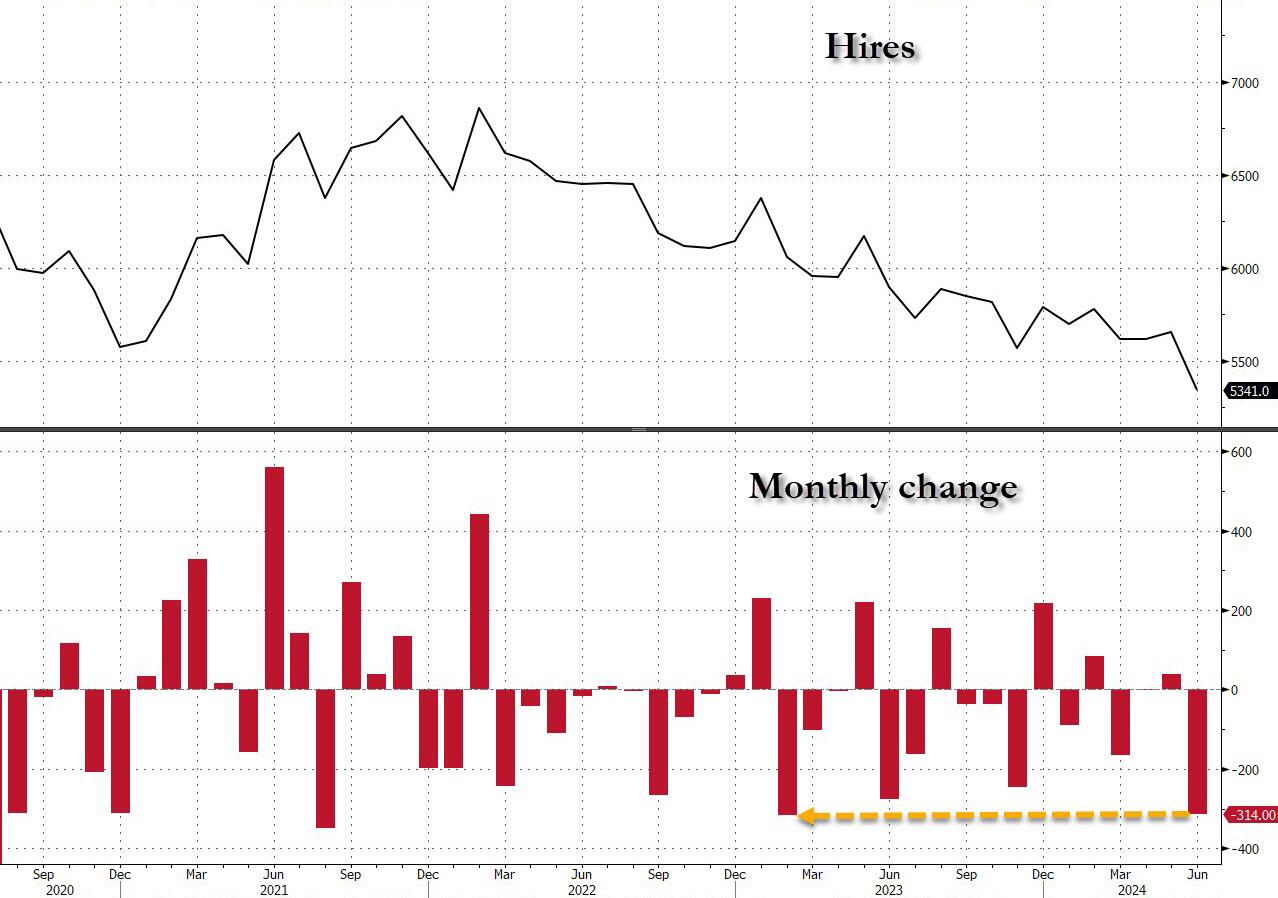
Finally, the piece de resistance was the number of actual hires, which in June also tumbled to just 5341, down a massive 314K in one month, the biggest monthly drop since February 2023…
… dragging the total to just 5.3 million, the lowest level since the depts of the covid lockdowns.
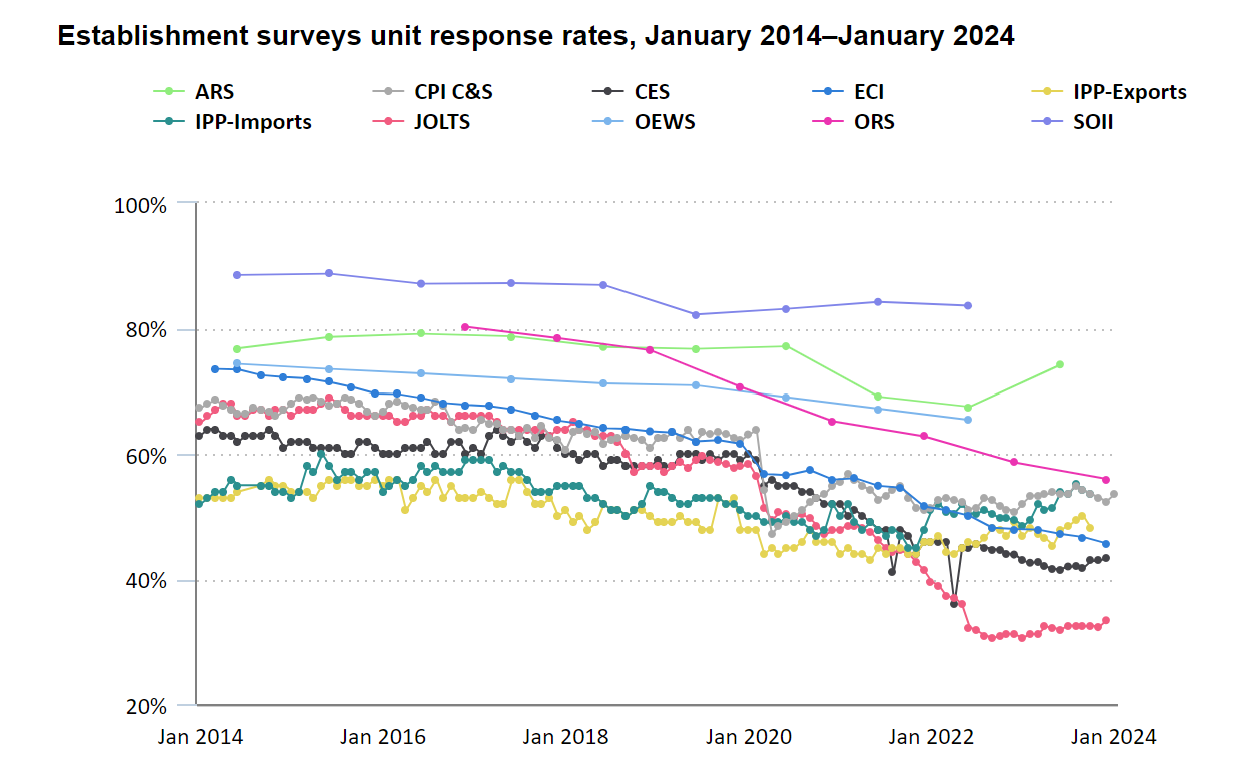
Finally, no matter what the “data” shows, let’s not forget that it is all just estimated, and it is safe to say that the real number of job openings remains still far lower since half of it – or some 70% to be specific – is guesswork. As the BLS itself admits, while the response rate to most of its various labor (and other) surveys has collapsed in recent years, nothing is as bad as the JOLTS report where the actual response rate remains near a record low 33%
In other words, more than two thirds, or 70% of the final number of job openings, is estimated!
And at a time when it is critical for Biden, pardon Kamala, to still maintain the illusion that at least the labor market remains strong when everything else in the economy is crashing and burning, we’ll let readers decide if the near record number of government job openings at a time when hiring and quitting are both crashing, is an accurate reflection of a strong labor market, or is merely a reflection of a debt-funded deep state gone full tilt. We’ll know the answer on Friday.


You must be logged in to post a comment.