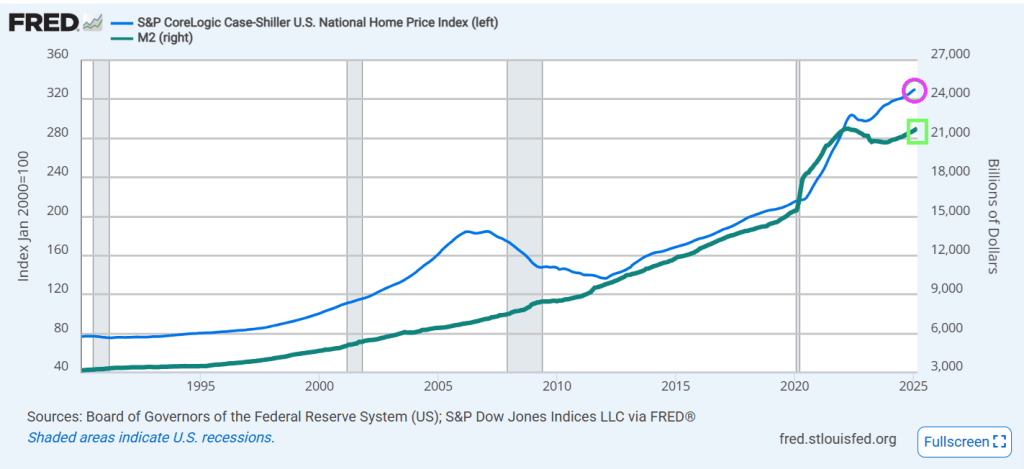
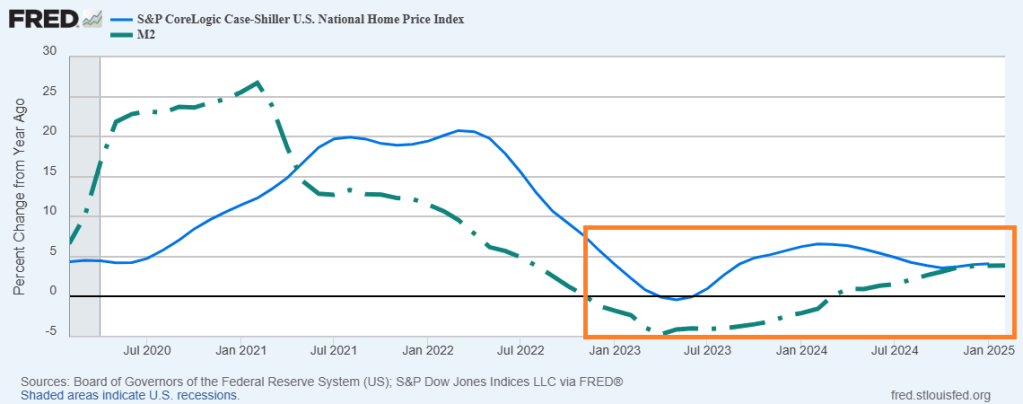
US home prices hit a new record high in February, according to the latest data from S&P CoreLogic Case-Shiller, rising 0.4% MoM (as expected). However, the pace of price rises did slow modestly (after accelerating for the past three months) to +4.50% YoY. And home prices track Fed money printing.
The S&P CoreLogic Case-Shiller U.S. National Home Price NSA Index, covering all nine U.S. census divisions, reported a 3.9% annual return for February, down from a 4.1% annual gain in the previous month. The 10-City Composite saw an annual increase of 5.2%, down from a 5.4% annual increase in the previous month. The 20-City Composite posted a year-over-year increase of 4.5%, down from a 4.7% increase in the previous month. New York again reported the highest annual gain among the 20 cities with a 7.7% increase in February, followed by Chicago and Cleveland with annual increases of 7.0% and 6.6%, respectively. Tampa posted the lowest return, falling 1.5%.
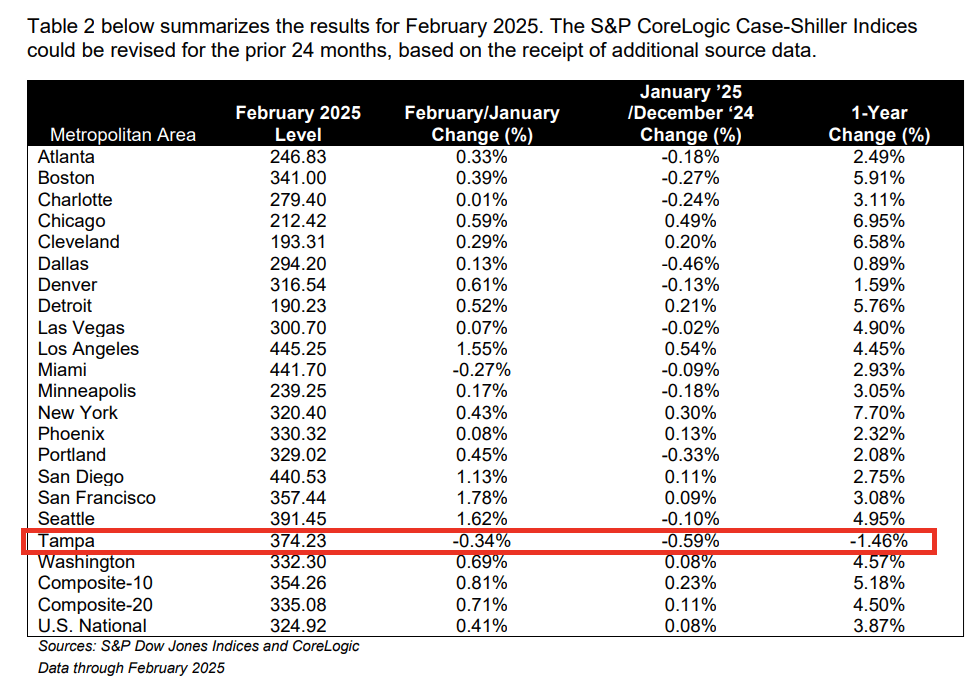
The pre-seasonally adjusted U.S. National, 10-City Composite, and 20-City Composite Indices presented slight upward trends in February, posting 0.4%, 0.8%, and 0.7% respectively.
After seasonal adjustment, the 10-City and 20-City Composite Indices posted month-over-month increases of 0.5% and 0.4%. The U.S. National Composite Index posted a month-over-month increase of 0.3%.
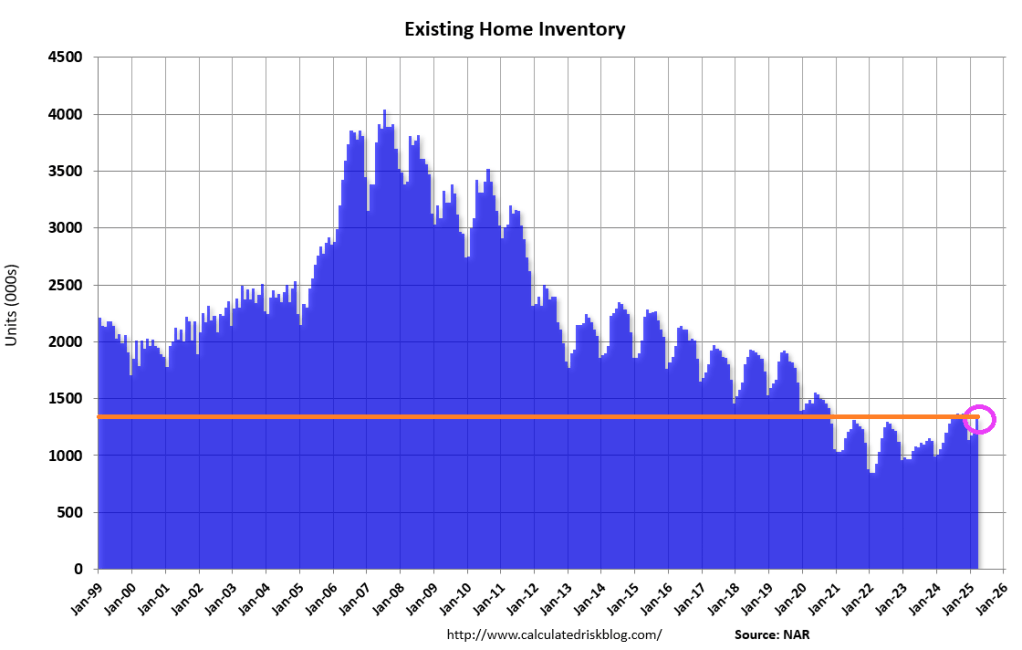
“Even with mortgage rates remaining in the mid-6% range and affordability challenges lingering, home prices have shown notable resilience,” said Nicholas Godec, CFA, CAIA, CIPM, Head of Fixed Income Tradables & Commodities at S&P Dow Jones Indices. “Buyer demand has certainly cooled compared to the frenzied pace of prior years, but limited housing supply continues to underpin prices in most markets. Rather than broad declines, we are seeing a slower, more sustainable pace of price growth.”


You must be logged in to post a comment.