It seems everything Biden touches turns to stone. This used to be called “The Medusa Touch” but I changing that to “The Biden Touch.” And that includes housing. Or we can simply sing along with the late Jimmy Buffet and “Wasting aways again in Bidenville.”
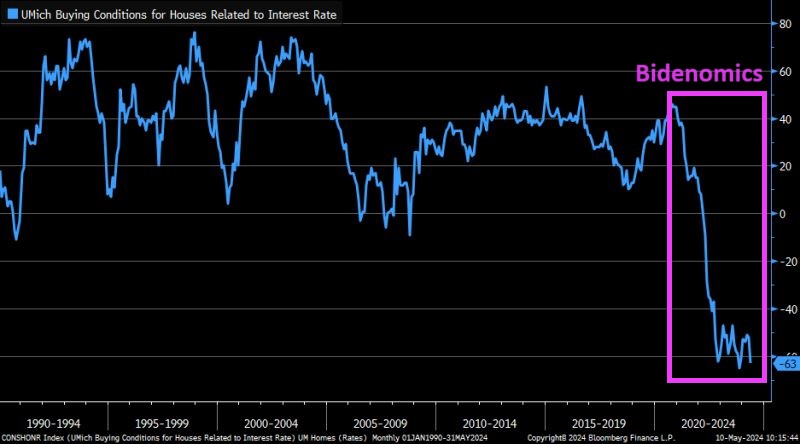
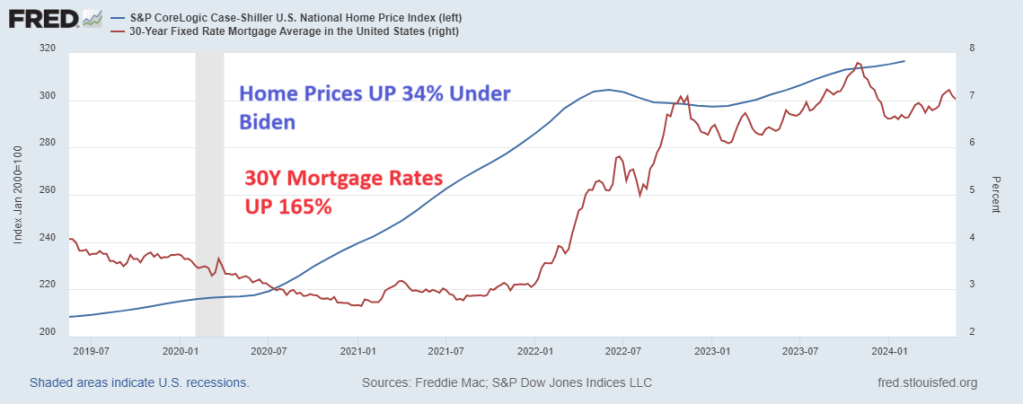
And near 7% mortgage rates aren’t helping (as The Fed continues its fight against Bidenflation).

US new home sales were expected to dip 0.2% MoM in May… but they didn’t..
New home sales crashed 11.3% MoM (after April’s 4.7% drop was revised up to a 2.0% MoM rise). That is the biggest MoM drop since Sept 2022…
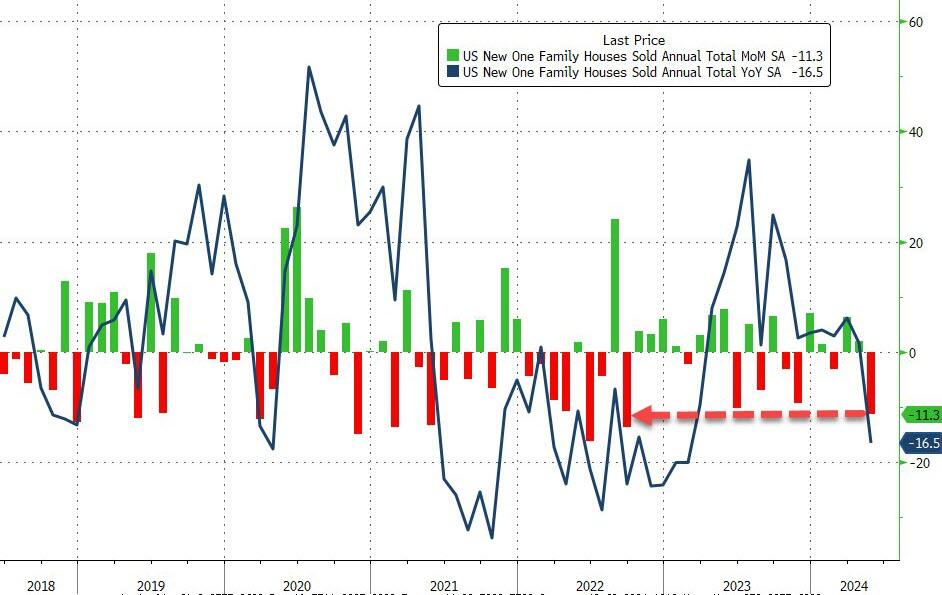
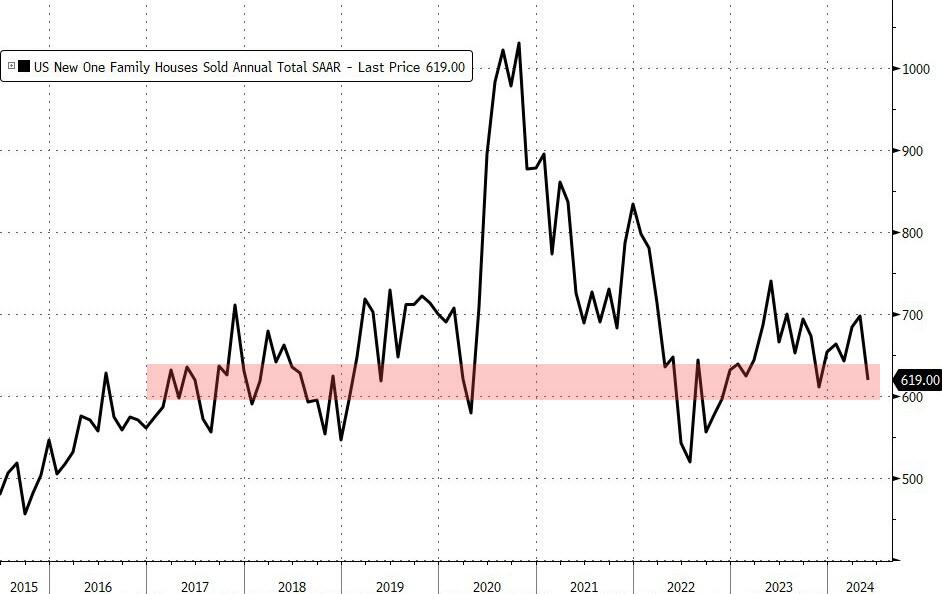
This is the biggest YoY drop since Feb 2023, taking the SAAR down to the same level as it was in 2016…
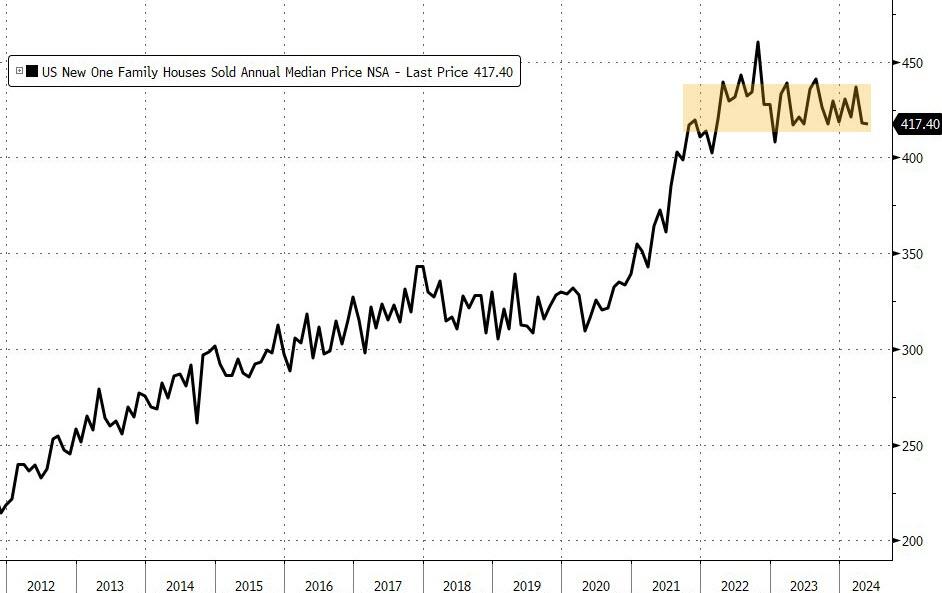
Median new home price fell 0.9% YoY to $417,400 – lowest since April 2023 – (with the average selling price at $520,000) with a big downward revision for April from $433k to $417k!…
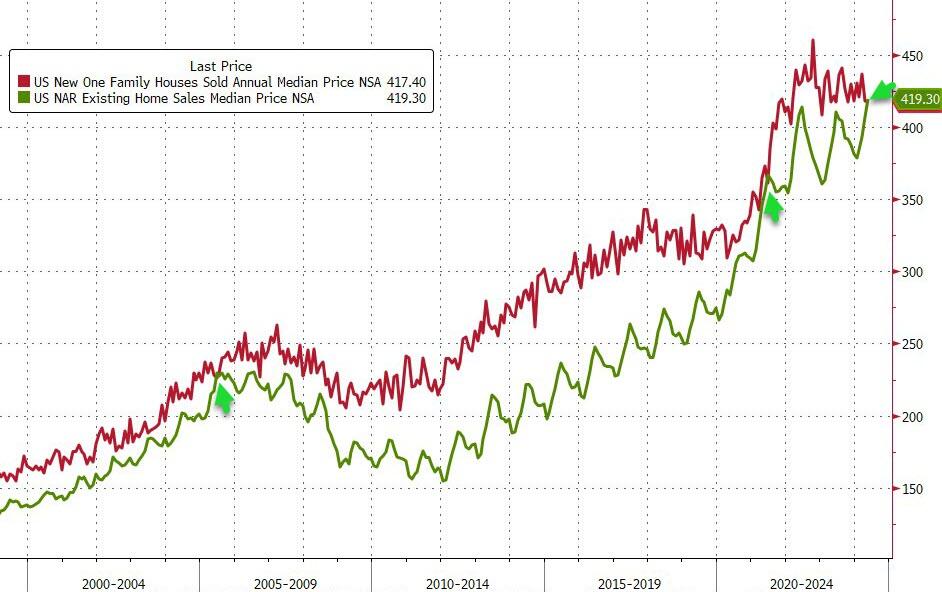
For the first time since June 2021, median existing home prices are above median new home prices…
As BofA warned yesterday:
“The US housing market is stuck, and we are not convinced it will become unstuck anytime soon. After a surge in housing activity during the pandemic, it has since retreated and stabilized. We view the forces that have reduced affordability, created a lock-in effect for homeowners, and limited housing activity will remain in place through our forecast horizon “
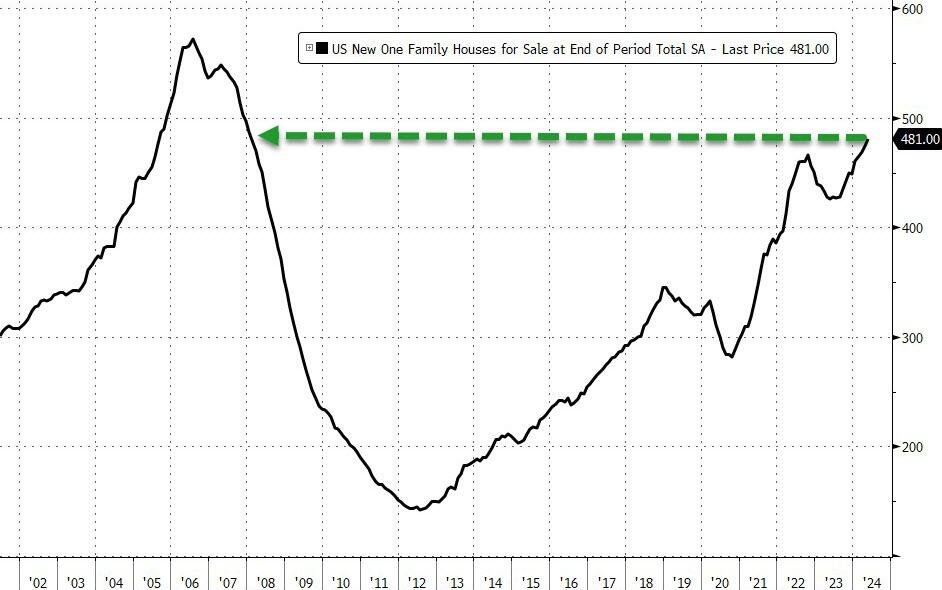
At the same time, the supply of available homes increased to 481,000, still the highest since 2008.
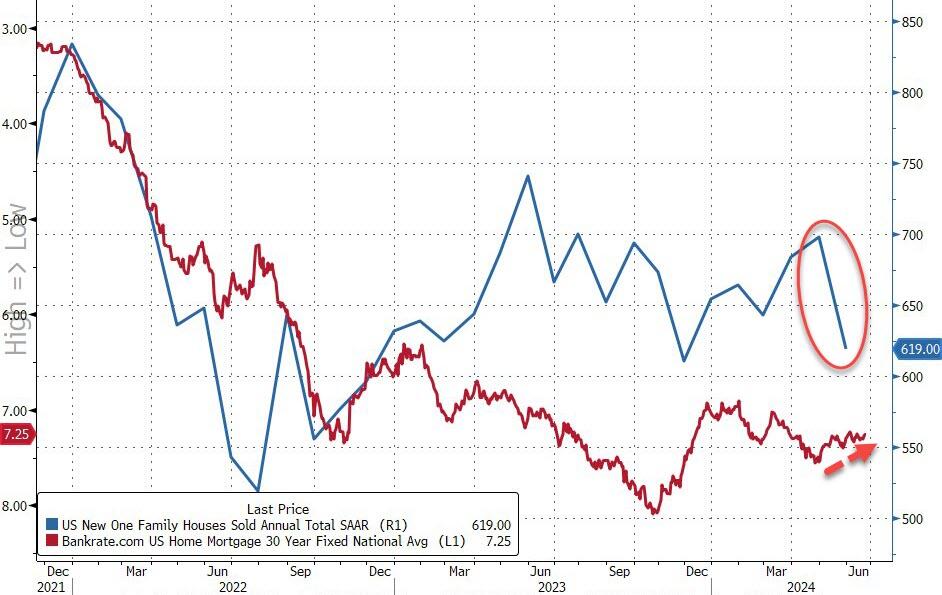
New home sales are catching down to the reality of mortgage rates continuing to hold above 7%…
It seems homebuilders finally gave up filling that gap in anticipation of an imminent Fed rate-cut to save the world.
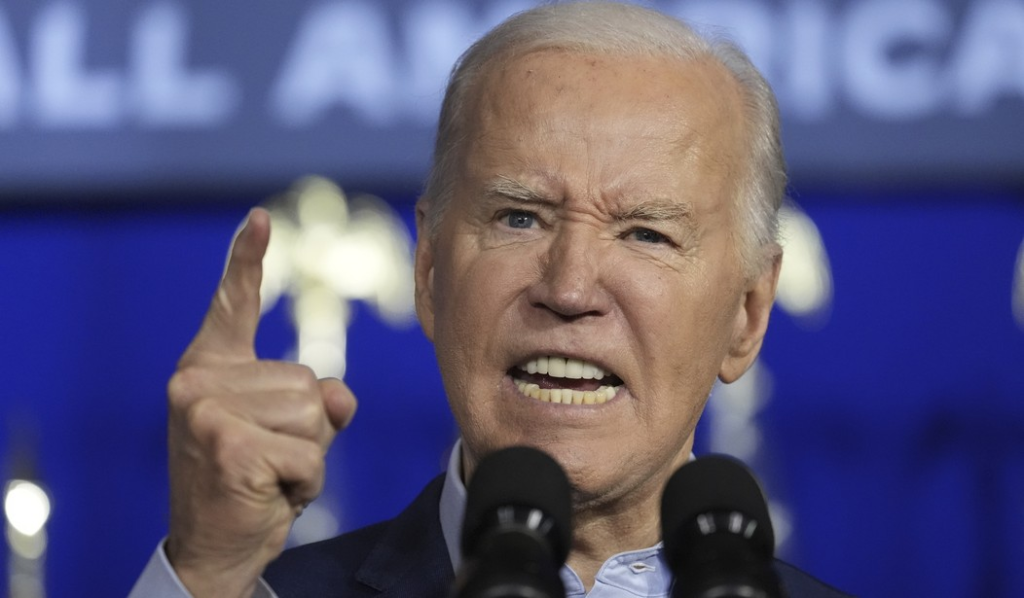
Will Biden double down on his failed policies tonight in the CNN Presidential debate? Perhaps Joe can sing “Double Shot of Bidenomics.”


You must be logged in to post a comment.