The good news / bad news for immigration enforcement is that home prices are declining as immigration enforcement keeps rolling. Good news for new homebuyers. Bad news for recent homeowners.
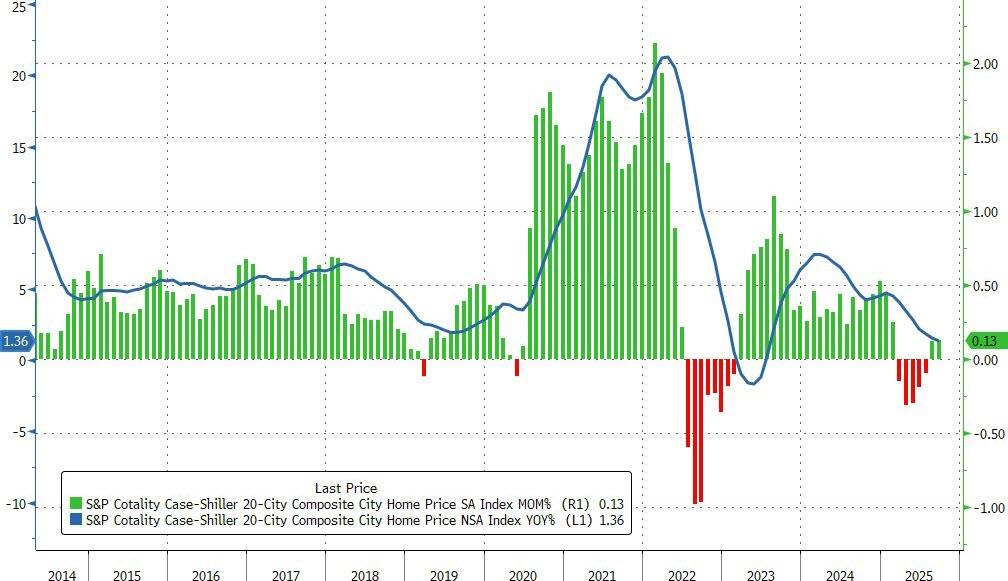
US home prices in the 20 largest cities rose 0.13% MoM in September (very slightly better than the 0.1% rise expected) and up for the second month in a row (after falling for five straight months before). This MoM rise left the average priers up just 1.36% YoY – the lowest since July 2023.
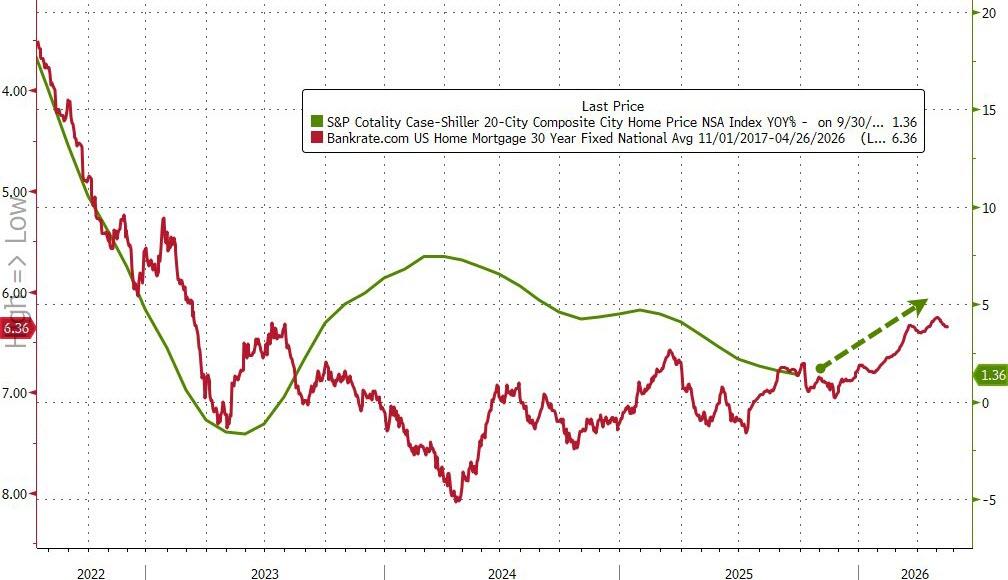
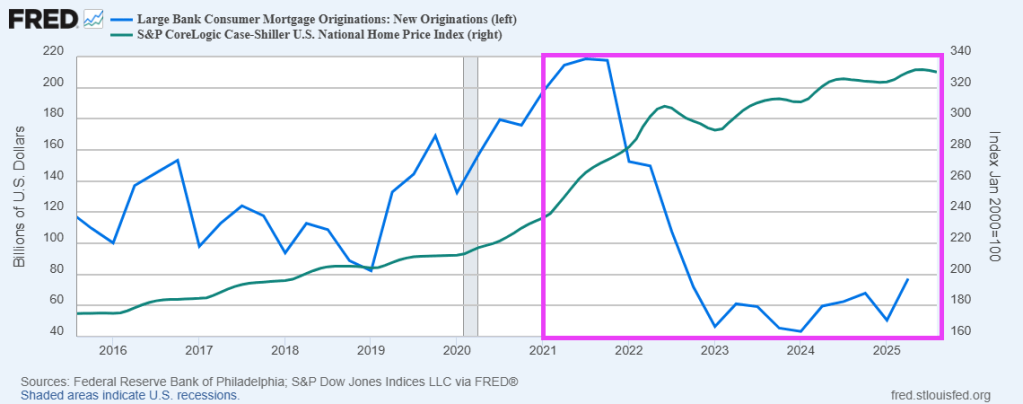
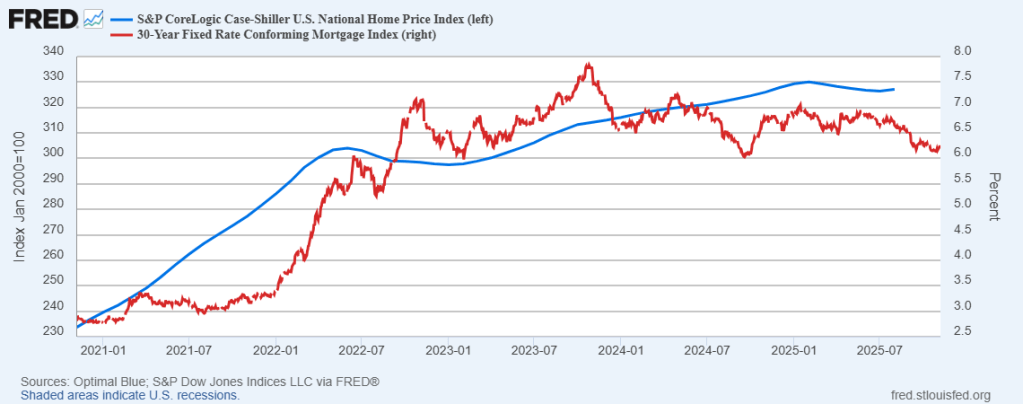
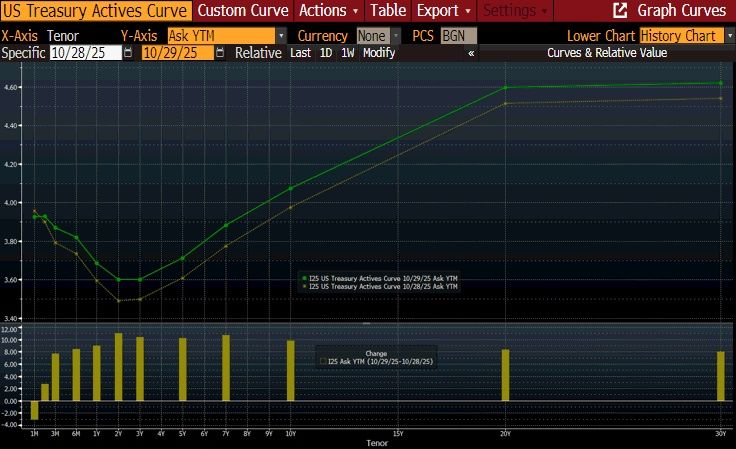
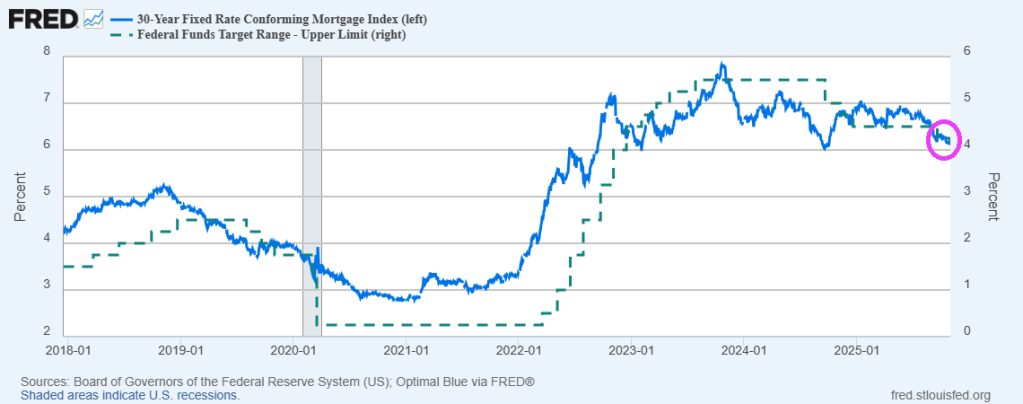
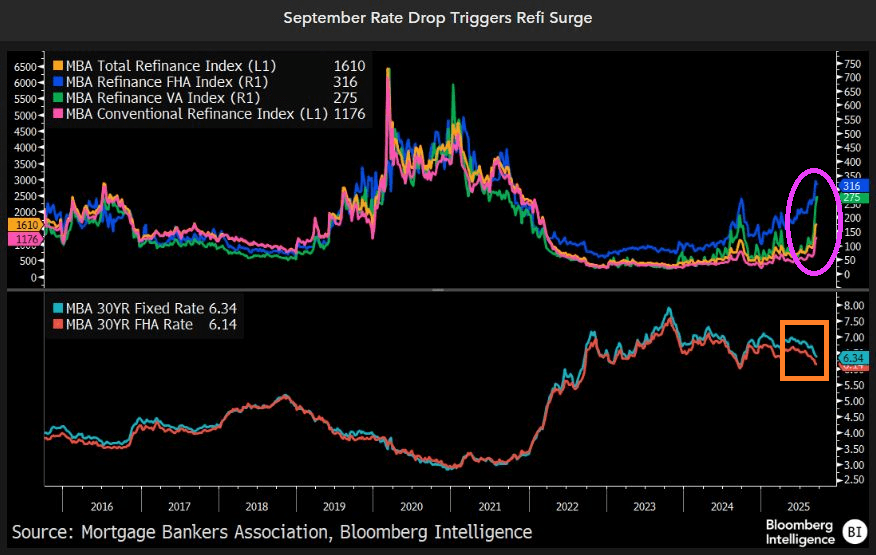
Declining mortgage rates suggest a rebound in aggregate prices could be looming…
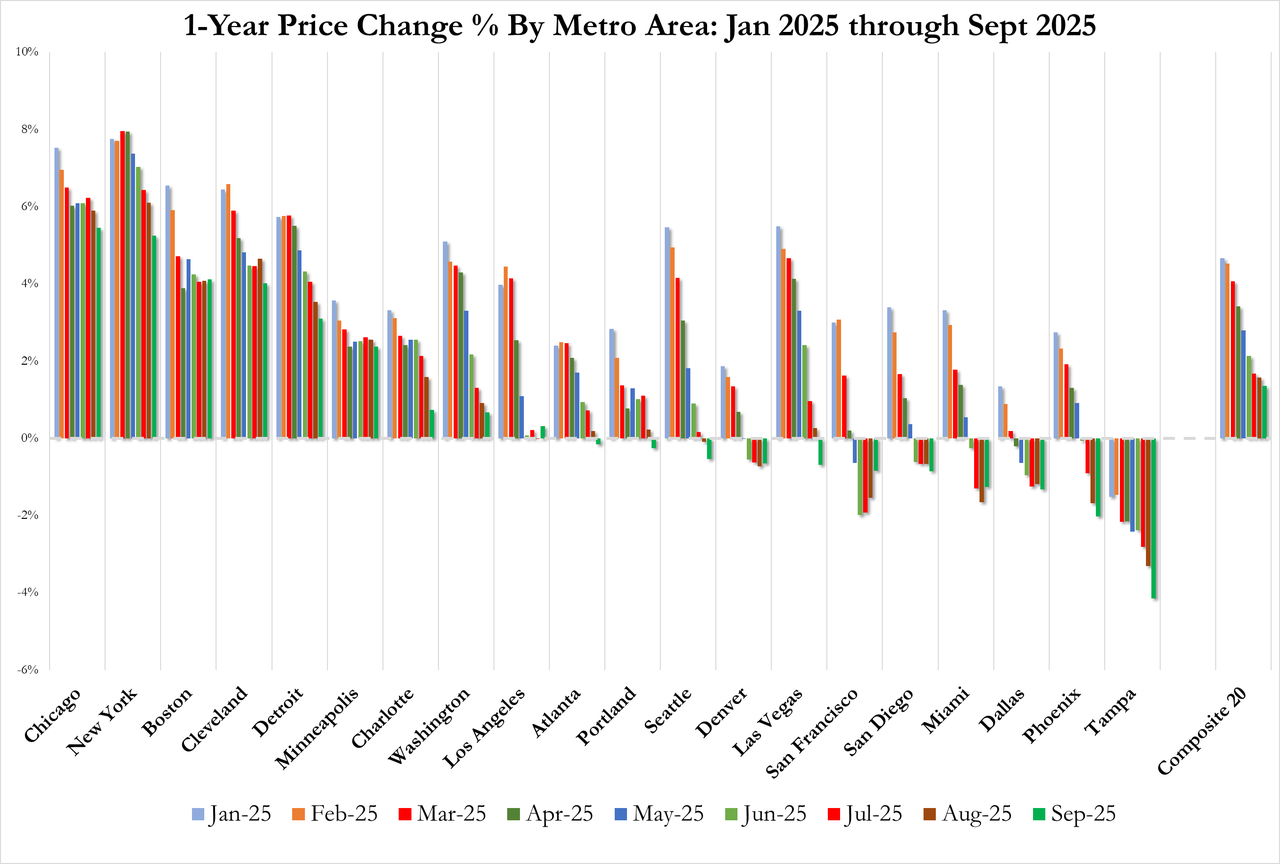
Regional performance reveals a tale of two markets.
Chicago continues to lead with a 5.5% annual gain, followed by New York at 5.2% and Boston at 4.1%. These Northeastern and Midwestern metros have sustained momentum even as broader market conditions soften.
At the opposite extreme, Tampa posted a 4.1% annual decline – the sharpest drop among tracked metros and its 11th consecutive month of negative annual returns. Phoenix (-2.0%), Dallas (-1.3%), and Miami (-1.3%) likewise remained in negative territory, highlighting particular weakness in Sun Belt markets that experienced the most dramatic pandemic-era price surges.
Home Prices are now falling (YoY) in a majority (11/20) of America’s largest cities…
“The geographic rotation is striking,” said Nicholas Godec, CFA, CAIA, CIPM, Head of Fixed Income Tradables & Commodities at S&P Dow Jones Indices.
Meanwhile, traditionally stable metros in the Northeast and Midwest continue to post solid gains, suggesting a reversion to prepandemic patterns where job markets and urban fundamentals drive appreciation rather than migration trends and remote-work dynamics.”
“Markets that were pandemic darlings—particularly in Florida, Arizona, and Texas—are now experiencing outright price declines.
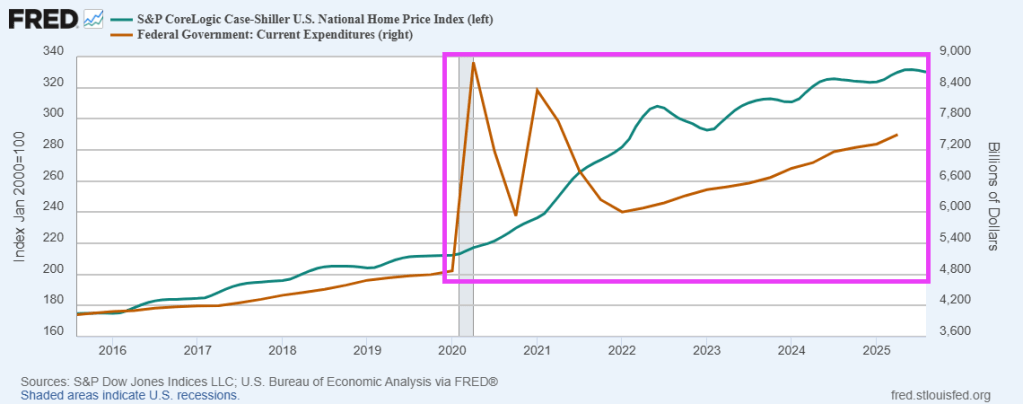
And don’t forget the surge in home prices associated with increased M2 money printing around Covid.


You must be logged in to post a comment.