Jolted! US Job Openings Reveals Massive Growth In (Unproductive) Government Jobs And Lack Of Private Sector Job Growth

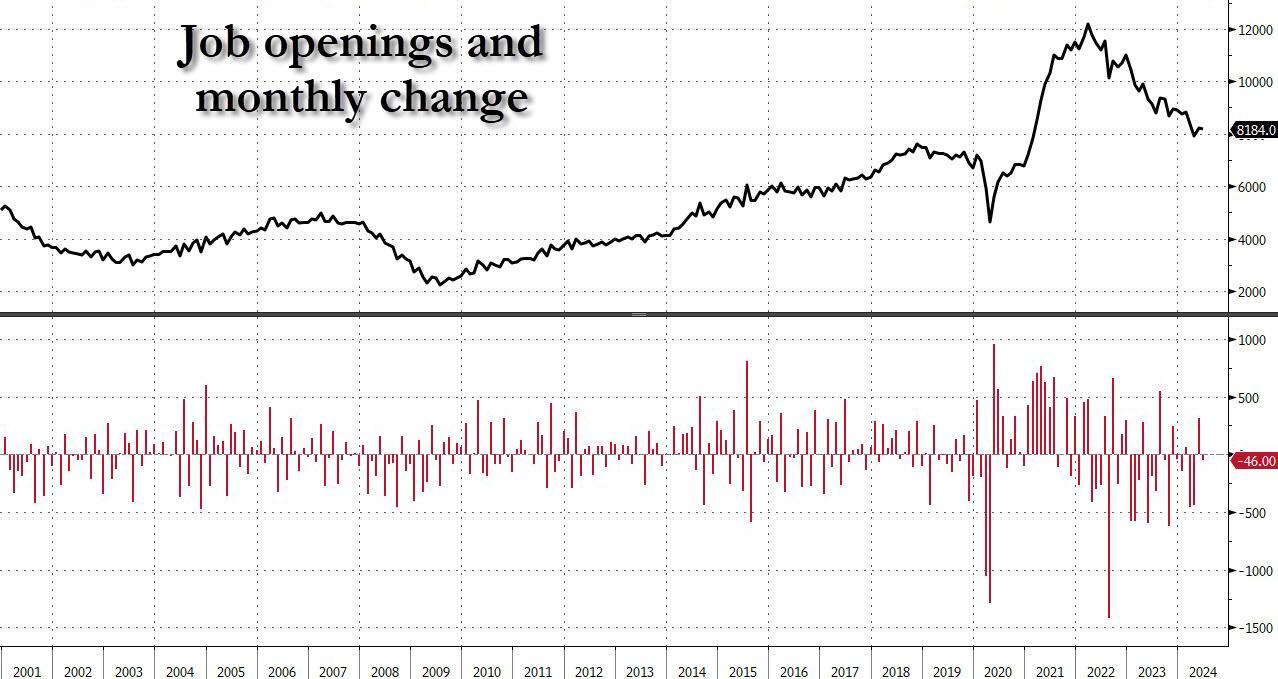
Sigh. We got jolted!

As shown in the chart below, according to the BLS, in June the total number of job openings did drop by 46K from an upward revised 8.230 million to 8.184 million, where the number of government workers was indeed revised lower, however, the ultimate drop was not as big as we, or the street, had expected and it printed above the consensus estimate of 8.00 million.

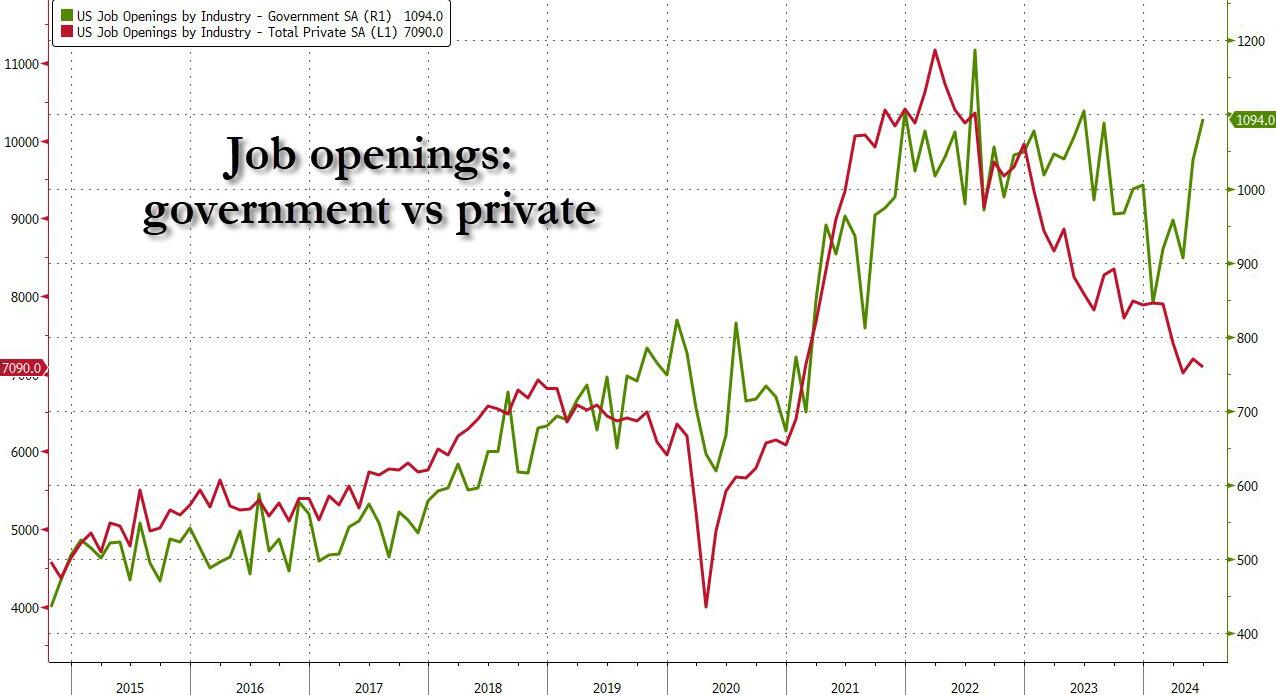
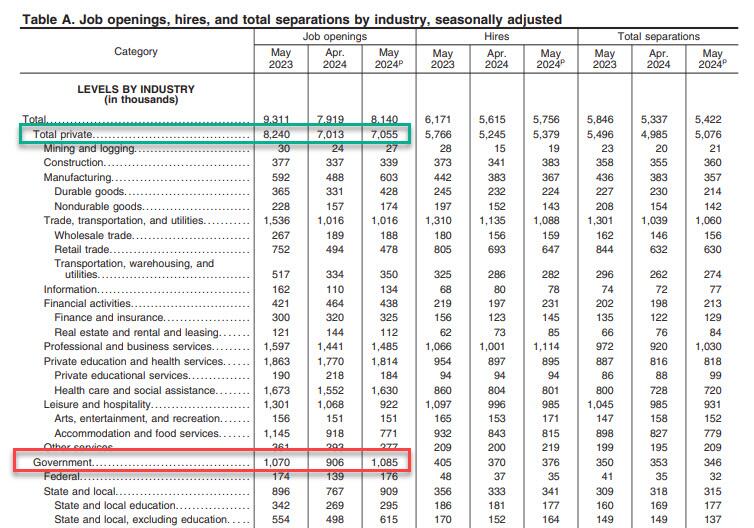
And yet, the same data rigging observed last month took place once again, because a quick look at the breakdown shows that while private jobs saw another broad drop in openings across private sectors…

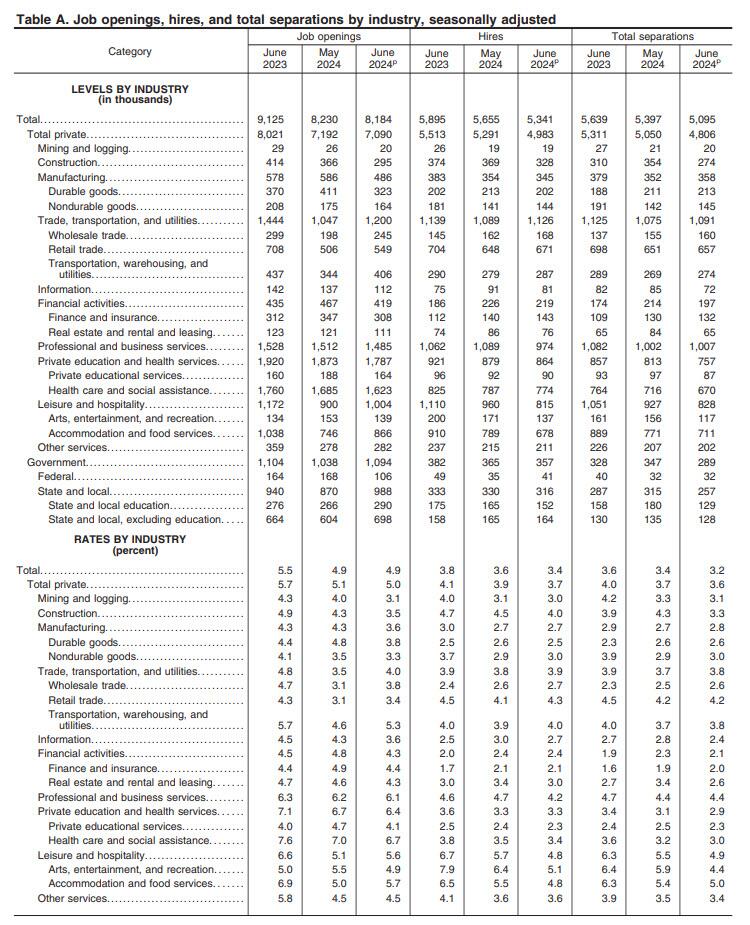
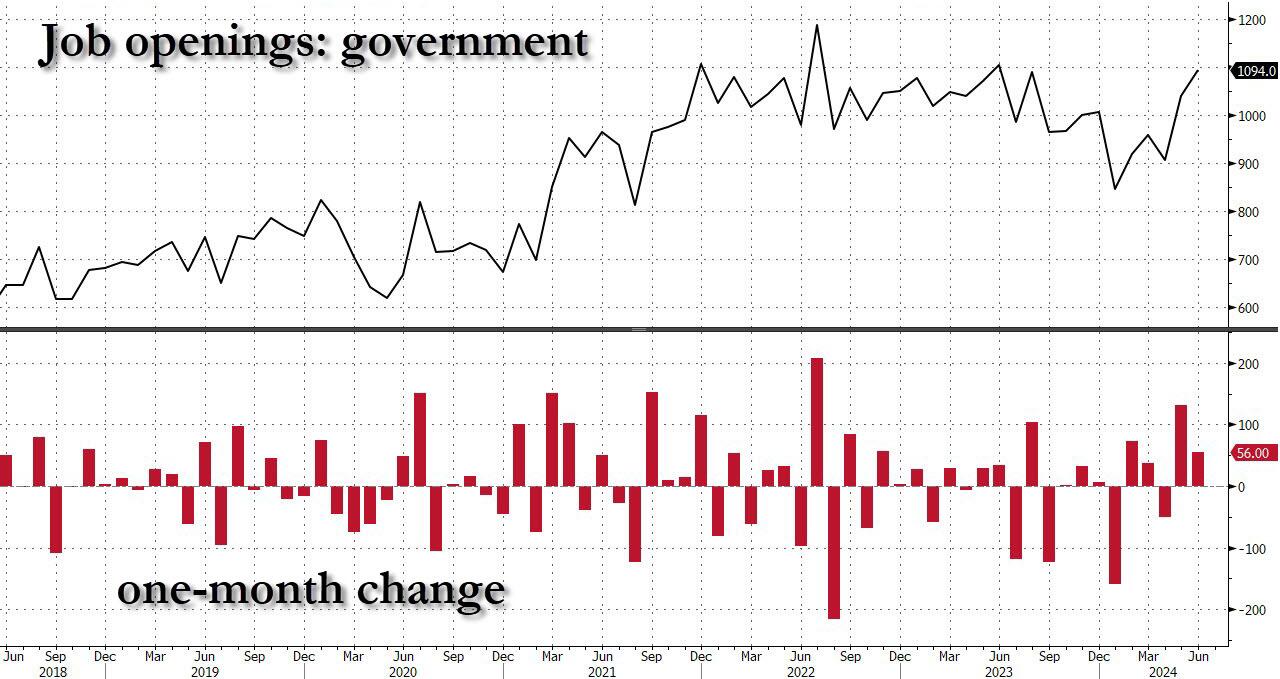
… this was almost fully offset by the relentless surge in government job openings.

Yes, while May was indeed revised lower, June saw another bizarre jump in government job openings, surging to a near record 1.094 million, driven by a 118K spike in State and Local job openings.

Putting it all together, while private sector job openings plunged to a level seen back in late 2018, government job openings are just shy of a record high!

Ignoring the data manipulation, in the context of the broader jobs report, in June the number of job openings was 1.373 million more than the number of unemployed workers (which the BLS reported was 6.811 million), down from last month’s 1.581 million and the lowest since the summer of 2021.

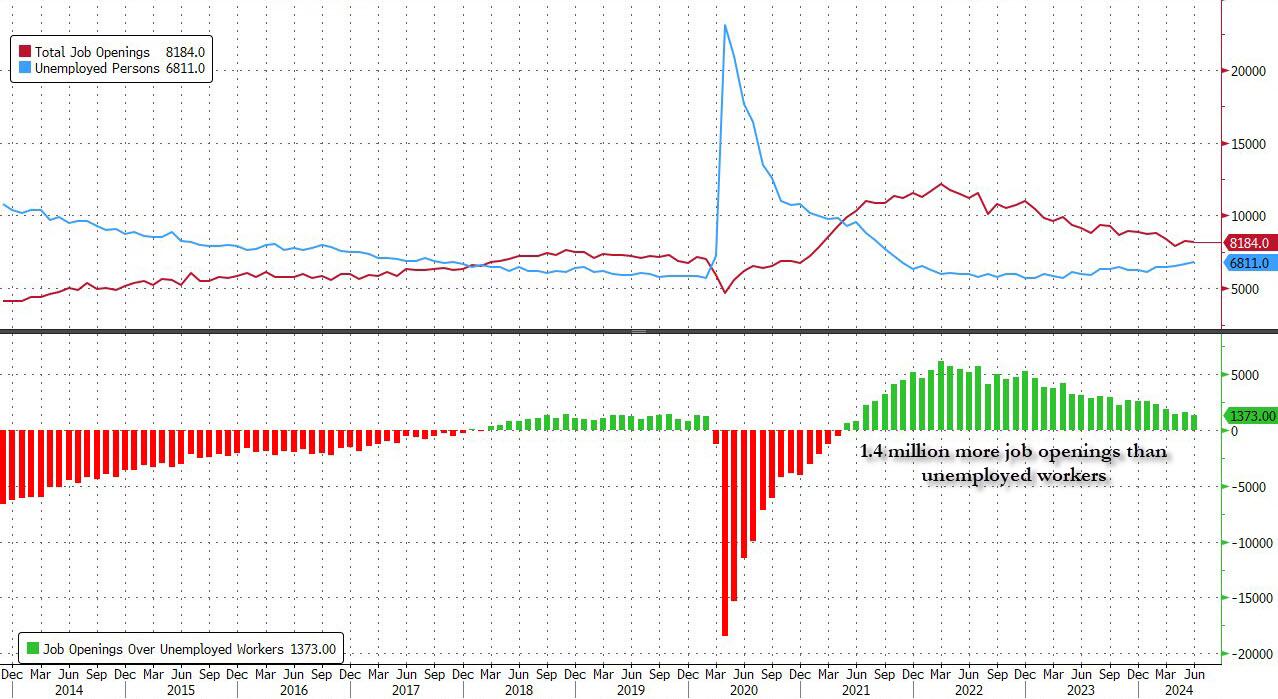
Said otherwise, in April the number of job openings to unemployed dropped to just 1.24, a sharp slide from the March print of 1.30, the lowest level since June 2021 and now officially back to pre-covid levels.

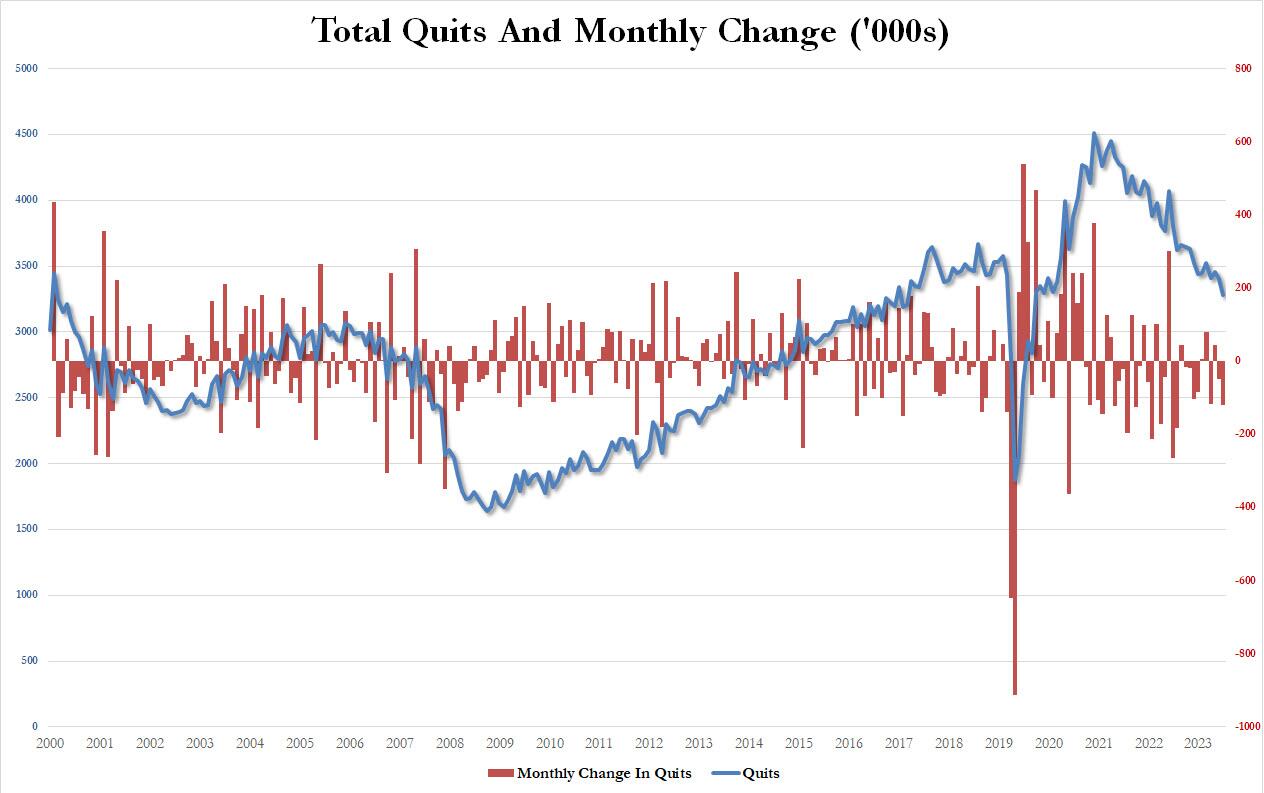
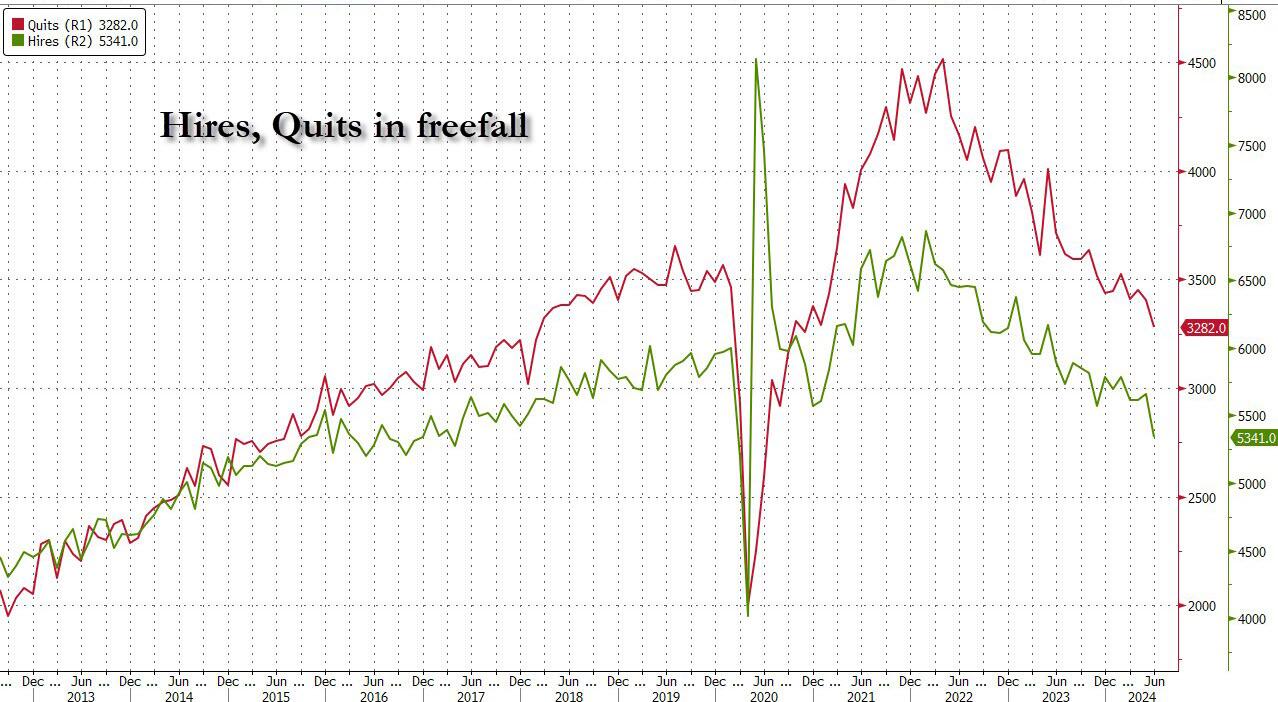
But wait there’s more: confirming that if one ignores the clearly manipulated jump in government job openings (“quick, let’s hire a ton more TSA agents and deep state apparatchiks to make it seems that Kamalanomics is working”), a quick look at the number of quits – an indicator closely associated with labor market strength as it shows workers are confident they can find a better wage elsewhere – showed a plunge in June, dropping by 121K, the most since July 2023, to just 3.282 million, the lowest since August 2020!

Finally, the piece de resistance was the number of actual hires, which in June also tumbled to just 5341, down a massive 314K in one month, the biggest monthly drop since February 2023…

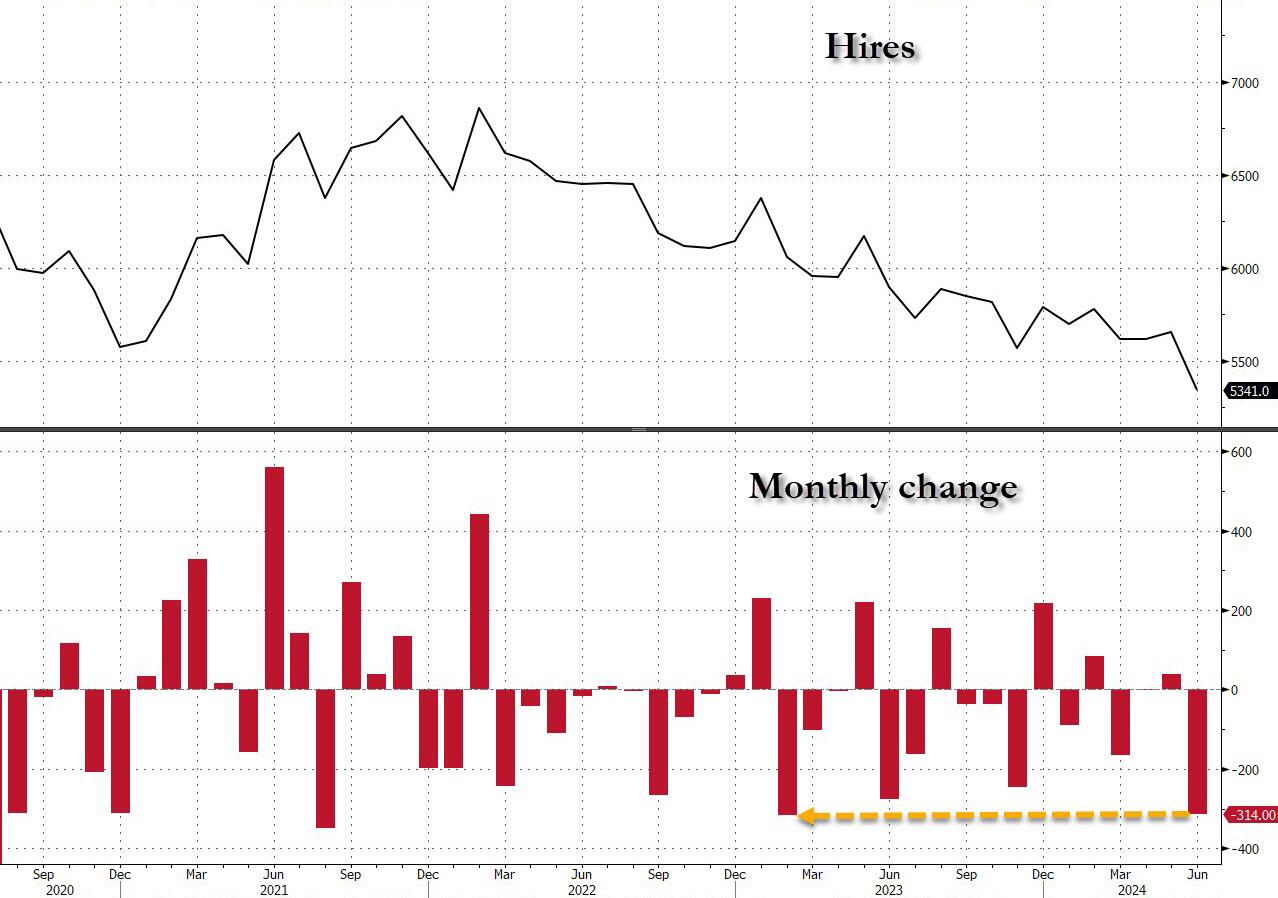
… dragging the total to just 5.3 million, the lowest level since the depts of the covid lockdowns.

Finally, no matter what the “data” shows, let’s not forget that it is all just estimated, and it is safe to say that the real number of job openings remains still far lower since half of it – or some 70% to be specific – is guesswork. As the BLS itself admits, while the response rate to most of its various labor (and other) surveys has collapsed in recent years, nothing is as bad as the JOLTS report where the actual response rate remains near a record low 33%

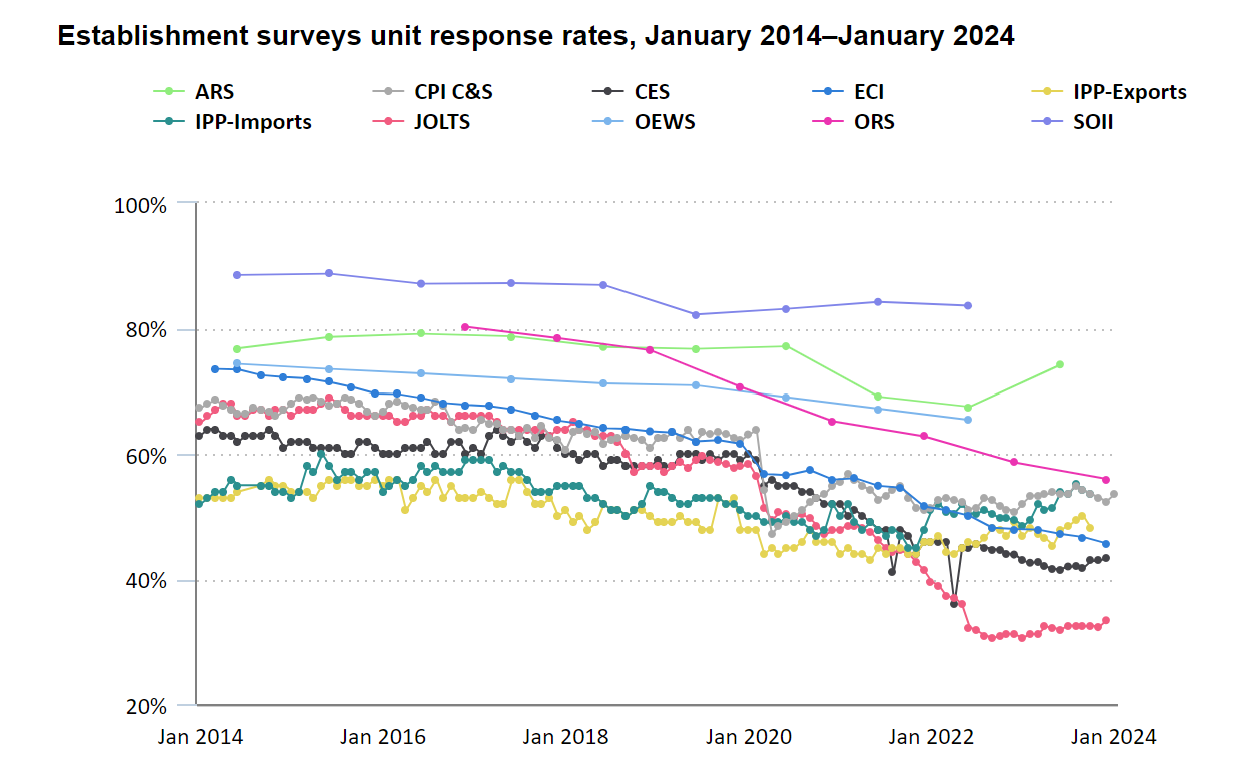
In other words, more than two thirds, or 70% of the final number of job openings, is estimated!

And at a time when it is critical for Biden, pardon Kamala, to still maintain the illusion that at least the labor market remains strong when everything else in the economy is crashing and burning, we’ll let readers decide if the near record number of government job openings at a time when hiring and quitting are both crashing, is an accurate reflection of a strong labor market, or is merely a reflection of a debt-funded deep state gone full tilt. We’ll know the answer on Friday.

Ten Thousand Commandments! Biden/Harris Regulations Cost Families $15,000+ (17% Of Household Income) … And More To Come! (Yellen Wants $78 TRILLION To Combat Climate Change)

Regulate! Regulate! Dance to THEIR music!

According to the Competitive Enterprise Institute, Biden/Harris heaped droves of regulations on American families in the amount of $15,000 per family.

Here is a breakdown of the annual cost of regulations:

And “China” Kamala (ChiKam) plans even MORE regulations!

  • Federal regulation’s total compliance costs and economic effects are at least $2.117 trillion annually in Ten Thousand Commandments’ estimate, and almost certainly higher.
  • An October 2023 National Association of Manufacturers (NAM) report models regulatory compliance at $3.079 trillion annually.
  • US households pay on average $15,788 annually in a hidden regulatory tax, which consumes 17 percent of income and 22 percent of household expenses.
  • These outlays exceed expenditures on health care, food, transportation, entertainment, apparel, services, and savings. Only the costs of housing, which stand at $24,298 annually, exceed regulation.
  • The higher NAM figure implies $22,962 per household, or 31 percent of the household expense budget.
  • The regulatory tax of $2.117 trillion rivals individual income tax costs estimated at $2.328 trillion for 2023 and stands at nearly four times the corporate income tax of $546 billion.
  • The NAM cost figure of $3.1 trillion annually would exceed the sum of both ($2.9 trillion).
  • If it were a country, US regulation would be the world’s 10th-largest economy, ranking behind Canada and ahead of Italy.
  • If we exclude the US economy from the list, the US regulation economy would be the ninth largest, still behind Canada and ahead of Italy.
  • The 10.34 billion hours Washington says it took to complete federal paperwork in 2022, according to the Information Collection Budget, translate to the equivalent of 14,883 human lifetimes.
  • The tally of final rules for 2023 stood at 3,018, which is the second-lowest count since at least 1976.
  • On the other hand, the Federal Register containing those rules surged to 89,368 pages, the second-highest tally on record and a 12 percent rise over 2022.
  • Although we have fewer new rules, they appear to be broader in scope.
  • During calendar year 2023, agencies issued 3,018 rules, whereas Congress enacted 68 laws. Thus, agencies issued 44 rules for every law enacted by Congress.
  • This Unconstitutionality Index—the ratio of regulations issued by agencies to laws passed by Congress and signed by the president—underlines how much agency lawmaking has replaced that of elected officials. The average ratio over the past 10 years is 23 rules for every law.
  • Since the Federal Register first began itemizing final rules in 1976, 217,565 have been issued. Since 1993, when the first edition of Ten Thousand Commandments appeared, agencies have issued 120,475 final rules.
  • A 2023 draft consolidated version of the White House Report to Congress on the Benefits and Costs of Federal Regulations caught up on fiscal years 2020–2022. The report for 2023 has still not been released.
  • A total of only 31 “major” rules had both benefits and costs quantified, and these add $13 billion to the annual regulatory cost bill; another 56 rules with costs but not benefits quantified add another $46 billion to annual costs.
  • Employing our lower estimate, regulatory burdens of $2.1 trillion amount to nearly 8 percent of US gross domestic product (GDP), reported by the Commerce Department at $27.36 trillion in 2023.
  • The NAM regulatory figure implies 11 percent of GDP.
  • Regulatory costs stand at over 60 percent of the level of corporate pretax profits of $3.523 trillion.
  • The NAM figure would take that to over 80 percent.
  • When regulatory costs of $2.1 trillion are combined with federal outlays of $6.135 trillion, the federal government’s share of the $27.36 trillion economy reaches at least 30 percent. State and local spending and regulation add to these costs.
  • Until April 2023, a subset of each year’s 3,000-plus rules was deemed economically significant, referring to annual economic effects of $100 million or more. Biden’s Executive Order 14094 (“Modernizing Regulatory Review”) eliminated that category and initiated a higher $200 million Section 3(f)(1) Significant category.
  • In the year-end 2023 edition of the twice-yearly Unified Agenda of Federal Regulatory and Deregulatory Actions, 69 federal departments, agencies, and commissions present 3,599 regulatory actions flowing through the pipeline as follows:
  • 2,524 rules in the active (prerule, proposed, final) phase
  • 431 recently completed rules
  • 644 long-term rules
  • Of the 3,599 regulations in the fall 2023 Unified Agenda’s pipeline, 304 are Section 3(f)(1) Significant category rules (which implies at least $60 billion in economic impact), as follows:
  • 233 rules in the active (prerule, proposed, final) phase
  • 41 completed rules
  • 30 long-term rules
  • Despite his own higher $200 million threshold, high-significance rules in the Biden pipeline outnumber the Bush, Obama, and Trump years when the lower $100 million threshold applied.
  • Major rules as defined in the Congressional Review Act leave a $100 million threshold intact despite Biden’s executive order. The Government Accountability Office database contains 76 finalized major rules for 2023. The Biden average exceeds those of Bush, Obama, and Trump.
  • Final rules affecting small business appear to be mounting and could generate calls for reform. Biden’s three years have averaged 870 rules annually in the Federal Register affecting small business, compared with 694 and 701 for Obama and Trump, respectively.
  • Of the 3,599 rules and regulations in the fall 2023 Unified Agenda pipeline, 690 affect small businesses; of those, 370 required an official “regulatory flexibility analysis.”
  • Biden-era mandates affect state and local governments at heights not seen in over a decade. Rules in the Unified Agenda pipeline affecting state governments stand at 507, while rules affecting local governments stand at 349.
  • The five most active rule-producing executive branch entities in the Unified Agenda—the departments of the Interior, the Treasury, Transportation, Commerce, and Health and Human Services—account for 1,497 rules, or 42 percent of all rules in the pipeline. The five most active independent agencies account for another 318 rules.
  • From the nation’s founding through 2022, more than 15,635 executive orders have been issued. Biden issued 24 executive orders in 2023, well below his peak 77 of 2021. Biden’s presidential memoranda continue to outstrip the average of recent predecessors.
  • Public notices in the Federal Register always exceed 22,000 annually, with uncounted guidance documents and other proclamations that hold potential regulatory effect among them, whereas other guidance documents issued do not appear in the Federal Register at all. In 2023, 23,197 notices were issued. There have been 714,563 public notices since 1994 and over a million since the 1970s.

DC bureaucrats are out of control. Treasury Secretary Yellen calls for $78 TRILLION to tackle climate change. So to quote The Carpenters, they’ve only just begun to regulate.

JOLT’IN Joe! US Job Openings Almost Exclusively Government Jobs (Productive Private Sector Jobs Barely Grow At 2.8% While Unproductive Government Jobs Grow 20%)

No, Joe Biden isn’t Joltin’ Joe Di Maggio (the Yankee Clipper). Joe Biden is a Socialist who loves government and hates free markets. I feel like Biden and his junta are emuilating the old Soviet Union and Communism. Those of us who still love free markets are back on the chain gang.

After two months of sharp declines in the number of job openings, moments ago Biden’s highly politicized Department of Labor reported that in May, the number of job openings unexpectedly spiked by a whopping 221K, to 8.140 million – far above the 7.950 million estimate – from a downward revised April print of 7.919 million, down 140K from the original print of 8.059 million.

Job revisions aside, there was only a 2.8% increase in private sector job openings in May. On the other hand, nonproductive job openings (aka, government) were up a staggering 20% in May.

C’mon man, hiring government workers doesn’t grow the economy in an organic way. Just a Soviet way.

Soviet Joe and the new Eva Peron. Don’t cry for Jill Biden, she is a half-wit acting like a Queen.

It’s Hard! US Manufacturing PMI Collapsed In June

It’s hard. What is? US hard economic data!

With ‘hard’ data collapsing in the last month, ‘soft’ survey data from ISM and S&P Global this morning was ‘mixed’ as usual:

  • S&P Global US Manufacturing PMI rose from 51.3 in May to 51.6 for the final June print (down very modestly from the 51.7 flash print).
  • ISM US Manufacturing PMI dropped from 48.7 to 48.5 in June (well below the 49.1 expected)

Source: Bloomberg

Need more confusion…

S&P Global noted that higher supplier charges were signaled in June. Alongside rising labor costs, this resulted in a further marked increase in input prices. But, ISM saw Prices Paid plunge from 57.0 to 52.1, well below the 55.8 expected…

Source: Bloomberg

New orders rebounded in June but employment dropped back into contraction. On the bright side, Orders/Inventories (typically a leading indicator), ticked up in June…

Source: Bloomberg

Chris Williamson, Chief Business Economist at S&P Global Market Intelligence, said:

“The S&P Global PMI survey shows US manufacturers struggling to achieve strong production growth in June, hamstrung by weak demand from domestic and export markets alike. Although the PMI has now been in positive territory in five of the first six months of 2024, up from just one positive month in 2023, growth momentum remains frustratingly weak.

“Factories have been hit over the past two years by demand switching post-pandemic from goods to services, while at the same time household and business spending power has been diminished by higher prices and concerns over higher-for-longer interest rates. These headwinds persisted into June, accompanied by heightened uncertainty about the economic outlook as the presidential election draws closer.

Finally, despite the uptick, Williamson admits the truth under the surface of the survey:

“Business confidence has consequently fallen to the lowest for 19 months, suggesting the manufacturing sector is bracing itself for further tough times in the coming months.”

However, we are sure business owners everywhere were reassured by the commander-in-chief’s commanding performance in the debate last week. /sarc

Hey Big Spenders! 16 Nobel Prize-winning economists say Trump policies will fuel inflation (big spending gov’t +37.7%, US debt up 50% under Biden driving the economy, along with Federal Reserve)

Hey big spenders (Biden, Congress and the 16 Nobel prize winning economists).

June 25 (Reuters) – Sixteen Nobel prize-winning economists signed a letter on Tuesday warning that the U.S. and world economy will suffer if Republican presidential candidate Donald Trump wins the U.S. presidential election in November.

The jointly signed letter, first reported by Axios, says the economic agenda of U.S. President Joe Biden, a Democrat, is “vastly superior” to Trump’s, the former Republican president seeking a second term.

Read the source article from Reuters for the rest of the Marxist clown show. What Joe Stiglitz and other Leftist economists are cheerleading in the excessive post Covid spending spree that Biden and Congress went on. There is a different between a free market system and government directed spending, usually on large donors.

One source of crippling inflation under Biden is (wasteful) government spending, up 37.7% under Biden. Federal debt is up a nauseating 50% under Biden. These levels of spending and debt are NOT sustainable!

Another souce of inflation under Biden has been The Federal Reserve. With Covid. The Fed entered like gangbusters dropping their target rate to 25 basis points and massively increasing their balance sheet. Call this BIDEN 1. Then to squelch inflation, The Fed raised their target rate and slowly started to unwind the balance sheet. We saw a slowing of inflation. Nothing to do with Biden, although I am sure he will take credit for it at Thursday’s debate with Trump.

Inflation was growing rapidly in Biden 1, but inflation started to slow (Biden 2) as The Fed rapidly raised their target rate.

US Existing Home Sales Declined -2.8% YoY In May As Leading Economic Index Falls -2.0% Over Past 6 Months

I am no forune teller, but this doesn’t look to good for old Joe (Biden).

Existing home sales fell -2.8% YoY in May.

US existing home sales fell for the third straight month in May (-0.7% MoM vs -1.0% exp). This left home sales down 2.8% YoY (YoY sales have not increased since July 2021)…

Source: Bloomberg

The total home sales SAAR is push back towards COVID lockdown lows once again at 4.1mm, but prices accelerated to a new record high…

Source: Bloomberg

“Home prices reaching new highs are creating a wider divide between those owning properties and those who wish to be first-time buyers,” NAR Chief Economist Lawrence Yun said in a statement.

“Eventually, more inventory will help boost home sales and tame home price gains in the upcoming months.”

And given that mortgage rates remain stubbornly above 7%, existing home sales show no signs of improving anytime soon…

Source: Bloomberg

The supply of homes on the market increased 18.5% from the same month last year to 1.28 million, but it’s still well below the level seen before the pandemic when mortgage rates were much lower.

Source: Bloomberg

About 67% of the homes sold were on the market for less than a month in May, roughly flat from the prior month, while 30% sold above the list price. Properties remained on the market for 24 days on average in May, compared with 26 days in April, NAR’s report said.

The Conference Board Leading Economic Index® (LEI) for the U.S. decreased by 0.5 percent in May 2024 to 101.2 (2016=100), following a 0.6 percent decline in April. Over the six-month period between November 2023 and May 2024, the LEI fell by 2.0 percent—a smaller decrease than its 3.4 percent contraction over the previous six months.

The Bidenomics Plunge! US Retail Sales Plunged In January, Worst YoY Growth Since COVID Lockdown (Stagflation Warning!)

Like the old Nestea plunge, the US economy is plunging as well.

The Biden matter is about to hit the rotating object as they saw retail sales declining bigly (more than expected) in January judging by real-time credit card spending data…

Source: BofA

After they unexpectedly surged in November and December (driven in large part by a jump in Food Services), headline retail sales in January were expected to decline just 0.2%, but BofA nailed it once again with a large 0.8% MoM drop. That dragged the YoY retail sales down to just 0.6%…

Source: Bloomberg

That is the worst monthly decline since March 2023 and worst YoY rise since May 2020.

It wasn’t pretty…

Motor Vehicles and Parts and Building Materials saw the largest decline MoM…

Source: Bloomberg

On a YoY NSA basis, Gas Stations and Building Materials were the biggest drag, while online retailers and Food Services were the biggest upside drivers…

Source: Bloomberg

Core Retail Sales also declined (-0.5% MoM vs +0.2% exp), which dragged the YoY levels down to their lowest since the COVID lockdowns…

Source: Bloomberg

Adjusted (crudely) for inflation, this was a huge drop in ‘real’ retail sales. REAL retail sales have declined for 11 of the last 15 months – in other words, on a crude basis (Ret Sales – CPI), Americans aren’t buying more shit.

Source: Bloomberg

Finally, the control group – used to feed through to the GDP calculation – tumbled 0.4% MoM (vs expectations of +0.2%).

Soft-landing morphing into a stagflationary crash-landing?