Its as if the US economy is thunderstruck! US housing starts collapsed in January as Producer Prices soared. NOT a good sign for the US economy.
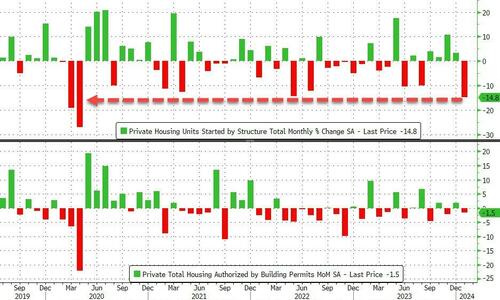
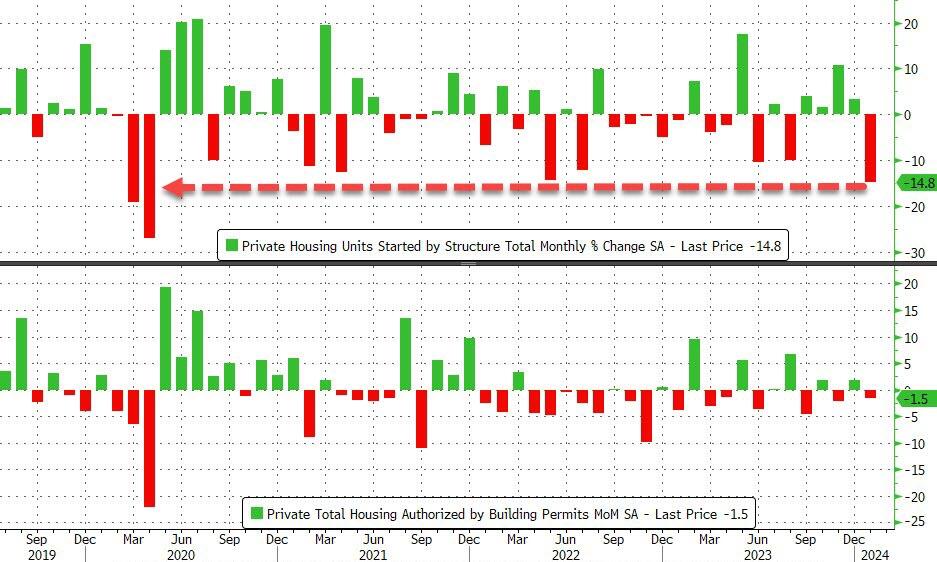
Analysts were way off. Housing Starts puked 14.8% MoM in January (vs unchanged exp), but December’s 4.3% MoM decline was revised up to a 3.3% MoM rise. Building Permits also tumbled, down 1.5% MoM (vs +1.3% exp) and well down from the +1.8% MoM in December…
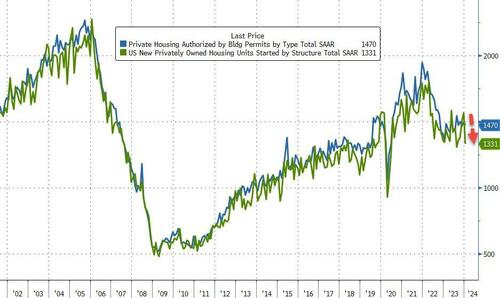
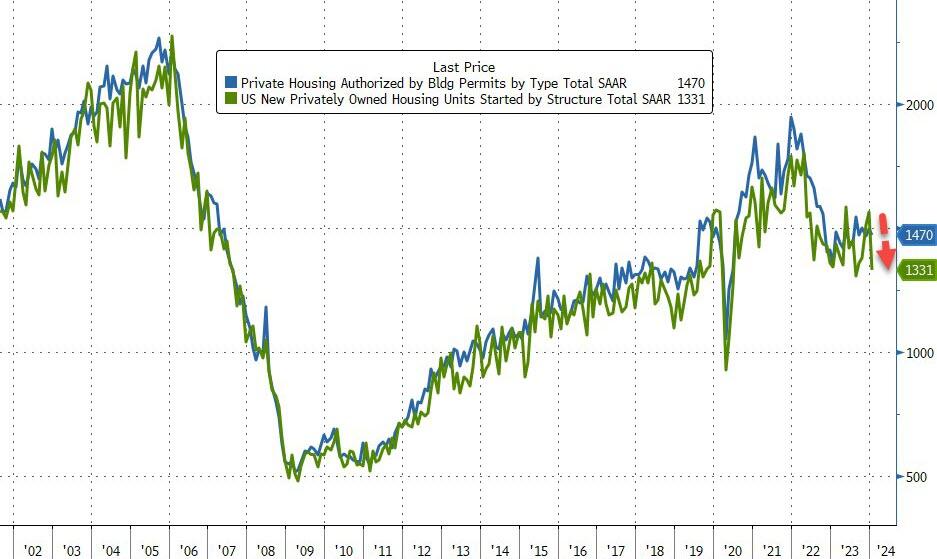
This pushed the Housing Starts SAAR back near post-COVID lows…
DO NOT BLAME THE WEATHER! It’s January – we know there are weather issues and that should be more than ‘priced-in’ on a seasonal adjustment basis.
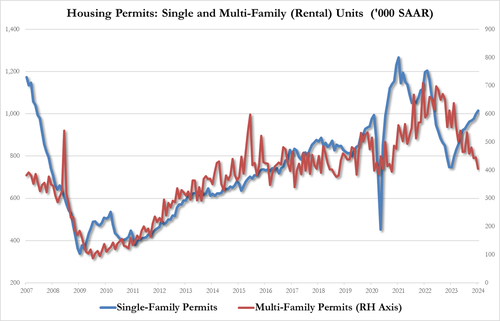
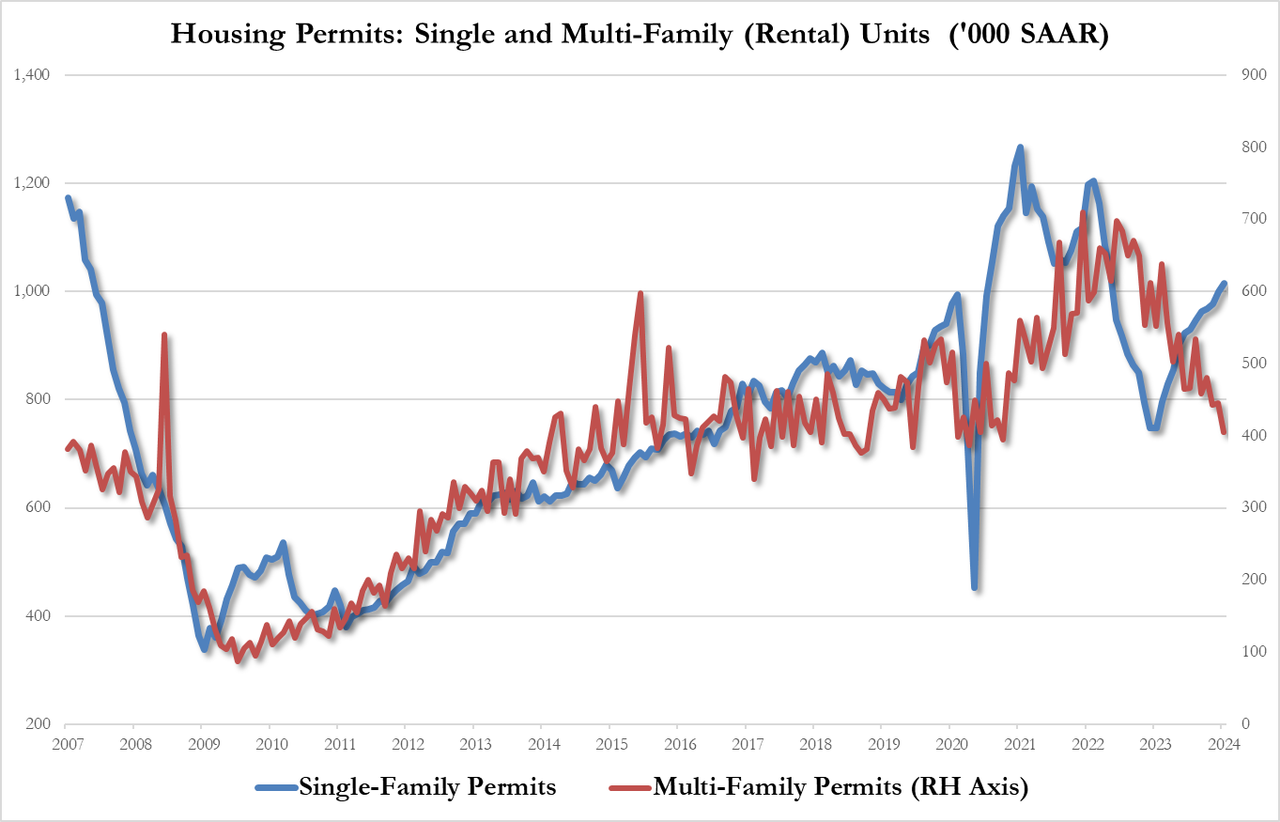
Multi-family permits cratered to their lowest since Oct 2020. Permits for one-family homes edged higher after rising consistently throughout 2023
And multi-family starts were even worse, plunging from 489k SAAR to 314k SAAR – the lowest since May 2020 (when the economy was closed)…
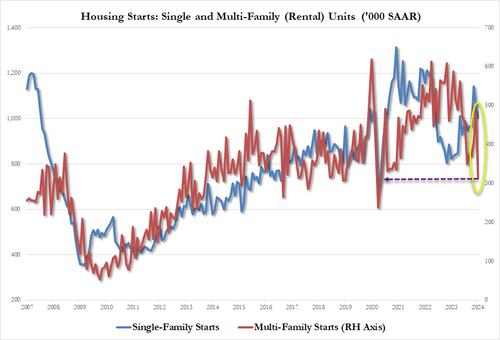
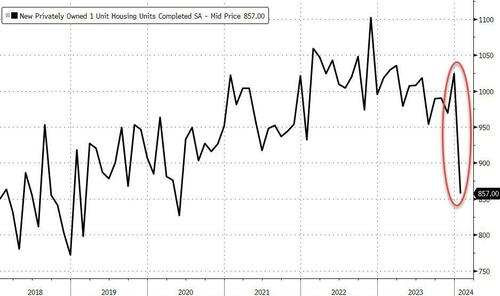
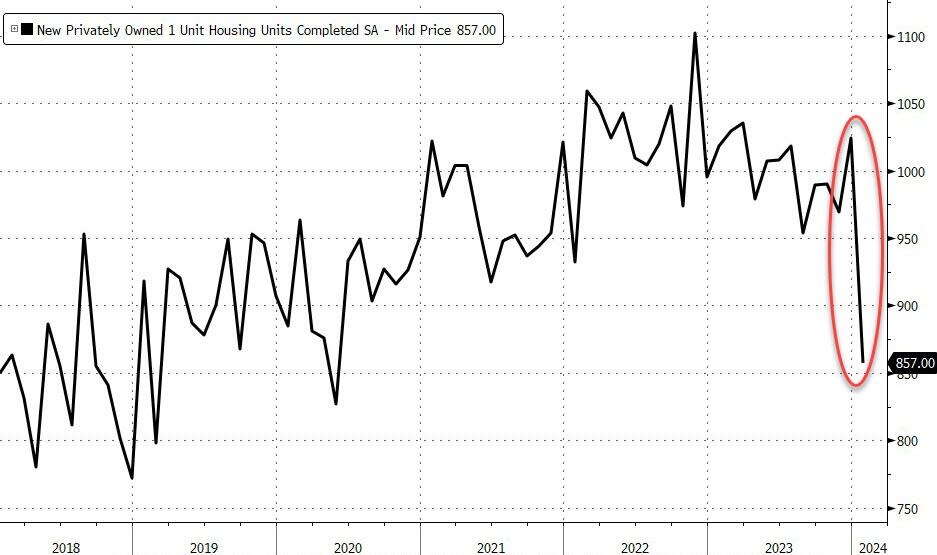
The government’s report showed housing starts fell in all four of the nation’s regions, led by the Midwest and Northeast. The number of single-family homes completed plunged to the lowest level since May 2020.
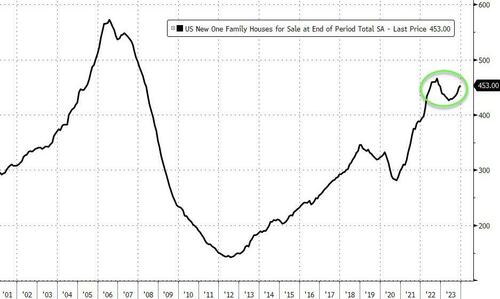
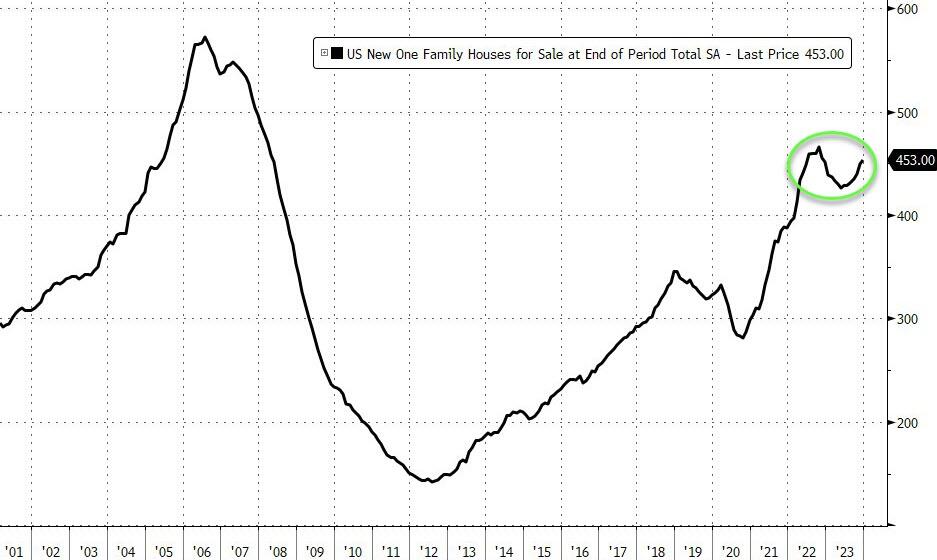
They built it, but no one came… the inventory of new houses for sale remains elevated and suggests builders may be cautious about beginning new projects.
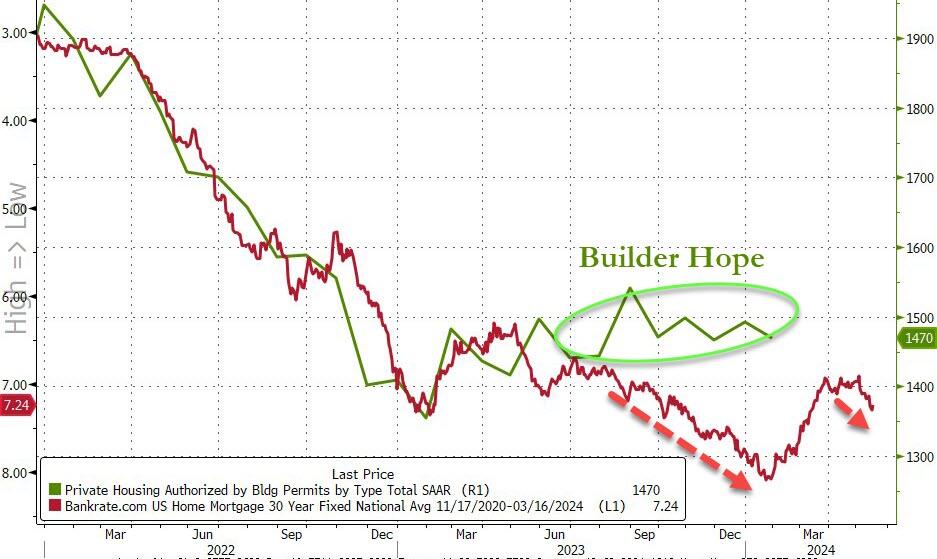
Don’t expect Permits to be reaccelerating anytime soon as mortgage rates have started to rise once again…
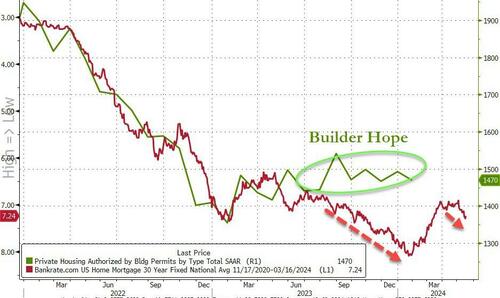
Which is not good news for CPI either as it suggests there is little rent relief coming soon.
And finally, there is a record gap between what the government tells us about construction employment and actual construction activity…
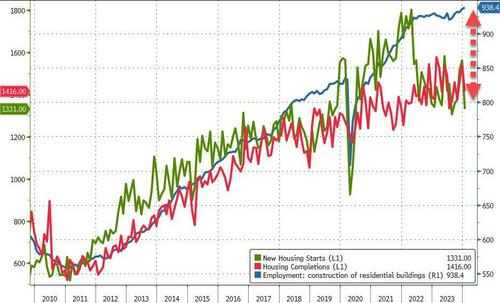
Makes you wonder, eh? Did builders all suddenly get massively less productive? Or is the BLS just making shit up as usual?
And then we have producer price spiking in January.
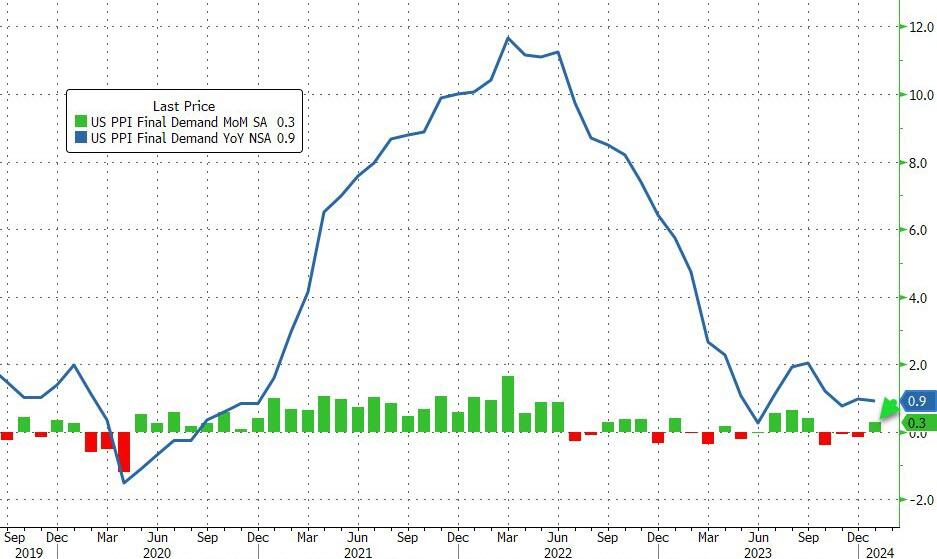
After the hotter-than-expected CPI (which has been shrugged off entirely by the stock market), Producer Prices were expected to rebound very modestly MoM but continue to slow on a YoY basis in January. Instead, like CPI, it re-accelerated with headline rising 0.3% MoM (+0.1% MoM exp), which left PPI up 0.9% YoY (down from December but hotter than the +0.6% exp)…

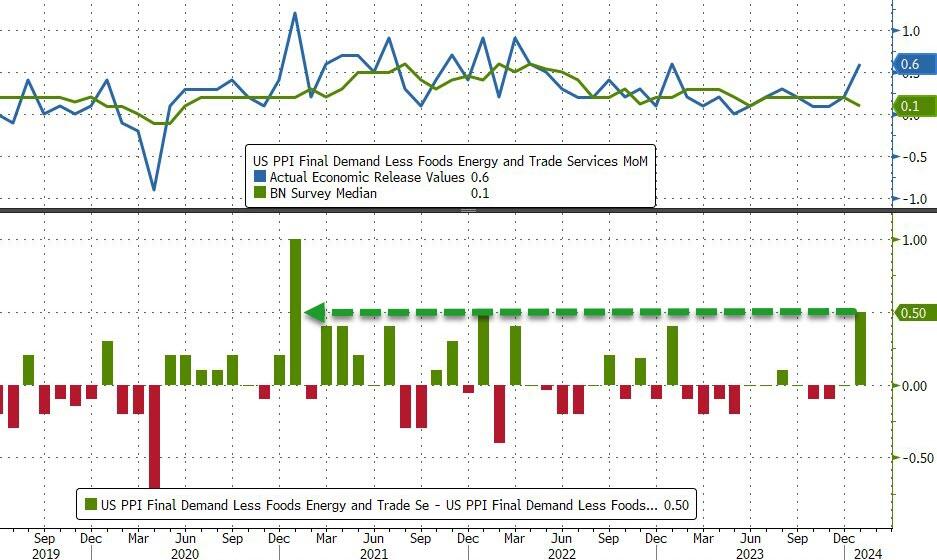
The picture was even worse under the hood with PPI ex food and energy up 0.5% MoM (vs +0.2% prior and +0.1% exp) and ex-food, energy, and trade up 0.6% MoM (vs +0.1% exp).
This was the biggest ‘beat’ for Core PPI since Jan 2021…

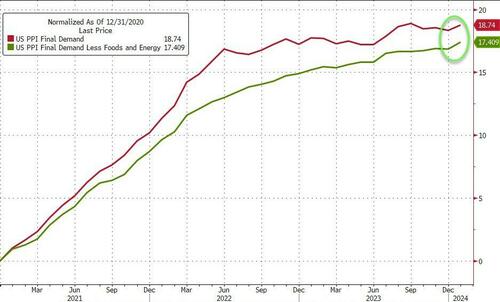
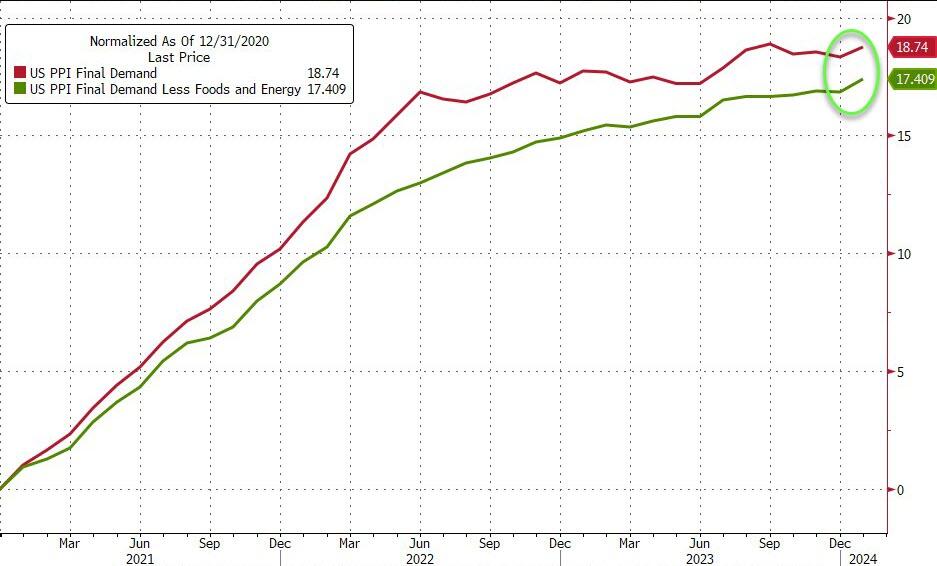
In fact, core PPI reached a new record high (reminder, disinflation does not mean lower prices), now up 17.4% since Biden was elected…
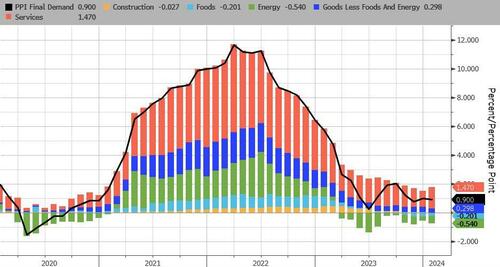
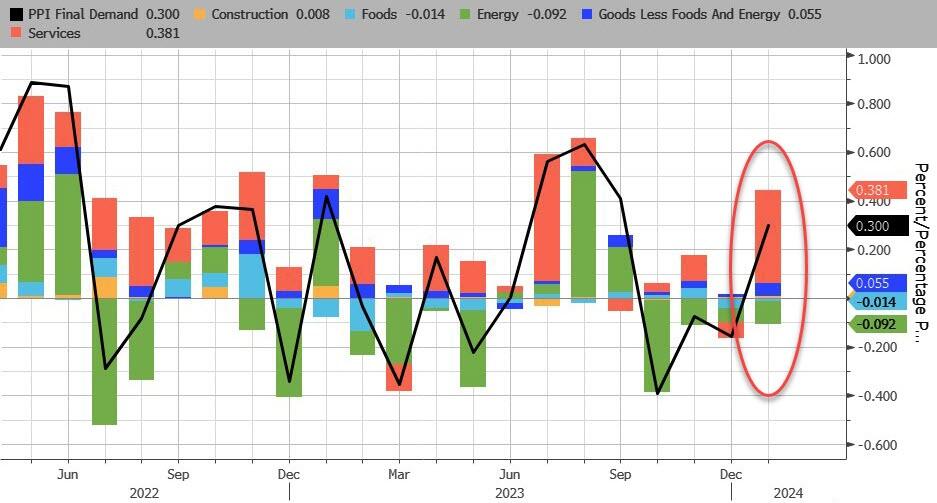
Services PPI soared MoM, and energy continues to be a driver of deflation (but is losing its power)…

And on a YoY basis, Services PPI is also re-accelerating (+1.47% from +1.14%). Energy continues to be the deflationary driver…
Source: Bloomuberg
This is not good news for the disinflationistas. And it will stop President Biden’s narrative that ‘prices are coming down’…
Looks like the US economy is back in red.


You must be logged in to post a comment.