The Conference Board’s Leading Indicator should be called The Bleeding Indicator given that the leading index has declined to 10 straight months. This is happening as The Fed tightens monetary policy to combat inflation.
Leading indicators include economic variables that tend to move before changes in the overall economy. These indicators give a sense of the future state of an economy.
Ah, the start of a new week with Treasury Secretary Janet Yellen arguing (with a straight face) that there is no room in the Federal budget for cuts. Apparenly, Yellen never read any of the massive, pork-laden spending bills signed by Biden (no one else did in Congress either, nor did Biden).
Let’s start with the US credit default swap (1 year). It remains high at 68.72 (the price of insuring against a US default). And the US Treasury yield curve (10Y-3M)? It remains deeply inverted at -114 basis points this morning signaling an impending US recession.
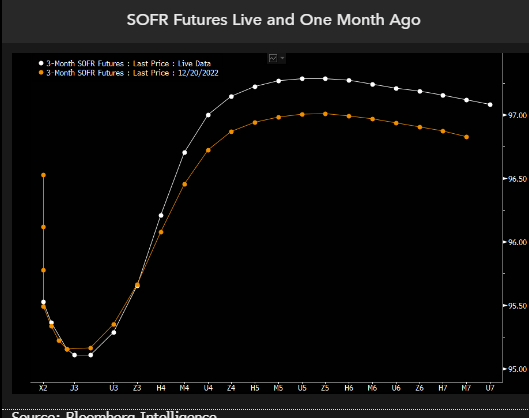
Then we have SOFR (Secured Overnight Financing Rate). SOFR futures are pricing for the Federal Reserve to hike rates a few more times and to start cutting before the end of this year. The pricing for the 2023 rate path is little changed from a month ago, but this year the market has priced in deeper cuts in 2024, with SOFR now seen below 3% by early 2025 before stabilizing. The implication is that hedging recession and significant rate cuts in 2024 now seems to be fully priced in, yet there’s a risk that the Fed cuts even deeper than the market is factoring in.
We think the market is partially preparing for the risk of even deeper rate cuts than linear instruments are pricing. To see how dramatic those are, we can look at options on SOFR futures and model what’s being priced by the volatility surface.
We are seeing the same story if we look at Fed Funds Futures data. Fed rate hikes until June, then rate cuts to follow.
How did Biden’s lawyers and now the DOJ figure out that Biden has classified documents all over the place? Probably from reading “The Hardy Boys.” Except that Biden didn’t cleverly hide classifed documents. Rather, he carelessly left them lying around at The Penn Biden Center and his home in Wilmington Delaware that he shared with his son, Hunter. And probably on the Amtrak train he would take from Wilmington to Union Station in DC. And probably at Chinatown Garden, a short walk from The White House.
Mortgage applications increased 27.9 percent from one week earlier, according to data from the Mortgage Bankers Association’s (MBA) Weekly Mortgage Applications Survey for the week ending January 13, 2023. But mortgage applications are 60% lower than the same week last year.
The Refinance Index increased 34 percent from the previous week and was 81 percent lower than the same week one year ago. The seasonally adjusted Purchase Index increased 25 percent from one week earlier. The unadjusted Purchase Index increased 32 percent compared with the previous week and was 35 percent lower than the same week one year ago.
Here are the stats.
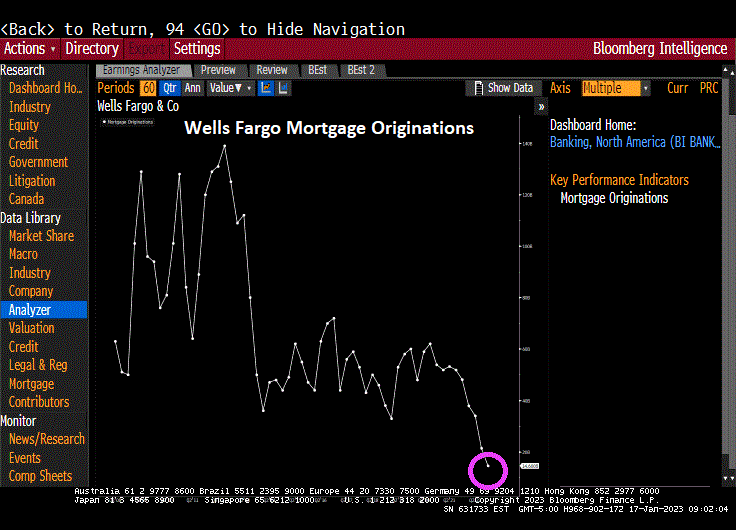
One lender in particular, Wells Fargo, smells blood in the economic waters, and has cut back mortgage originations.
Just remember, mortgage applications generally rise in the first part of the year until May, then start slowing until the last week of the year. This is called seasonality. But despite the fast growth this year, purchase applications are still down -35% compared to last year at this time.
We got trouble in Potomac City! No, I’m not talking about the numerous Top Secret documents that Biden carelessly left in his garage in Delaware and the UPenn Biden Center. And they found more over the weekend. I’m talking about the US Treasury 10Y-2Y yield curve being inverted for 135 straight days. And thanks to inflation, REAL wage growth has been negative for 21 straight months.
All this is happening while M2 Money growth (green line) stalls to 0% YoY.
Swaps 5Y are rising as The Fed withdraws monetary stimulus.
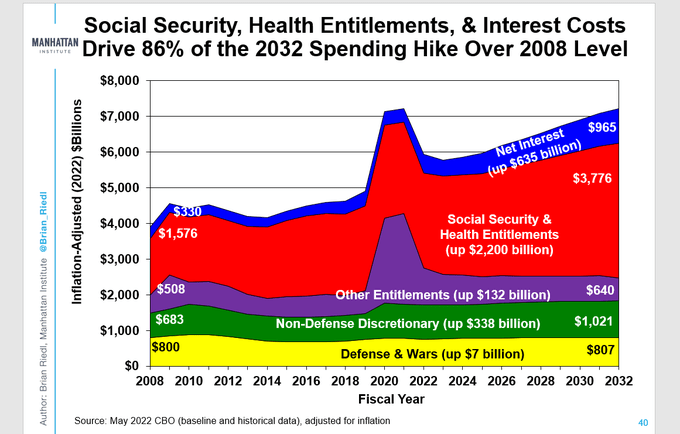
Newly-minted US House Speaker Kevin McCarthy faces a daunting task: trying to avoid a US debt default. As I have discussed many times before, nothing has been the same since the US housing bubble and near-collapse of the banking system that produced an expensive bailout of seemingly all financial institutions. After 2008, Federal spending has gone out of control. The budgetary hawks (or pigeons) in the US House of Representatives (with Pelosi, Boehner, Ryan then Pelosi again) went on Federal spending sprees of epic proportions.
The Manhattan Institute has a nice chart showing the explosion in the Federal budget since 2008. Of particular note, interest payments on the Federal debt has increased by a staggering 192%. On the non-interest spending front, Social Security and Health Entitlements have increased by 140% while Nondefense Discretionary Spending has increased 76%.
The massive increase in Federal debt interest is due to both increased Federal spending and rising interest rates thanks to The Federal Reserve raising rates to fight inflation.
But what will McCarthy and House Republicans recommend cuts in? Tighter restrictions on who qualifies for Social Security and particularly Social Security Disability payments?
The odd factoid is that Defense and Wars budget is up less than 1% from 2008 to 2032. So, Ukraine military aid is coming from somewhere, but not from the Defense budget. Is Ukraine another entitlement program?
Rest assured that after debate, the House will pass a budget and, provided that virtually nothing was cut, the Senate will gleefully agree to more spending and “Top Secret Documents” Biden will sign it.
After he parks his gorgeous Corvette Sting Ray, that is.
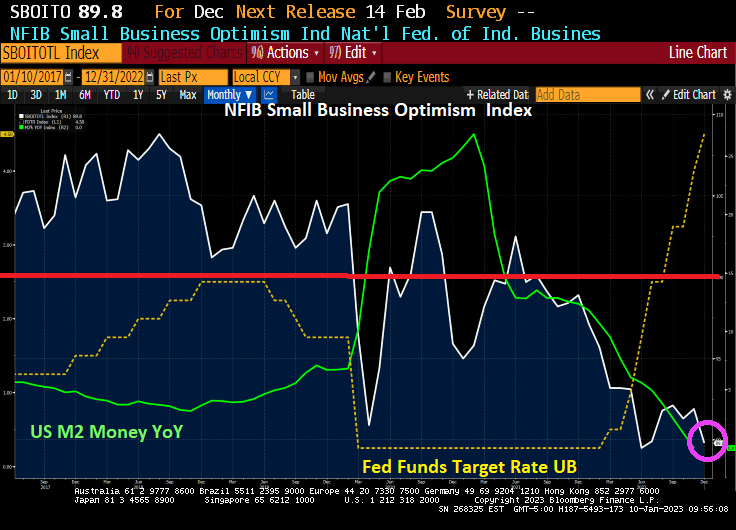
The NFIB Small Business Optimism Index is plunging and just fell below 90. The index was above 100 before the Wuhan virus outbreak in 2020, but has only been at 100 or above for only two months under Biden. And the trend is definitely looking bleak as The Federal Reserve fights inflation with M2 Money growth having collapsed to 0% YoY growth.
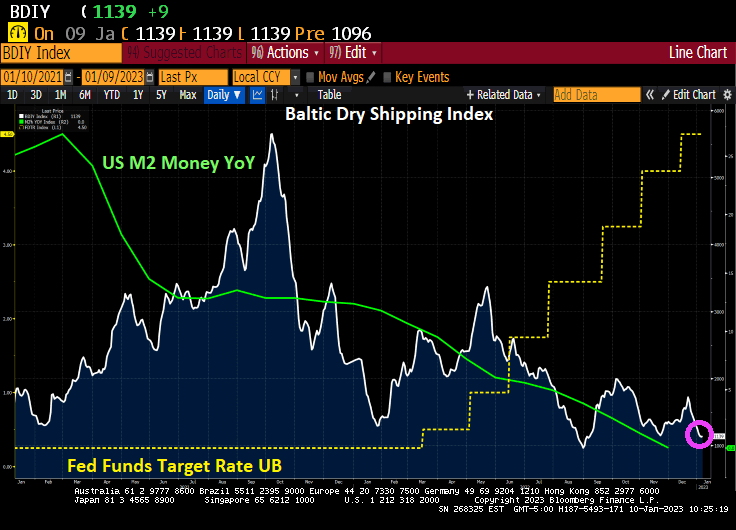
And the Baltic Dry shipping index is falling with M2 Money growth YoY.
I wonder what Fed Chair Jerome Powell is thinking?
The Federal Reserve will be the backstop of the Treasury market this year to alleviate dysfunction resulting from its increasing size and the retreat of regular buyers.
That’s the view of Credit Suisse Group AG analyst Zoltan Pozsar, who in a note to clients Friday predicted the Fed will restart asset purchases during the summer of 2023.
In Pozsar’s analysis, relative-value funds won’t buy Treasuries unless they cheapen a lot relative to overnight index swaps, and banks with sagging reserves are more likely to tap the funding markets than to buy Treasuries. FX-hedged buyers have been “priced out,” and geopolitical events have reduced large reserve managers’ appetite for US debt, he said.
Flagging demand from marginal buyers will depress demand for Treasury auctions, sparking selloffs in equities, credit and emerging markets, according to Pozsar.
“This is a ‘checkmate-like’ situation,” he wrote. “The Fed won’t be a pivot and the terminal rate may have to go higher still, neither of which augurs well for either risk assets or Treasuries.”
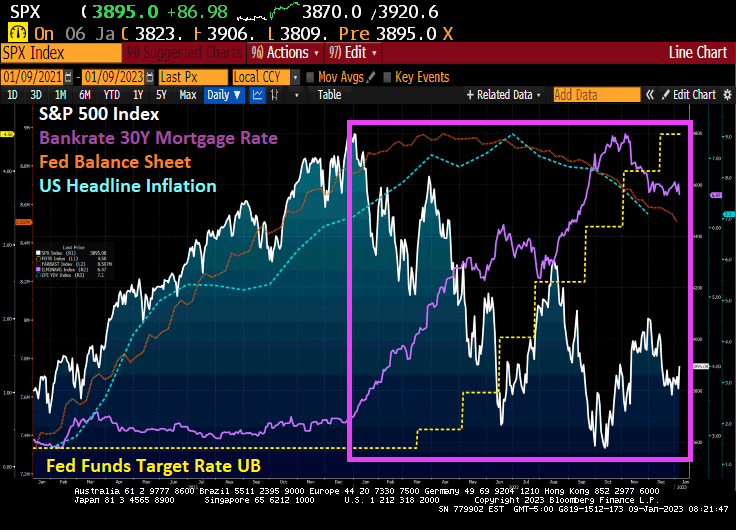
As The Fed started to raise rates (yellow line) to fight inflation (blue dashed line), the S&P 500 index started to fall. Note that The Fed’s balance sheet (purple line) is mirroring the inflation rate.
Fed Funds Futures point to Zoltan’s reversal in June 2023.
Will The Fed pivot? Zoltan says yes, the talking Fed heads say no.
Mortgage applications generally nosedive in the last two weeks of the year (seasonality effect), but Federal Reserce monetary tightening to fight inflation is making the last two weeks worse than usual.
Mortgage applications decreased 13.2 percent from two weeks earlier, according to data from the Mortgage Bankers Association’s (MBA) Weekly Mortgage Applications Survey for the week ending December 30, 2022. The results include adjustments to account for the holidays. It marked the lowest mortgage applications since 1996.
The Market Composite Index, a measure of mortgage loan application volume, decreased 13.2 percent on a seasonally adjusted basis from two weeks earlier. On an unadjusted basis, the Index decreased 39.4 percent compared with the two weeks ago. The holiday adjusted Refinance Index decreased 16.3 percent from the two weeks ago (2WoW) and was 87 percent lower than the same week one year ago (YoY). The seasonally adjusted Purchase Index decreased 12.2 percent from two weeks earlier. The unadjusted Purchase Index decreased 38.5 percent compared with the two weeks ago and was 42 percent lower than the same week one year ago.
Notice that purchase applications are declining with slowing M2 Money growth showing the impact of The Fed trying to remove the punchbowl.
The week-over-week (or WoW) numbers are pretty bad.
First, banks are stashing cash with the New York Fed on an “overnight basis” although it is looking pretty permanent to me. Repos (or repuchase agreements) soared to $2.55 TRILLION as of 12/30/22.
But this morning we see the US Treasury 10-year plummeting -15 basis points. As I used to tell my University of Chicago, Ohio State and George Mason finance students, any 10 basis point shift (plus or minus) is a big deal. Something is happening.
The 10-year Treasury yield plunging -15 bps is a “good thing” for the mortgage market in that US mortgage rates will likely follow suit and fall.
As we begin 2023 (and I am still bummed-out over Ohio State University losing a nail-bitter to Georgia in the Peach Bowl), we need to look at the condition of one of the most important sectors of the US economy.\, housing.
If we look at the US Housing Leading Growth index (courtesy of RecessionAlert.com) has slumped to its worst reading since the recessions of 1982 and 2008.
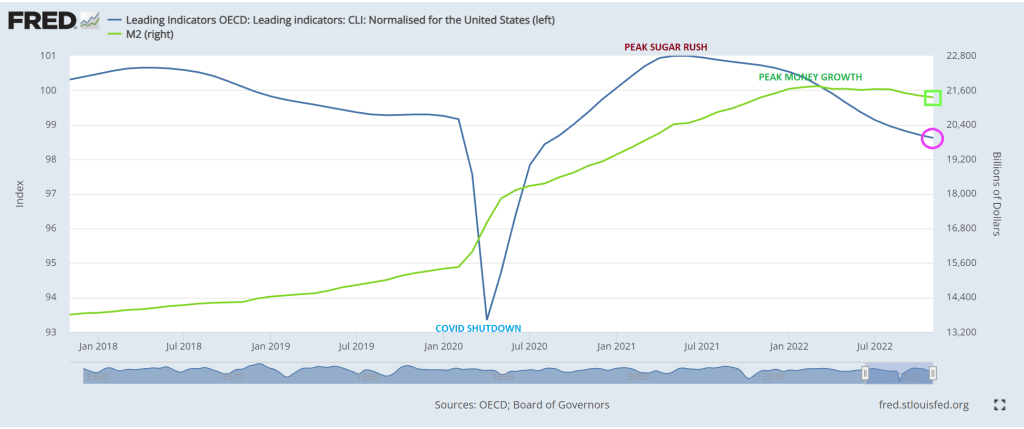
And then we have the OCED leading indicators for the US falling as M2 Money growth slows.
My favorite chart shows US home price growth falling faster than University of Michigan football team’s national championship home hopes.
Will this prompt The Federal Reserve to pivot? Only time will tell.


You must be logged in to post a comment.