Will The Fed keep on printing?
Under Joe Biden, The Federal Reserve has jacked-up M2 Money by 12.2%. And with the fear of economic destruction under Biden, Bitcoin is up 265%.
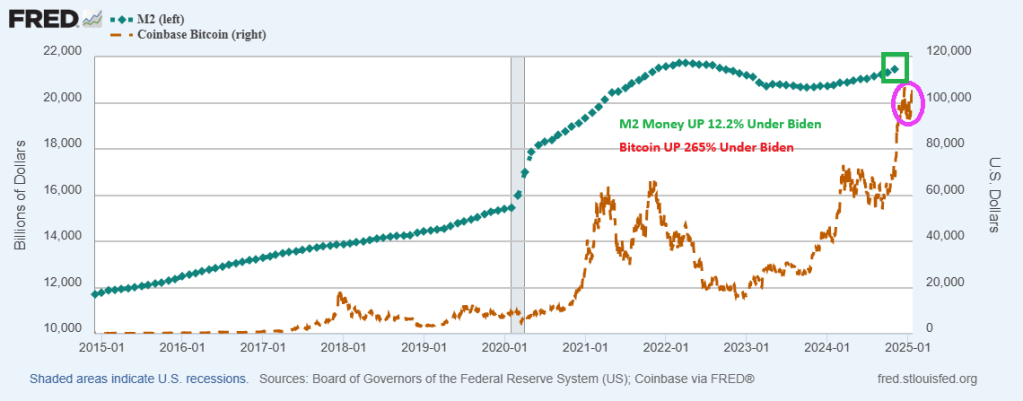
With Trump being sworn in, That’s all, folks!

Confounded Interest – Anthony B. Sanders
Financial Markets And Real Estate
Will The Fed keep on printing?
Under Joe Biden, The Federal Reserve has jacked-up M2 Money by 12.2%. And with the fear of economic destruction under Biden, Bitcoin is up 265%.
With Trump being sworn in, That’s all, folks!
Some cities in the USA are simply unaffordable.
The Visual Capitalist calls most unaffordable cities as least affordable. San Jose California and New York City are the two most unaffordable cities in the USA. According to household spending.

On the flip side of the affordability coin is … Detroit Michigan and Cleveland Ohio. Followed closely by Dayton Ohio and El Paso Texas.
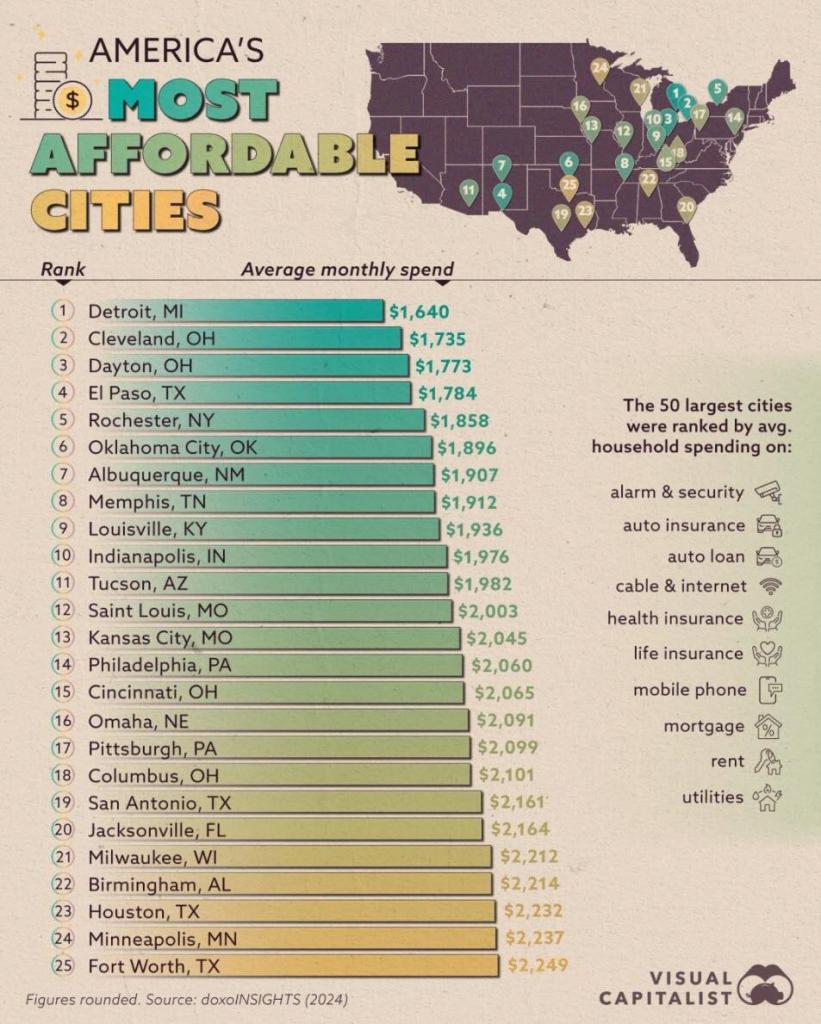
Fortunately, I live in Columbus Ohio. the 18th most affordable city in the USA.
Much of the difference amongst cities is land use and construction restraints. And booming/dying local economies.
As a sad reminder about the last four years, Pete Buttigieg will leave his post as Transportation Secretary having spent $7.5 BILLION to build 8 EV charging stations.

I can’t wait for Billions Biden, The DC parasite who selectively shoves billions of dollars to his friends and nothing for the others. For example, bailing out the LA wildfires but stiffing the people of North Carolina and Florida for hurricane/flood damage. And funding Ukraine while real wage growth is negative. And heavy investment in green energy, the ultimate fool’s errand.
Let’s start with declining real wage growth under Biden/Harris (blue line). Meanwhile, Federal government spending (dashed green line) continues to grow causing inflation.
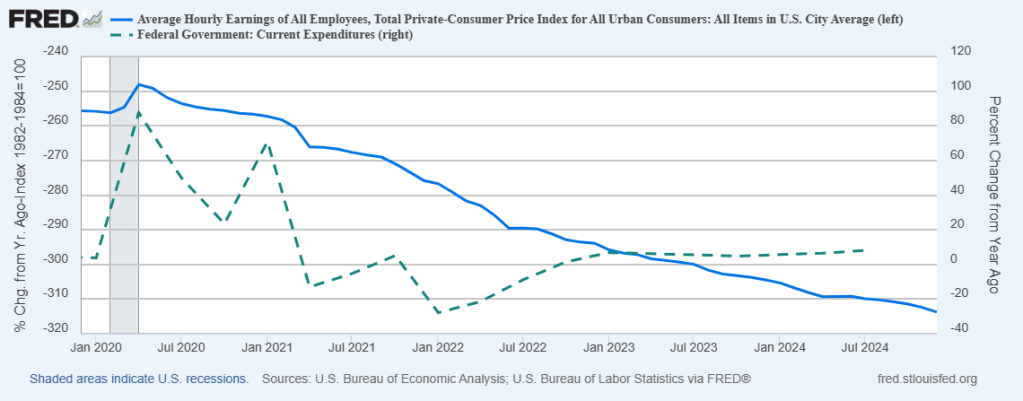
Meanwhile, Biden/Harris and Congress left Trump with the largest budget deficit in history. Like endlessly funding Ukraine and illegal immigration.
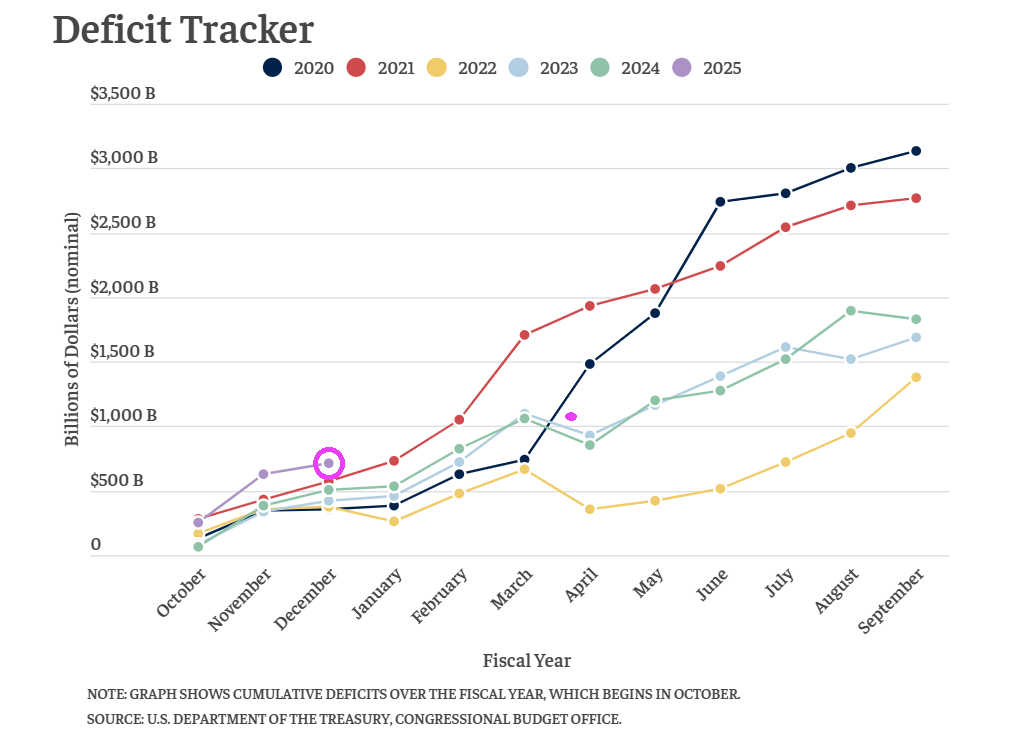
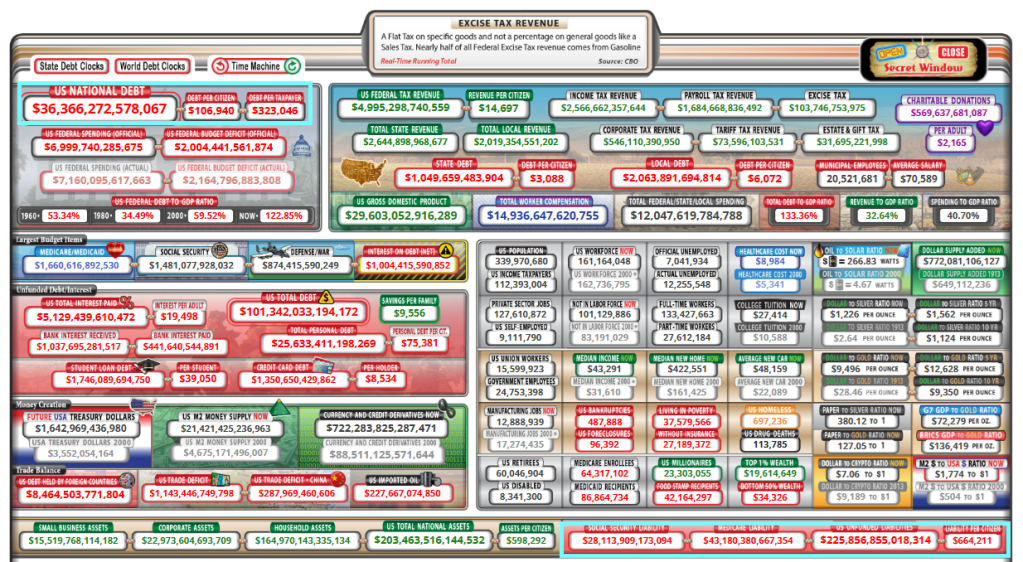
Leaving American taxpayers with growing Federal debt of $36+ trillion. And unfunded liabilities of $226 trillion, over 6 times the national debt.
The US will hit its debt ceiling the day after President Trump is inaugurated, and Yellen said that the Treasury will launch “extraordinary measures” to stave off the threat of a national default. Bear in mind, Janet Yellen personally oversaw total debt increase by a staggering $15 trillion. Way to go, Janet!
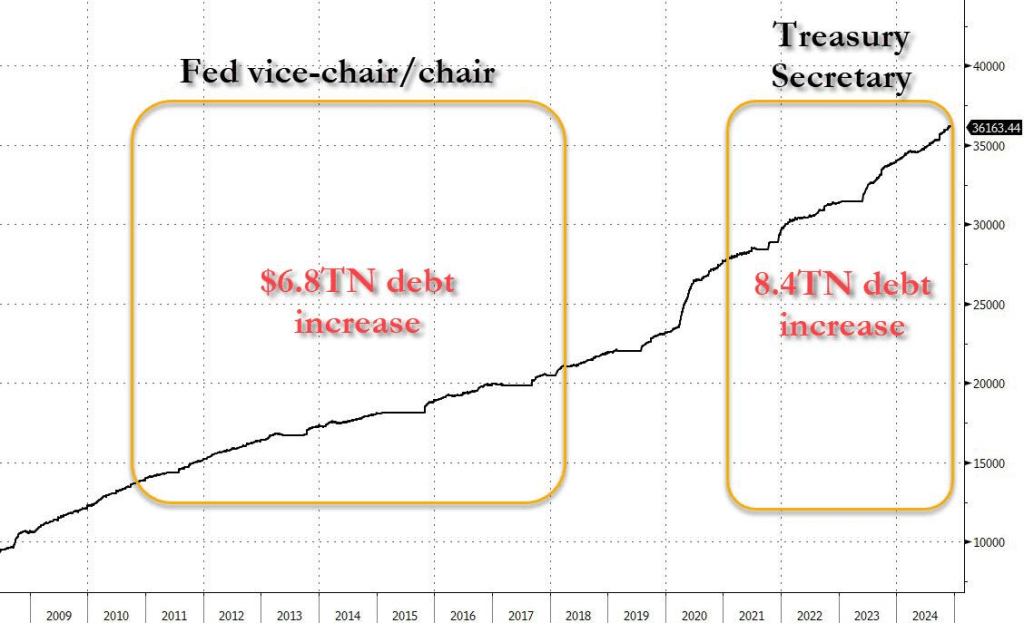
I wonder how Trump’s Treasury secretary will handle this? At least better than Janet Yellen, I hope!


Mortgage applications decreased 3.7 percent from one week earlier, according to data from the Mortgage Bankers Association’s (MBA) Weekly Mortgage Applications Survey for the week ending January 3, 2025. This week’s results include an adjustment for the New Year’s holiday.
The Market Composite Index, a measure of mortgage loan application volume, decreased 3.7 percent on a seasonally adjusted basis from one week earlier. On an unadjusted basis, the Index increased 47 percent compared with the previous week. The seasonally adjusted Purchase Index decreased 7 percent from one week earlier. The unadjusted Purchase Index increased 43 percent compared with the previous week and was 15 percent lower than the same week one year ago.
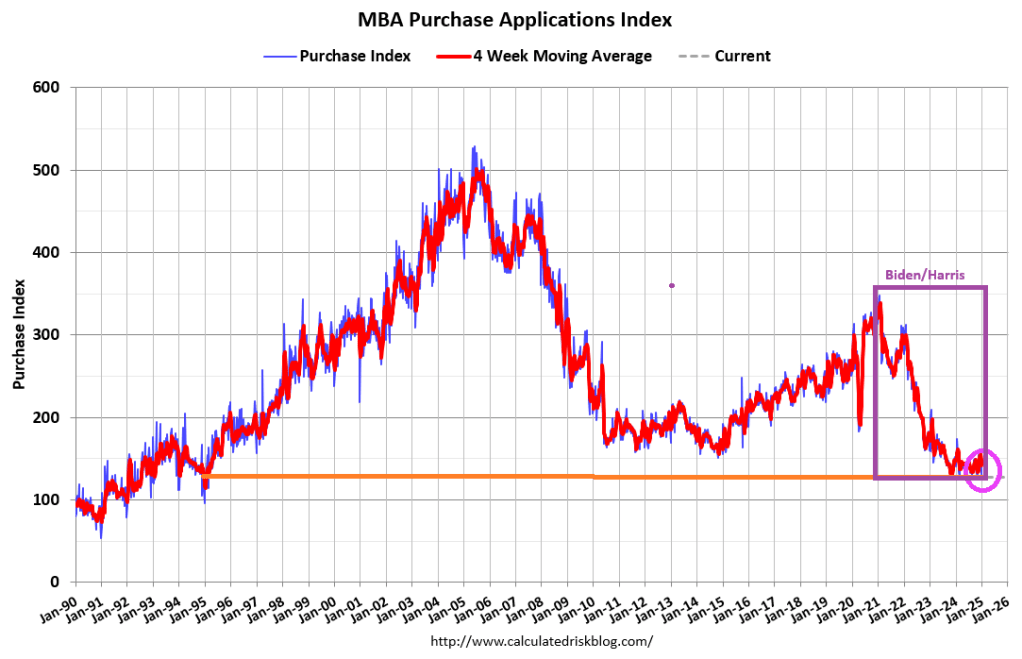
Purchase application activity is up about 2% from the lows in late October 2023 and is now 15% below the lowest levels during the housing bust.
The Refinance Index increased 2 percent from the previous week and was 6 percent lower than the same week one year ago.

Then we have this diddy from The Epoch Times where a mortgage company allegedly provided a loan to a household that had 33 debts in collection. Hey, I thought under Senator Elizabeth Warren’s brainchild these reckless lending practices were over!
One will be gone on January 20 and I wish the other one would be gone too.
Was Freddie King correct? Is the US economy going down??
The US Treasury yield curve (10Y-2Y) has inverted to the positive side after a prolonged NEGATIVE inversion (from July 6, 2022 to Sept 5, 2024) marking the longest period of negative inversion since August 18, 1978 – May 1, 1980. Each negative inversion was followed by a recession.

The UST 10Y-3M yield curve tells a similar tale. The 10Y-3M curve inverts prior to recessions but goes positive just prior to recessions.

Yes, if the yield curve is a good predictor of recession, the US economy is going down.

Freddie King is playing a Gibson ES-355TDC guitar.
We are all riders on the Biden housing storm.
Existing-home sales have finally started to improve on a seasonally adjusted basis after a three-year decline.

Cause? Raging home prices combined with higher than normal mortgage rates. Home prices are up 35.4% under Biden while conforming 30Y mortgage rates are up 148%.


US home prices surged to the 17th consecutive all-time high.
US home prices in the 20 largest cities rose 0.32% MoM in October (the latest data from S&P CoreLogic Case-Shiller), considerably hotter than the 0.22% rise expected. However, despite the MoM beat, the pace of annual acceleration has declined to its slowest since Sept 2023. At 3.62% YoY.


Which metro area had the highest gain? New York City at 7.27%. The lowest gain? Tampa at 0.39%.

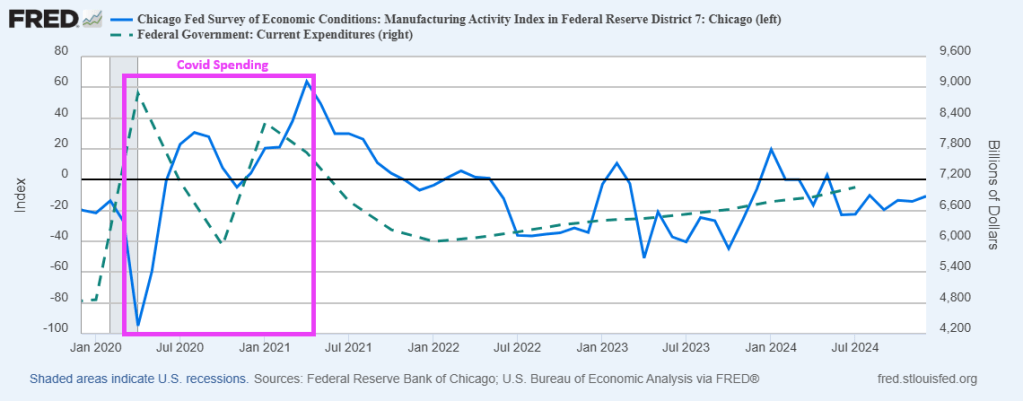
Sweet home Chicago … NOT!
The Biden/Harris economic “miracle” was simply massive Federal spending (and borrowing) combined with hiring Federal workers. This can be seen in the following chart of Chicago Fed manufacturing index compared with Federal spending. Great times in the first months of 2021, but as Federal spending slowed, so did the manufacturing index. Last seen at -10.71 in December 2024.
Joe Biden, sold his soul for family wealth at the crossroads in Delaware.

The US taxpayer has suffered a double whammy under The Federal government. First, thanks to the Federal Reserve, the purchasing power of the US Dollar has fallen 97% since the creation of The Federal Reserve in 1913 (under Woody Wilson).

The second leg of the double whammy is the staggering $36 TRILLION is public debt, up from $321 million in 1966. That is a remarkable increase, most of it happening under Obama/Biden then Biden/Harris or 188% since Biden/Harris. Yes, Trump is sanwiched in between Obama and Biden for a scant 4 years.
While we love to blame Presidents, it is really the fault of Congress since The House controls the budget. And The Federal Reserve.
Double whammy!


Apparently, the late Hawaiian crooner Don Ho foresaw Biden’s irresponsible spending spree. That is, BIG BUBBLES.
Let’s start with the Buffett Indicator (Warren, not Jimmy!). It indicates that the stock market is STRONGLY OVERVALUED.

The S&P 500 Mean Reversion Model also shows the stock market to be STRONGLY OVERVALUED.

How about the Shiller P/E Ratio? Also showing strong overvaluation.

House prices under Biden have exploded partly due to the outrageous Federal spending following COVID.

The Feral Reserve also had a hand in the housing bubble. While mortgage rates remain high (relative to the Trump years), The Fed’s balance sheet remains elevated.

To be sure, some Republicans were complicit in the spending spree. But mostly it was Democrats and the Biden/Harris Administration … which is still doling out millions.


You must be logged in to post a comment.