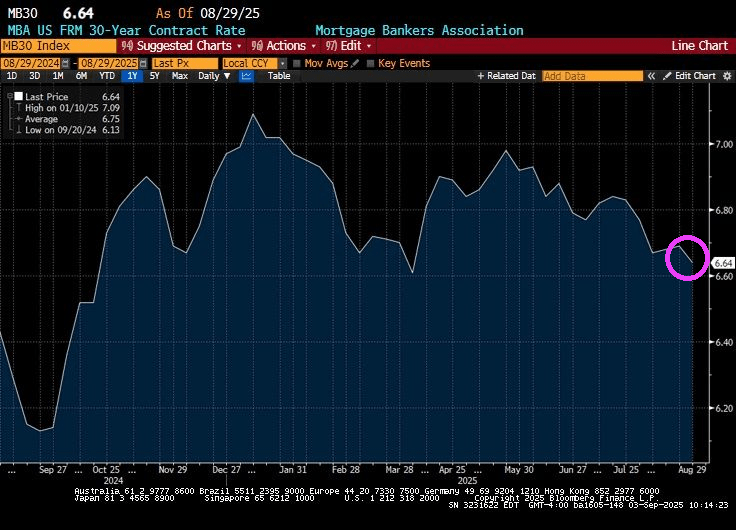
The good news? The US 30-year mortgage rate fell slightly to 6.64%.
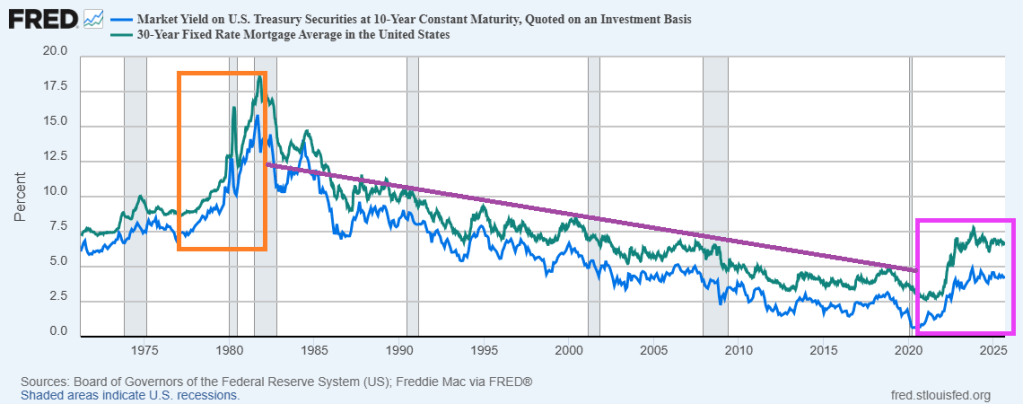
The bad news? It seems to be a milder repeat of the Ford/Carter years of the late 1970s/early 1980s. Rising 10-year Treasury yields and 30-year mortgage rates during the Ford/Carter years … and early Reagan years. The difference? The Federal Reserve is fundamentally different today than previously. With Bernanke/Yellen, The Fed became more “activist” (like Obama/Biden-appoointed District Judges). Powell is returning to the Yellen model of Fed activism … not doing much.
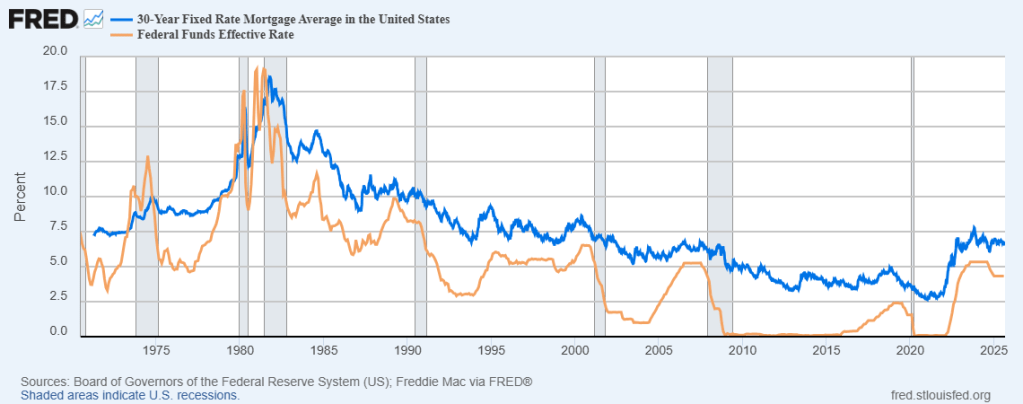
Now the market awaits a rate cut from The Fed at the next FOMC meeting. But 30-year mortgage rates are most closely related to the 10-year Treasury yield than the short-term Fed Funds rate. Theoretically, The Fed could cut their target rate by 25 basis points and mortgage rates could be uneffected. Or even rise.
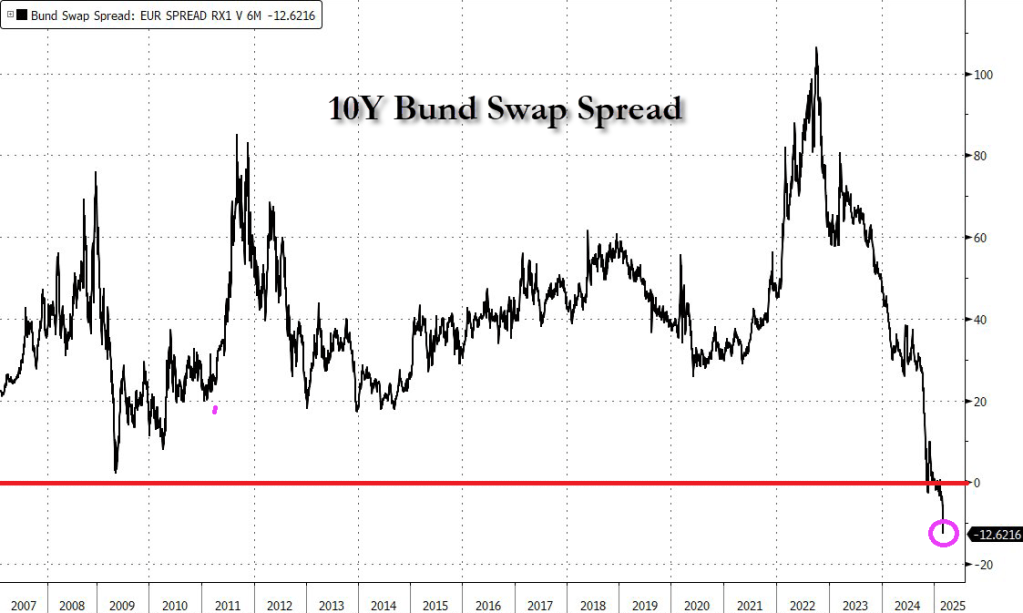
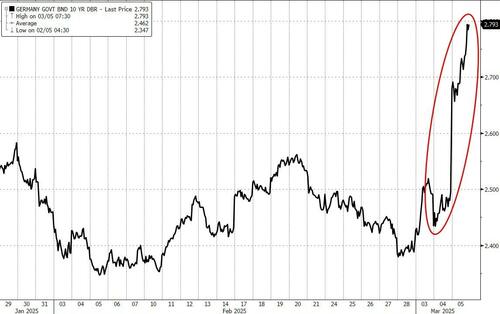
German 10-year bond yields are trading above euro interest rate swaps for the first time in history (-12.62), a watershed moment for these markets that underlines just how much investors have soured on government debt.
Bund yields +30bps today – the biggest spike on record going back to 1990.
Sales of existing single-family houses, townhouses, condos, and co-ops that closed in January dropped by 4.9% from December, seasonally adjusted, to an annual rate of 4.08 million sales, according to the National Association of Realtors today.
This rate of sales was up just 2.0% from the abysmally low levels a year ago – 2024 as a whole had been the worst sales year since 1995 – and flat with the abysmally low levels two years ago.
Compared to January 2021, the sales rate was down by 36%, compared to January 2019, the sales rate was down by 25%
On a NON seasonally adjusted basis, things look even more grim.
Active inventory is up 27.6% YoY. As mortgage rates are projected to rise, things can get worse.
Mortgage rates continue to hover around 7%. Mortgage rates rose 164% under Biden!
Maybe if Fed Chair Jerome Powell is forced to wear Sky Saxon of The Seed’s wizard outfit, he will improve his policies.
I call this the house latitudes. Horse latitudes is a belt of calm air and sea occurring in both the northern and southern hemispheres between the trade winds and the westerlies. And when the ships motion stalled, the crews would jetison their cargo of horses to the delight of sharks! So, we are in state of HOUSE latitudes where the wind pushing mortgage refis and purchase apps. So we are all riders on the storm.
Mortgage applications decreased 6.6 percent from one week earlier, according to data from the Mortgage Bankers Association’s (MBA) Weekly Mortgage Applications Survey for the week ending February 14, 2025.
The Market Composite Index, a measure of mortgage loan application volume, decreased 6.6 percent on a seasonally adjusted basis from one week earlier. On an unadjusted basis, the Index decreased 4 percent compared with the previous week. The seasonally adjusted Purchase Index decreased 6 percent from one week earlier. The unadjusted Purchase Index decreased 1 percent compared with the previous week and was 7 percent higher than the same week one year ago.
The Refinance Index decreased 7 percent from the previous week and was 39 percent higher than the same week one year ago.
Privately-owned housing starts in January were at a seasonally adjusted annual rate of 1,366,000. This is 9.8 percent below the revised December estimate of 1,515,000 and is 0.7 percent below the January 2024 rate of 1,376,000. Single-family housing starts in January were at a rate of 993,000; this is 8.4 percent below the revised December figure of 1,084,000. The January rate for units in buildings with five units or more was 355,000.
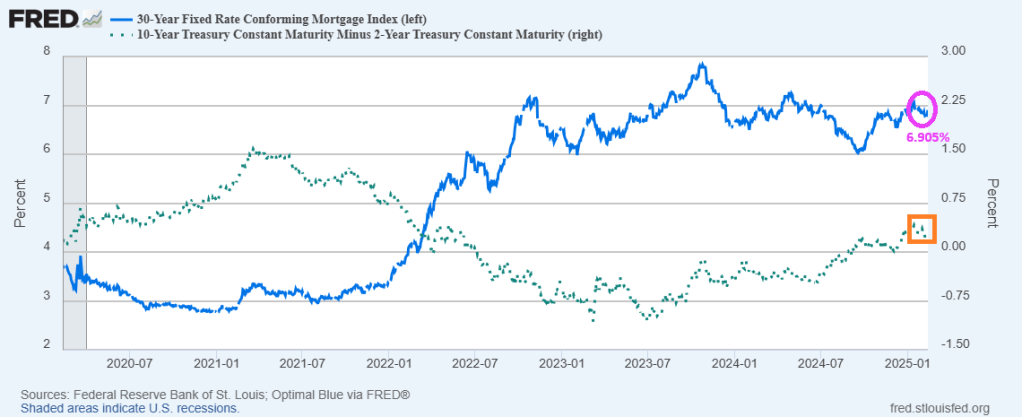
The conforming 30-year fixed mortgage rate is hovering just below 7%.
Note that on the left=hand side of the above chart that the US Treasury yield curve slope (green dashed line) hit its local high as Joe Biden became President, then began to decline as the insane spending ensued. Mortgage rates started to rise in 2022 as the yield curve slope declined.
But will the yield curve continue to fall along with mortgage rates? I hope not, because it would require to Biden’s insane spending.
Speakig of killers, DNA tests revealed that Aaron Kosminski, a Polishbarber was the murderer known as Jack The Ripper. Although Janet Yellen was my leading suspect.
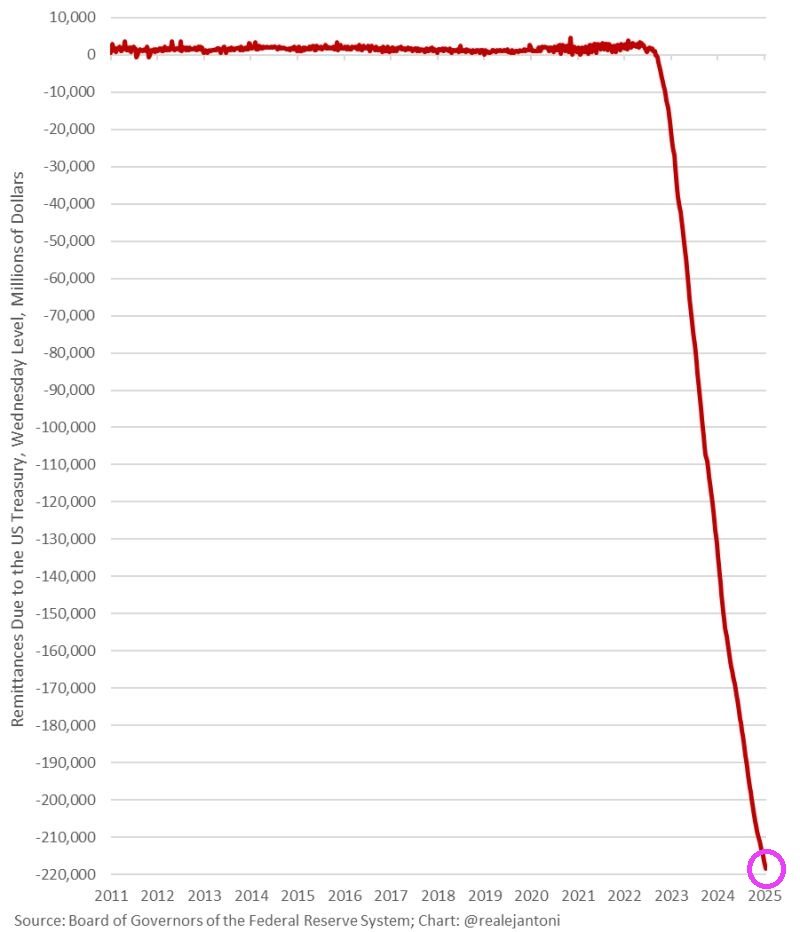
The Federal Reserve (aka, The Green Slime) represents the Spirit of Washington DC. A glutenous pig spending trillions it doesn’t have on insane policies. And The Fed ends up funding the insane spending and racking up massive losses.
Trump is inheriting a Federal Reserve w/ not only unprecedented losses of $218 billion, but it’s still losing money; the Fed won’t send the Treasury a dime for the entirety of Trump’s term; that’s never happened since the inception of the Fed – another challenge for Trump.
A recent paper by Michael Stegman, Ted Tozer and Richard Green reminds me of The Who’s song “Won’t Get Fooled Again.” Except that apparently Stegman, Tozer and Green did get fooled again.
I remember testifying in the House of Representatives in Washington DC on the financial crisis and housing markets. I pointed out that low down payment mortgages lending to households with low credit scores was very dangerous. I had the data and presented it to the House committee on financial services.
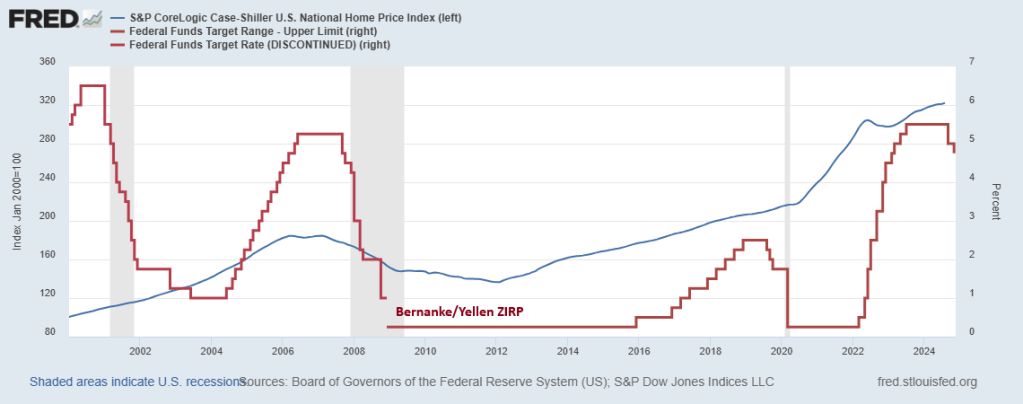
The problem with Stegman et al’s paper is that it ignores The Federal Reserve and Federal spending. After the financial crisis of 2008 when housing prices declined (especially in bubble states like Arizona, Nevada and Florida), Berananke and Yellen adopted a zero interest rate policy that resulted in housing prices rising again. Then we have Powell’s lowering of rates to near-zero following the Covid outbreak and the insane level of Federal spending that ensued helping to drive housing prices to dangerous bubble levels. Making first time homeowner purchases almost impossible.
So, like the 2000s, the pursuit of homeownership will lead to insance policy proposals. If nothing else, the Stegman et al proposal will lead to MORE inflation in housing prices and set the stage for a housing bubble burst of epic proportions.
Apparently, Stegman et al DID get fooled again. Or they just don’t care.
There is one way out of the inflation trap. And it’s drill, baby, drill!
For the 53rd straight month, core consumer prices rose on a MoM basis in October with the YoY pace re-accelerating to +3.33%.
The shelter index increased 4.9 percent over the last year, accounting for over 65 percent of the total 12-month increase in the all items less food and energy index.
Thank goodness Harris can’t try to impliment her ridiculous plans to boost housing!
Glad to see Vivek Ramaswamy and Elon Musk (the NEW Two Bobs from Office Space) cleaning up the mess in Washington DC.
The US Treasury yield curve (10Y-2Y CMT) went negative on April 1, 2024. And remains positive.
The US Treasury 10Y-2Y CMT (constant maturity Treasury) peaked locally on March 29, 2024 and then fell, eventually turning negative on April 1, 2024. And remained negative until August 30, 2024 just prior to the election. It looks like the yield curve accurately predicted the election of Trump.
The 10-year Treasury yield is rising with a positive economic outlook under Trump. And with that optimism we see mortgage rates rising too.
The US is the expensive tower of power … but it should be cheap. Getting rid of coal power was idiotic and The Left’s fear of nuclear power is laughable.
Europe’s fertilizer plants, steel mills, and chemical manufacturers were the first to succumb. Massive paper mills, soybean processors, and electronics factories in Asia went dark. Now soaring natural gas and electricity prices are starting to hit the US industrial complex.
On June 22, 600 workers at the second-largest aluminum mill in America, accounting for 20% of US supply, learned they were losing their jobs because the plant can’t afford an electricity tab that’s tripled in a matter of months. Century Aluminum Co. says it’ll idle the Hawesville, Kentucky, mill for as long as a year, taking out the biggest of its three US sites. A shutdown like this can take a month as workers carefully swirl the molten metal into storage so it doesn’t solidify in pipes and vessels and turn the entire facility into a useless brick. Restarting takes another six to nine months. For this reason, owners don’t halt operations unless they’ve exhausted all other options.
At least two steel mills have begun suspending some operations to cut energy costs, according to one industry executive, who asked not to be identified because the information isn’t public. In May, a group of factories across the US Midwest warned federal energy regulators that some were on the verge of closing for the summer or longer because of what they described as “unjust and unreasonable” electricity costs. They asked to be wholly absolved of some power fees—a request that, if granted, would be unprecedented.
Michael Harris, whose firm Unified Energy Services LLC buys fuel for industrial clients, says costs have risen so high that some are having to put millions of dollars of credit on the line to secure power and gas contracts. “That can be devastating for a corporation,’’ he says. “I don’t see any scenario, absent explosions at US LNG facilities’’ that trap supplies at home, in which gas prices are headed lower in the long term.
EIA Average Electricity Cost Cents
EIA cost data chart by Mish
EIA Cost Data January 2021 vs May 2022
Residential: 12.69 to 14.92
Commercial: 10.31 to 12.14
Industrial: 6.39 to 8.35
Transportation: 9.61 to 10.79
All: 10.36 to 12.09
Those prices are through May 2022. Much electrical energy comes from natural gas.
US Natural Gas Futures
US Natural Gas Futures courtesy of Trading Economics
US gas prices fluctuated wildly in June and July. I suspect the average price is 7.33 or so for both months. Things are decidedly worse in Europe.
EU Natural Gas Price
US Natural Gas Futures courtesy of Trading Economics
From 25 or even 50 to 200 is one hell of a leap. It’s somewhere between 300% and 700% depending on your starting point vs 100% or so for the US.
Let’s now check the latest PPI data for a look at where things are and more importantly headed.
PPI Electrical Power Index 2020-Present
PPI data from the BLS, chart by Mish
From pre-pandemic to January of 2021, the PPI electrical power index was flat. It has since surged on a relatively steady pace.
From May to July the index went from 231 to 238. That tacks on another three percentage points since the EIA report.
PPI Electrical Power Index 1991-Present
PPI data from the BLS, chart by Mish
Long Term Trend
The long-term trend does not exactly look pretty.
And as Bloomberg noted, Century Aluminum Co. says it’ll idle the Hawesville, Kentucky, mill for as long as a year, taking out the biggest of its three US sites.
The beer industry uses more than 41 billion aluminum cans annually, according to a Beer Institute letter to the White House dated July 1.
“These tariffs reverberate throughout the supply chain, raising production costs for aluminum end-users and ultimately impacting consumer prices,” according to the letter signed by the CEOs of Anheuser-Busch, Molson Coors, Constellation Brands Inc.’s beer division, and Heineken USA.
This letter to the president comes amid the worst inflation in more than 40 years and just months after aluminum touched a multi-decade high. Prices for the metal have since eased significantly.
Whatever victory beer makers and drinkers may have with aluminum prices may not last with US aluminum plants shutting down.
Then again, the cure for everything is likely to be a huge recession.
Zero Consumer Inflation
I am pleased to report there was no consumer inflation in July.
The CPI report resulted in a nonsensical Twitter debate on the meaning of zero. For the record, assuming you believe the numbers, there was indeed zero inflation month-over-month.
The accurate rebuttal is: One month? So what?
Moreover, zero is not as good as it looks. All of it was due to a 7.7 percent decline in the price of gasoline. And year-over-year inflation was a hot 8.5 percent.
Meanwhile, rent and food keep rising and the price of rent will be sticky. Gasoline is more dependent on recession and global supply chains.
The above reports and this one industrial costs puts a spotlight on the silliness of the Fed’s focus on consumer inflation as if that’s all that matters.
The Fed has blown three consecutive bubbles trying to produce two percent consumer inflation while openly promoting raging bubbles in assets and missing the boat entirely on industrial matters.


You must be logged in to post a comment.