Has The Federal Reserve lost control of the economy? And inflation? The answer is likely yes. Why?
The Covid crisis has been played by the Federal government as an excuse for insane levels for spending coupled with massive monetary stimulus from The Federal Reserve.
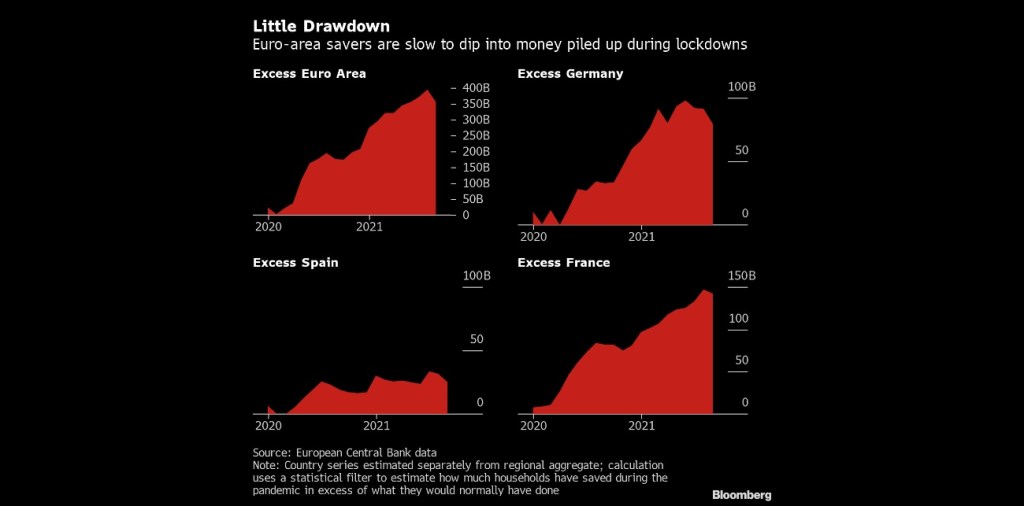
As an example of The Fed losing control is US savings. The Fed’s model is to drive savers into consumption, therefore raising production and increasing GDP growth. But alas, The Fed can’t overcome the fear faced by consumers with Covid, Covid shutdowns, and rapidly rising prices.
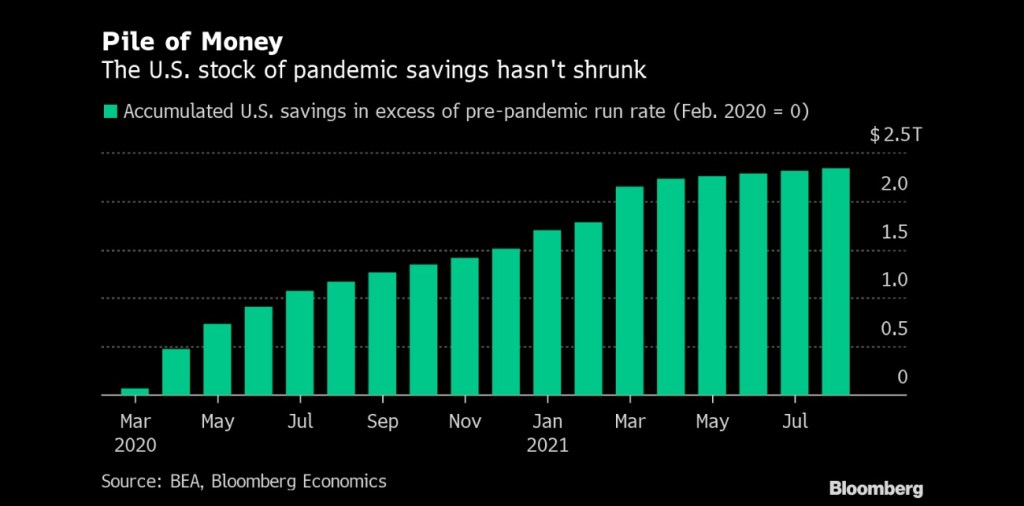
(Bloomberg) — Consumers in Europe and the U.S. aren’t rushing to spend more than $2.7 trillion in savings socked away during the pandemic, dashing hopes for a consumption-fueled boost to economic growth on both sides of the Atlantic.
In the wake of lockdown easing during the northern hemisphere’s summer holiday season, excess savings in euro-area bank balances declined only marginally in August, and Italy still recorded an increase, according to calculations by Bloomberg Economics. In the U.S. there has also been no drawdown, the figures show.
The absence of a consumption surge that had been anticipated by some economists may speak against the prospect of a lasting inflation shock feared by central banks. While higher balances could help households cope with skyrocketing heating bills, tepid demand might temper businesses’ ability to push through permanent price increases.
In the USA, we see accumulated savings despite near-zero deposit rates at banks.
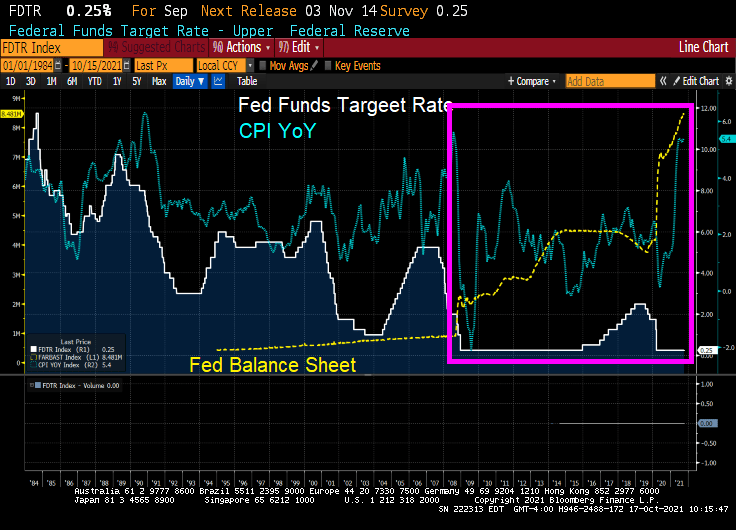
To be sure, The Fed reacted (or overreacted) to the Covid outbreak by increasing the money supply and their purchase of Treasuries and Agency MBS as the Federal government went on a wild spending spree.
But with trillions in Stimulypto Federal spending and Fed money printing, the bottlenecks in the economy (which apparently weren’t known before … ) have contributed to massive price increases that aren’t going away any time soon.
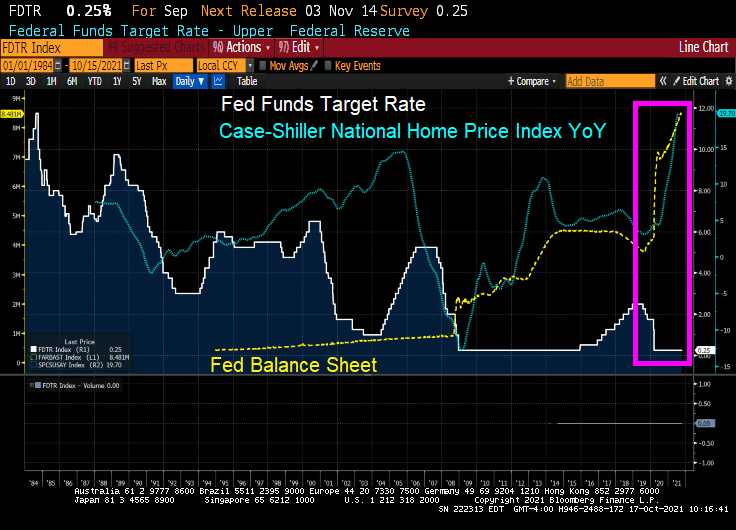
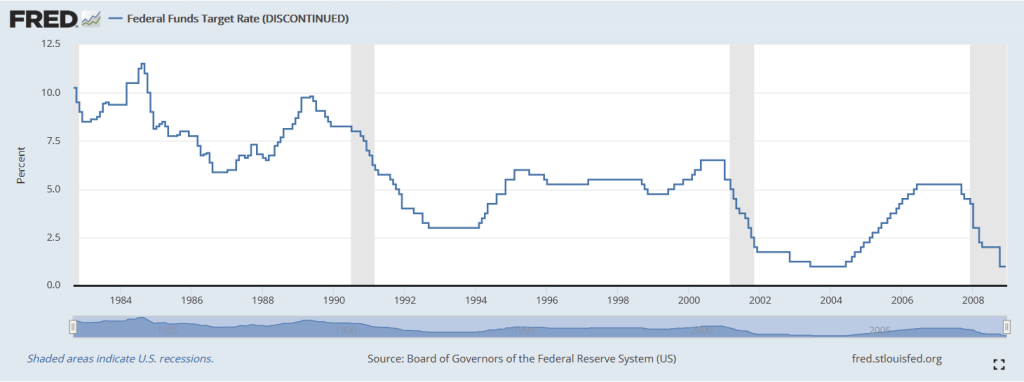
Notice how Fed monetary policies changed after the housing bubble burst and ensuring financial crisis/Great Recession. Before 2008, The Fed periodically whipsawed their Fed Funds target rate. But since late 2008, we have seen hardly any move from The Fed (except for 2017-2020 while Trump was President). For Obama,
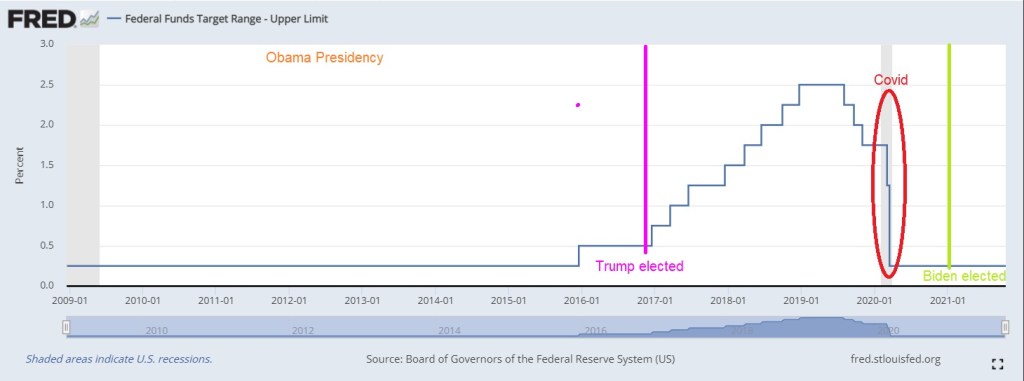
Here is a look at The Fed’s record under Obama, Trump and Biden. The Fed raised their target rate only once under Obama until Trump was elected. Then The Fed raised rates 8 times. Then began lowering them again (5 times) leading to a big drop when Covid stuck. So for Trump, The Fed changed their target rate 13 times compared to 1 rate change under Obama and none under Biden.
And the above chart is only The Fed’s target rate. My point is that Yellen failing to raise rates under Obama has resulted in this over DC-Stimulypto we are seeing today.
Note the difference in Fed policies BEFORE the financial crisis. We need to return to a normal Fed policy rather than the hyper-inflationary zero-rate, QE policies since 2008.
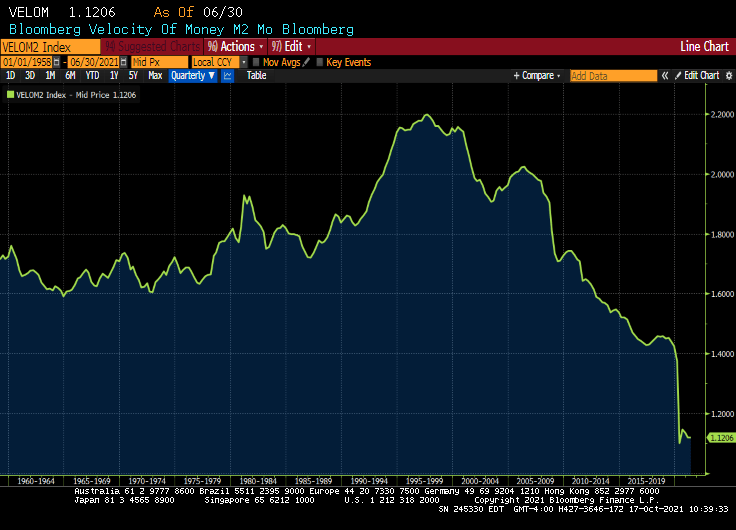
M2 Money velocity (GDP/M2 Money) remains near an all-time low.
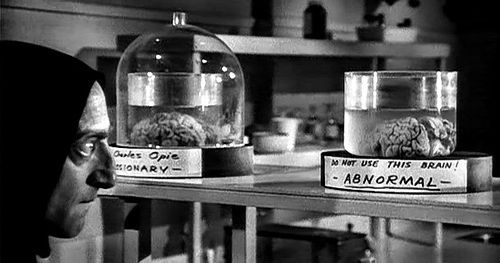
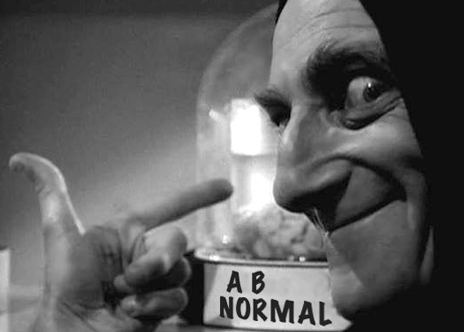
But given DC’s spending spree and all-time lows for M2 Money Velocity, The Fed is going to need to keep purchasing trillions in debt at low interest rates. The abnormal Obama years (Bernanke/Yellen) are the NEW abnormal. Or should I say abby normal policies?
Dr. Frederick FrankensteinAre you saying that I put an abnormal brain into a seven and a half foot long, fifty-four inch wide GORILLA?
So, yes, Bernanke and Yellen put into place abnormal policies that Powell is following into the world’s largest economy (or gorilla).
Only Igor and The Federal Reserve would pick such abnormal policies that ultimately lead to massive misallocations and inflation.
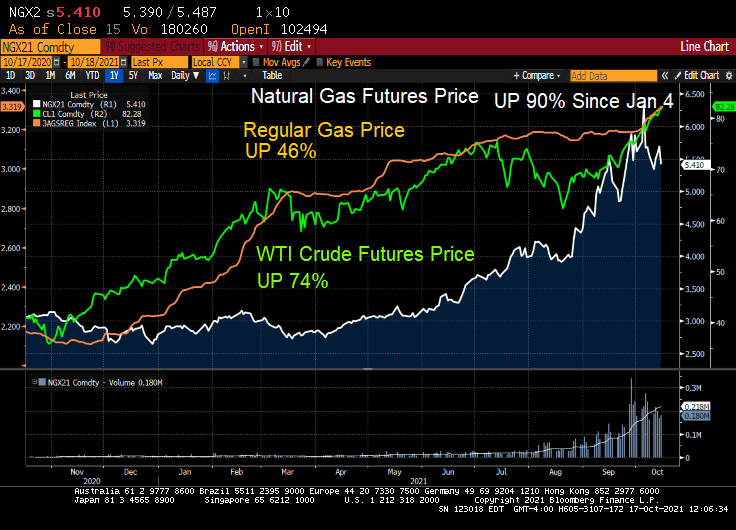
On a side note, do Biden and Transportation Secretary Pete Buttigieg really believe that they can fix the backed-up ports that are flooded with cargo thanks to Stimulypto? By Christmas??
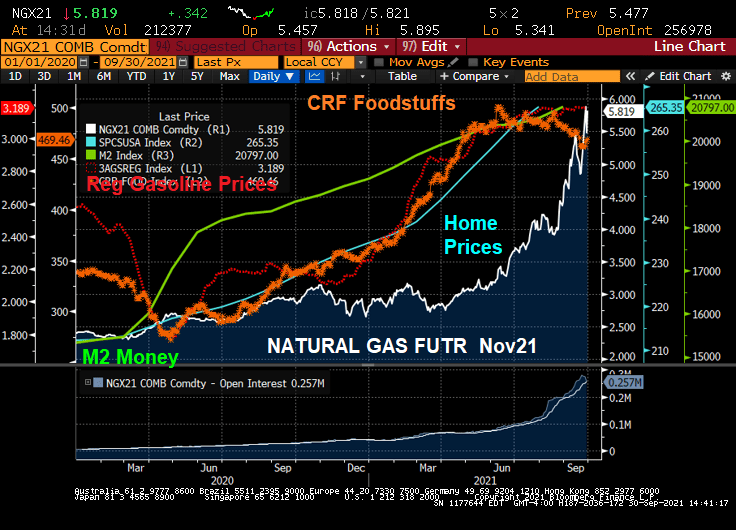
Not with natural gas prices up 90% since January 4th!
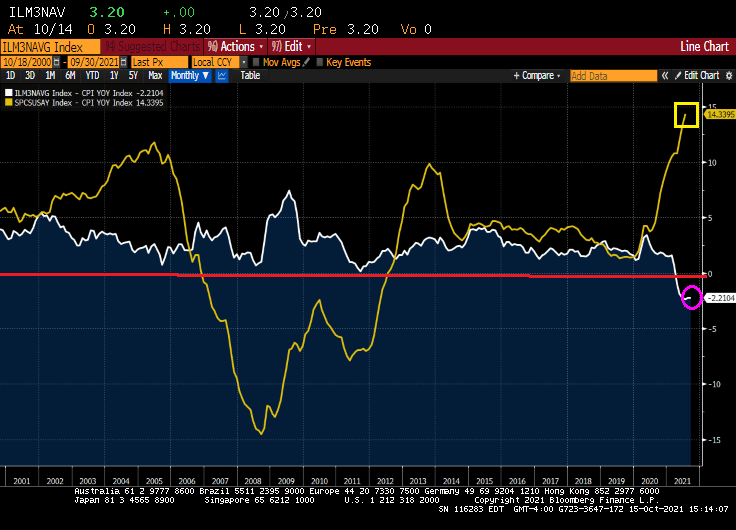
This is a time even unlike the disastrous housing bubble of the 2000s that led to the financial crisis and Great Recession. Even during the housing bubble years, we still had positive REAL mortgage rates: Bankrate 30Y Fixed rate – CPI YoY. But today we have even FASTER REAL home price growth and NEGATIVE mortgage rates!
And yes, REAL home price growth is 14.34% YoY while REAL hourly earnings growth is -0.79%.
The University of Michigan consumer survey came out today and buying conditions for housing improved to 75. Which means that more people were negative than positive due to skyrocketing home prices.
With negative 30Y mortgage rates and rising apartment rents, is it time to buy? Just remember what happened to Leon in Blade Runner.
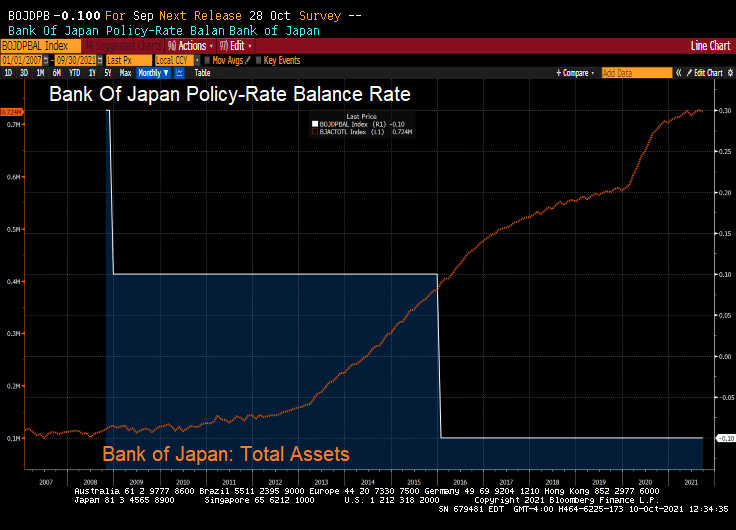
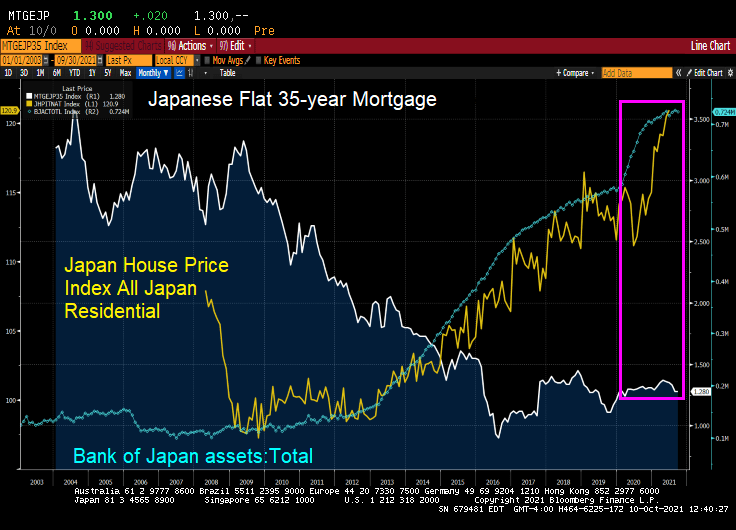
What’s left of it is that the BoJ (and Bank of Japan Governor Haruhiko Kuroda) now holds about half of the huge pile of the central government’s debt. With their target rate at -0.10% and a gargantuan balance sheet, what could go wrong?
But BOJ’s QE has ended. The BoJ’s overall assets stopped growing, and its holdings of government bonds have started to decline.
As of the BoJ’s balance sheet dated September 30, released on Thursday, total assets declined to a still monstrous ¥724 trillion ($6.4 trillion), below where it had been in May 2021.
But look at Japanese home prices with the growth of the BOJ’s balance sheet and general decline in mortgage rates. Like the USA, there was a balance sheet spike associated with Covid and a resulting spike in home prices.
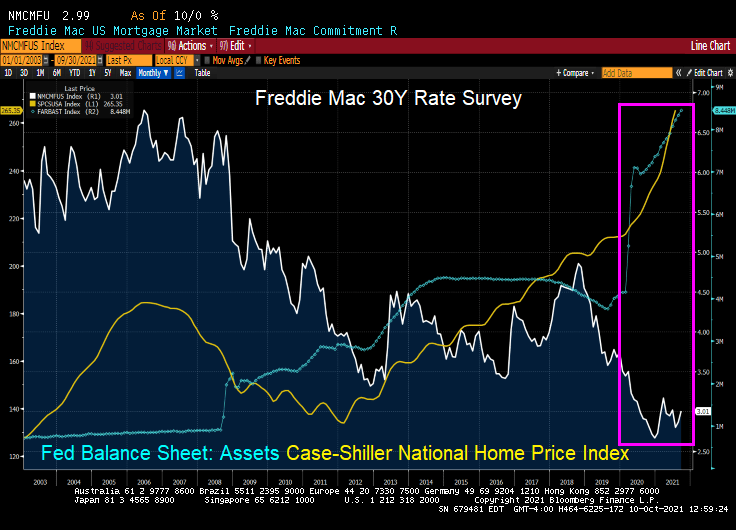
The USA? We also saw a surge in home prices following The Fed’s monetary “stimulypto.”
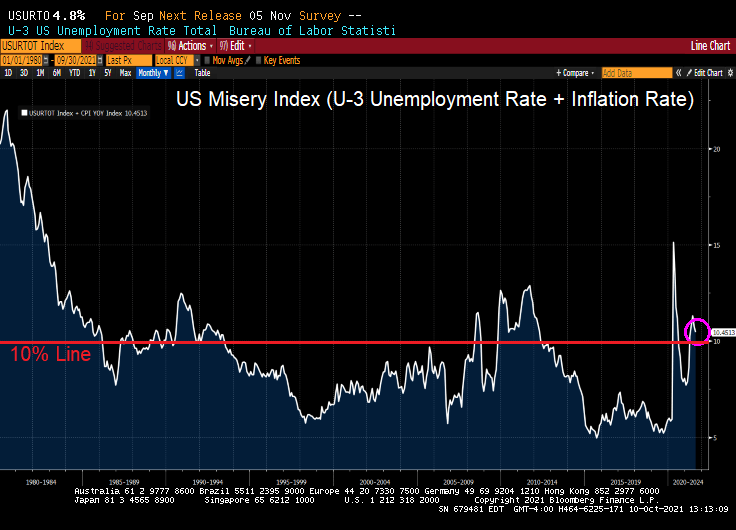
Bear in my that the US Misery Index is above 10% (U-3 unemployment + inflation).
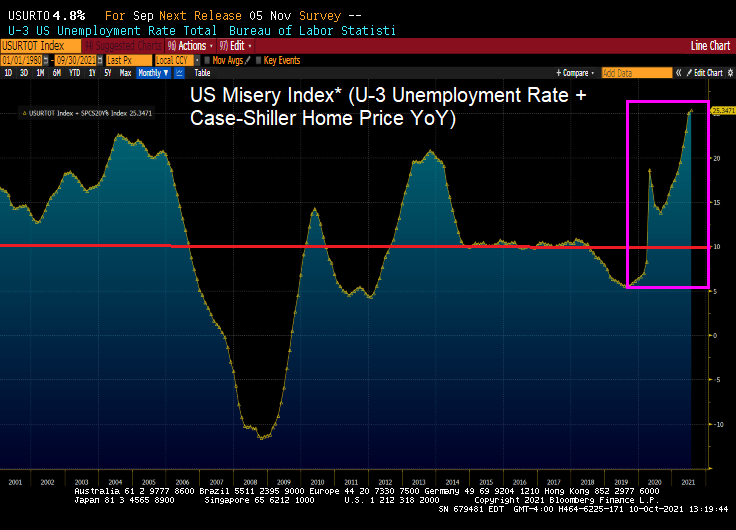
And if I define the US Misery Index as U-3 unemployment + home price growth, we can see we are at record misery rates. Miserable for households that don’t own a home or are trying to move to a higher housing price area).
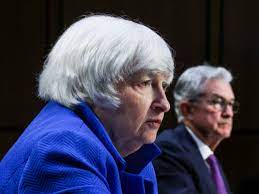
Well, Janet, we are headed there anyway with GDP crashing to a measly 1.33%.
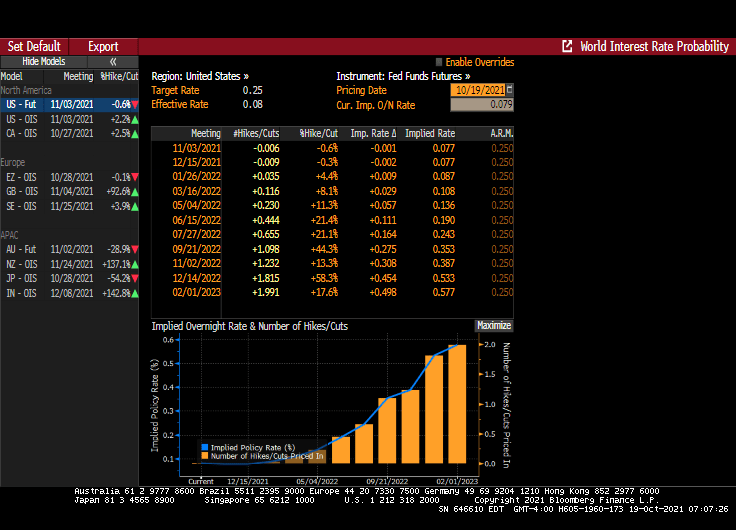
The fear of not approving a debt ceiling increase (laughable since Democrats can do it on their own) has caused there to be a “little dipper” in the US Treasury actives curve. Meaning that the 1-month T-bill yield is higher than the 1-year T-bill yield.
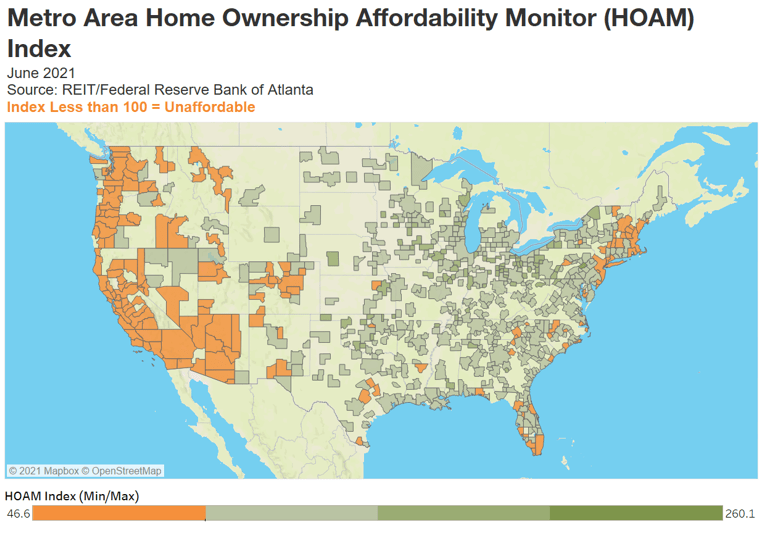
The national HOAM index stood at 92.2 in June, its lowest level since 2008.
National housing affordability fell 11.9 percent in June, the sharpest drop since 2014.
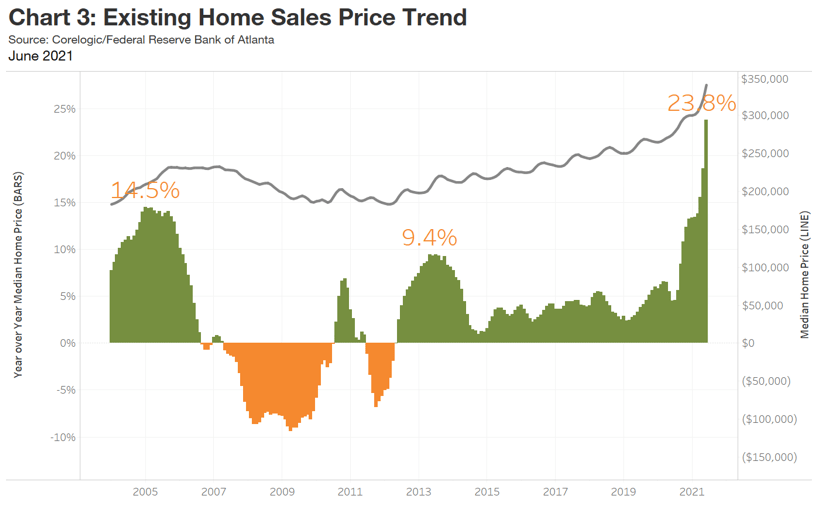
Home sale prices were up 23.8 percent over the past year.
On average, a median-income household would need to spend 32.6 percent of its annual earnings to own a median-priced home.
Although demand for housing remains strong, steadily declining affordability is beginning to affect buying decisions.
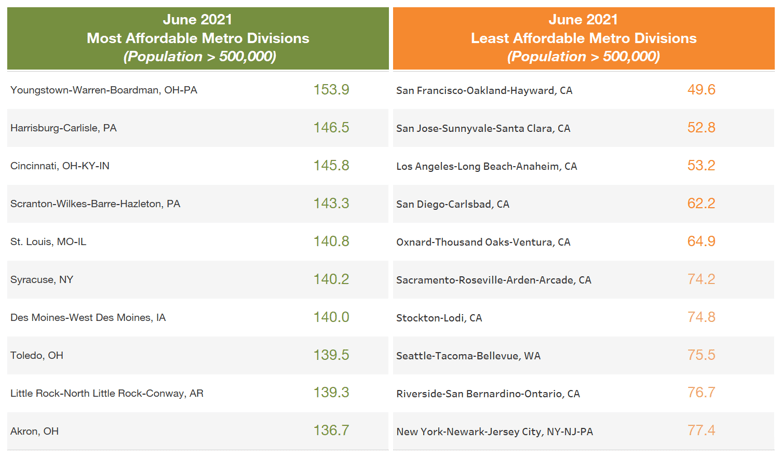
The latest reading of an Atlanta Fed measure and US housing trends show home ownership is becoming out of reach for many buyers and resistance to higher prices is building. More than 80 percent of US metro areas had a drop in affordability.
Where is housing most and least affordable?
ddd
Of course, the one chart that The Fed never includes is home price growth and Fed monetary policy.
So, if The Fed is so concerned with median-income households being priced out of housing markets, why are the still sticking with their unorthodox monetary policies?
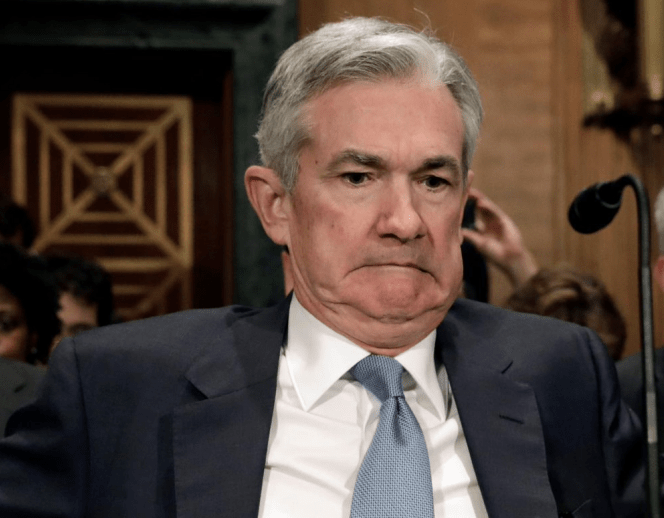
Only a multi-millionaire like Powell would call it frustrating. Most US consumers would call it “devastating.”
Look at home prices, natural gas, gasoline and food prices since The Fed turned on the money pump to combat the Covid shutdown by government. Well, at least food price growth has slowed, but that is more that offset by natural gas (heating) costs skyrocketing.
Rent? That too has zoomed upwards, although Powell likely isn’t worried about his rent rising by 11.5%.
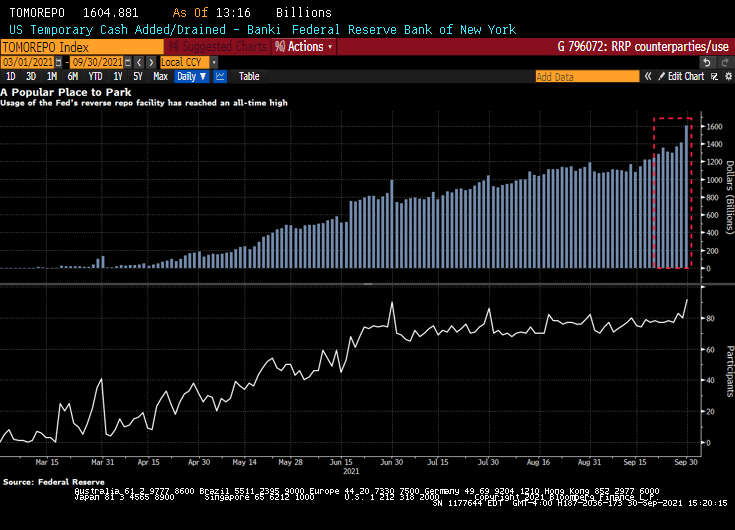
I wonder if Powell is frustrated by banks parking their money at the Fed’s reverse repo facility? Ninety-two participants on Thursday placed a total of $1.605 trillion at the Federal Reserve’s overnight reverse repurchase agreement facility, in which counterparties like money-market funds can place cash with the central bank. The previous record, set the day before, was $1.416 trillion. Thursday’s leap was the biggest one-day increase in usage since mid-June.
Biden blames “greed” for rising prices, Powell is “frustrated” by bottlenecks. But why pump trillions into the economy when you know there are bottlenecks? Or meatpacking firms are “greedy”?
So much for the transitory inflation that The Federal Reserve keeps spouting on about.
(Bloomberg) — The pace of rent increases is heating up in the U.S.
Rent data for the past two months show no sign yet of the usual seasonal dip at this time of year, following peaks early in the summer, when many lease renewals come due.
A Zillow Group Inc. index based on the mean of listed rents rose 11.5% in August from a year earlier, with some cities in Florida, Georgia and Washington state seeing increases of more than 25%.
Since the start of the pandemic, the median rent for a two-bedroom apartment has soared 13.1% to $1,663, Zumper data show.
But rent on newly-signed leases rose 17% from the previous tenant’s lease.
For the New York market, landlords are raising rent prices as much as 70% now that people are flooding back into the city as offices and entertainment venues open up. In July, the median asking rent in New York City surged to $3,000, compared with the pandemic low of $2,750 in January 2021, data from StreetEasy showed.
Of course, rent surge is not surprising given that home prices have surged since Covid given limited inventory and massive Fed stimulus.
Perhaps if The Fed and Federales (Federal government) start reducing their apocalyptic-level stimulus, THEN we will see inflation as transitory.
The Federal Reserve is dominating the news today as two Fed regional Presidents have resigned (Rosengren [Boston] and Kaplan [Dallas]) for trading irregularities.
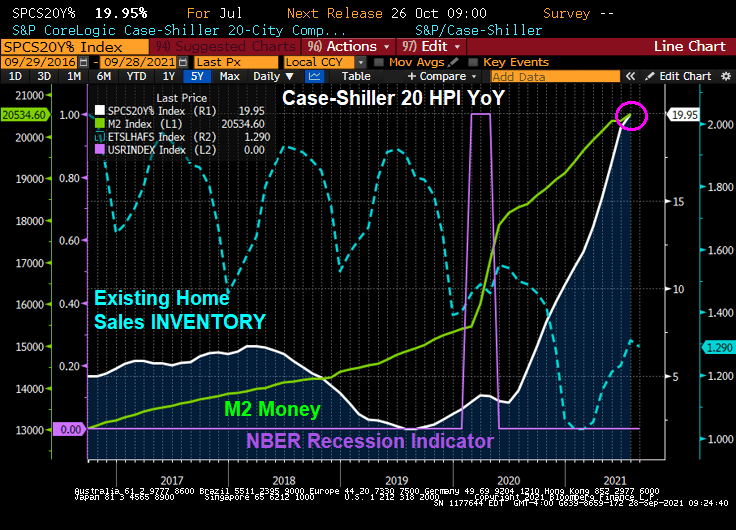
Now, it is September 28, so this is a report of happenings two months ago. Well, now you know why The Fed ignores housing despite being the largest asset is most household’s portfolio.
A measure of prices in 20 U.S. cities gained 19.9% in July. Phoenix led the way with a 32.4% surge. New York (17.8%), Boston (18.7%), Dallas (23.7%), Seattle (25.5%) and Denver (21.3%) were among the cities that posted record year-over-year increases.
The housing market is over, under, sideways, down thanks to The Fed pumping trillions into a market with limited available inventory.


You must be logged in to post a comment.