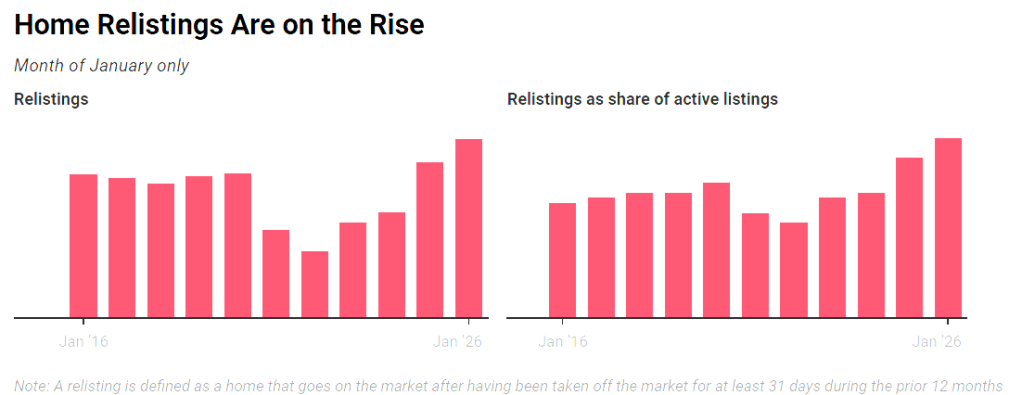
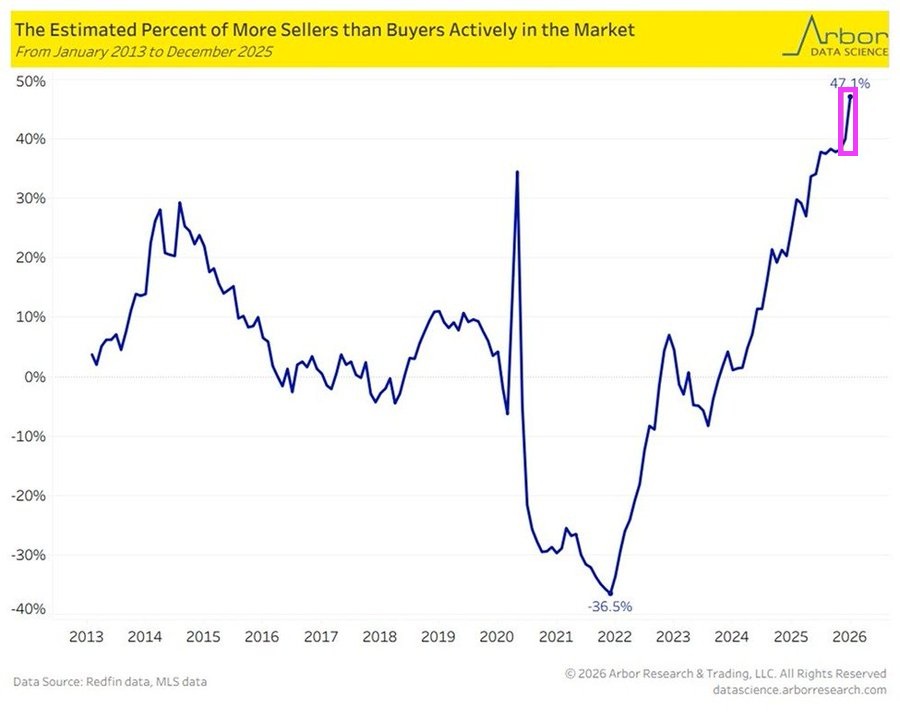
Delistings soared in 2025 after sellers began to outnumber buyers, and decided to take their homes off the market to take another bite at the apple this spring. Overall delistings hit a record high of 112,788 in December, while relistings this year represented 3.6% of all homes on the market.
Supply gains have been concentrated in the South and West, particularly among homes priced under $500,000. While the Northeast and Midwest have seen some growth, they are still lagging behind the other regions.
As of February, active listings climbed by 7.9 percent year over year, reaching 914,860 homes across the nation for sale. A little more than 7 percent of those listings resulted in contract cancellations—down slightly from the same time in 2025.
An analysis of the country’s 50 largest markets showed sharp increases in inventory in Seattle, with a 38.5 percent hike, as well as Louisville, Kentucky, 27.3 percent higher, and San Jose, with nearly 25 percent more homes on the market.
On the other side, Hartford, Connecticut, experienced the deepest drop in inventory at over 82 percent, as well as Providence, Rhode Island, at 61.1 percent.
Overall, homes spent a median of 70 days on the market in February, four days longer than a year earlier.
Underlying U.S. inflation increased more than expected in December, and signs are pointing to a further acceleration in January, which would strengthen expectations that the Federal Reserve would not cut interest rates before June.
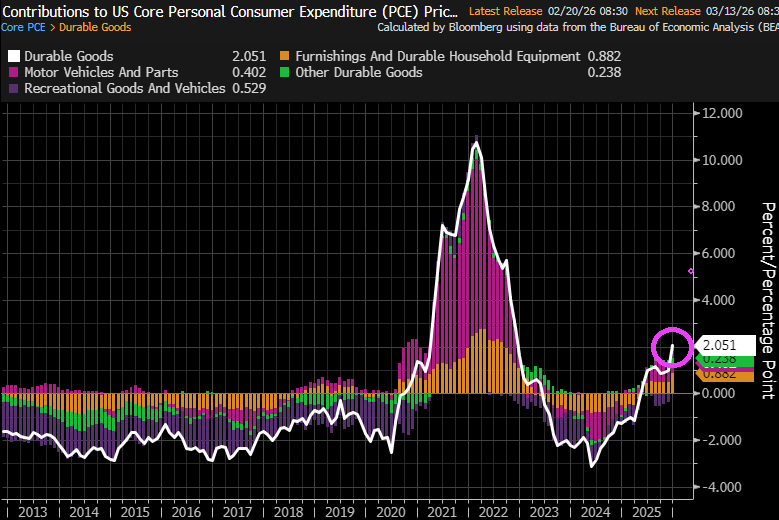
The personal consumption expenditures price index, excluding the volatile food and energy components, rose 0.4% after an unrevised 0.2% gain in November, the Commerce Department’s Bureau of Economic Analysis said on Friday. In the 12 months through December, core PCE inflation advanced 3.0% after increasing 2.8% in November.
The PCE price index increased 0.4% in December after rising 0.2% in November. PCE inflation increased 2.9% year-on-year after gaining 2.8% in November.
But in terms of contributions to the 0.4% figure is that durable goods rose 2.051%.
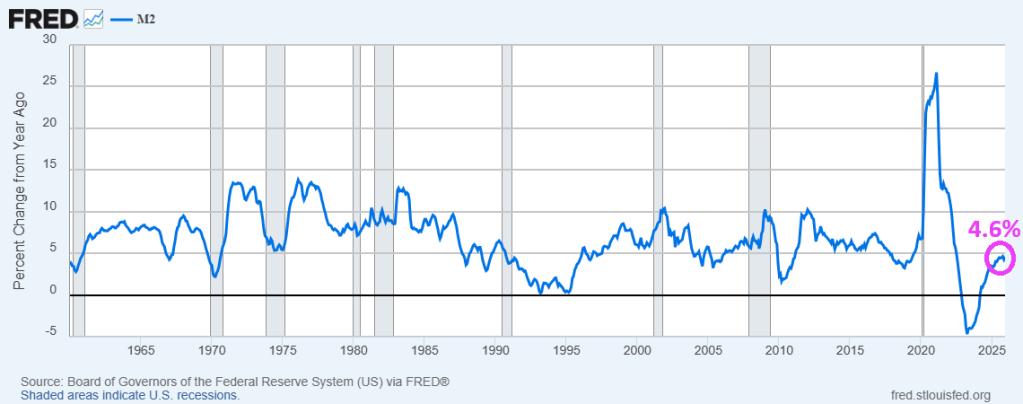
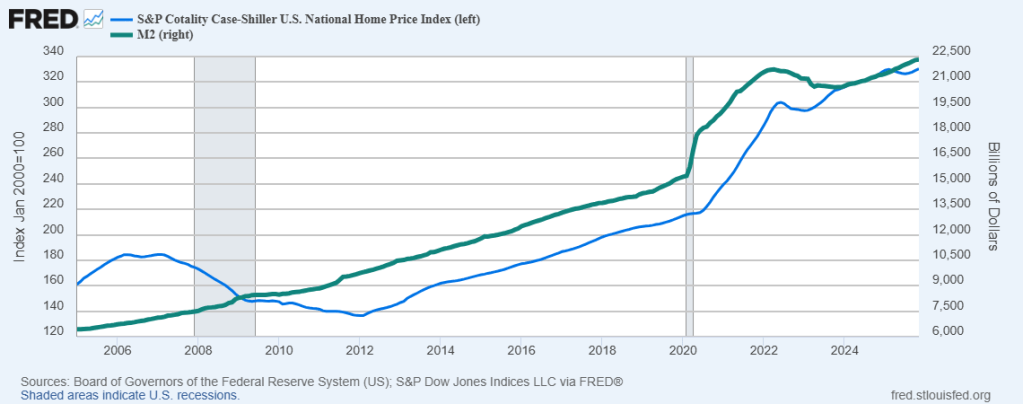
The Fed has been printing money (M2) like there is no tomorrow. With M2 growing at 4.6% YoY in December.
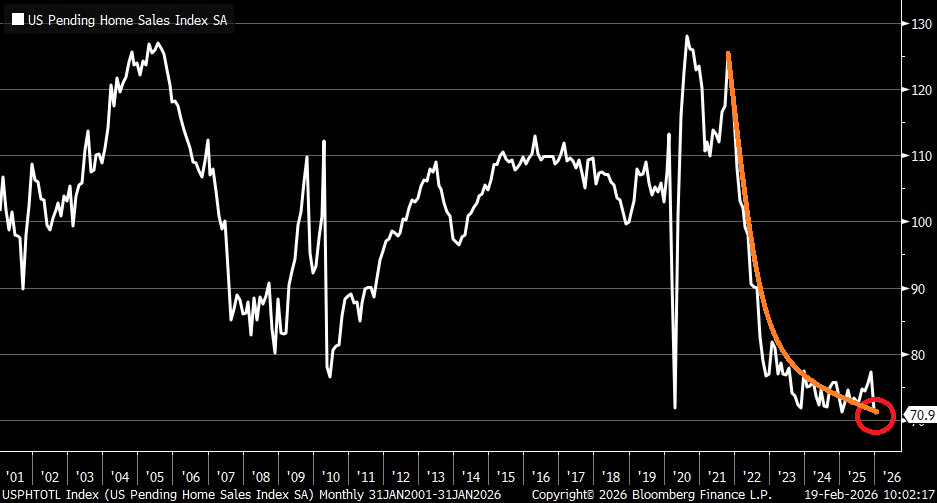
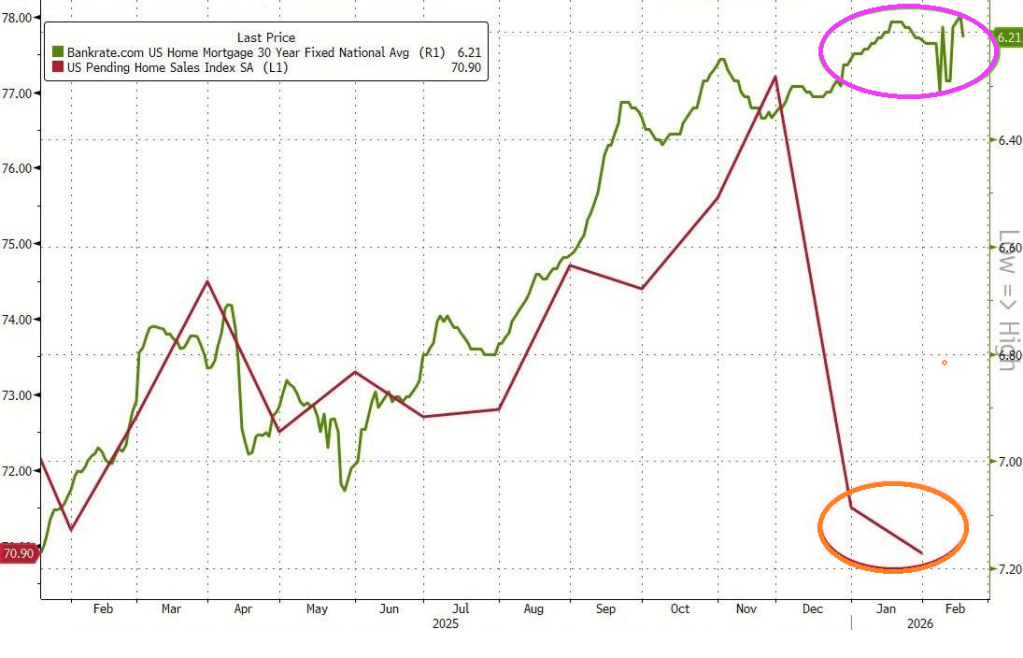
Unfortunately, US pending home sales have collapsed to the lowest level since at least 2001. Nothing has been the same since Biden/Harris administration.
Mortgage rates are still too high by historic standards.
Speaking of Democrats running the economy, New York’s mayor Zoran Mandami (the Ugandan Communist) is seeking to raise property taxes to 9.5% which will hit EVERY New Yorker, not just the billionaires he allegedly wants to tax.
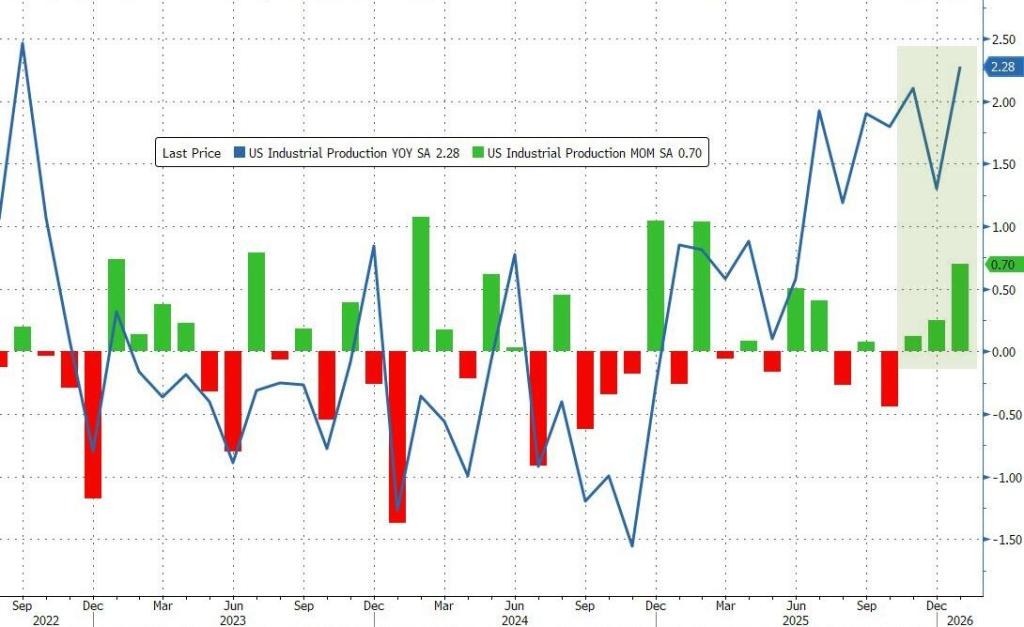
So much for the leftist fearmongers claiming that Trump Tariffs will kill US manufacturing, In January, US industrial production rose 0.7% MoM. And 2.28% YoY.
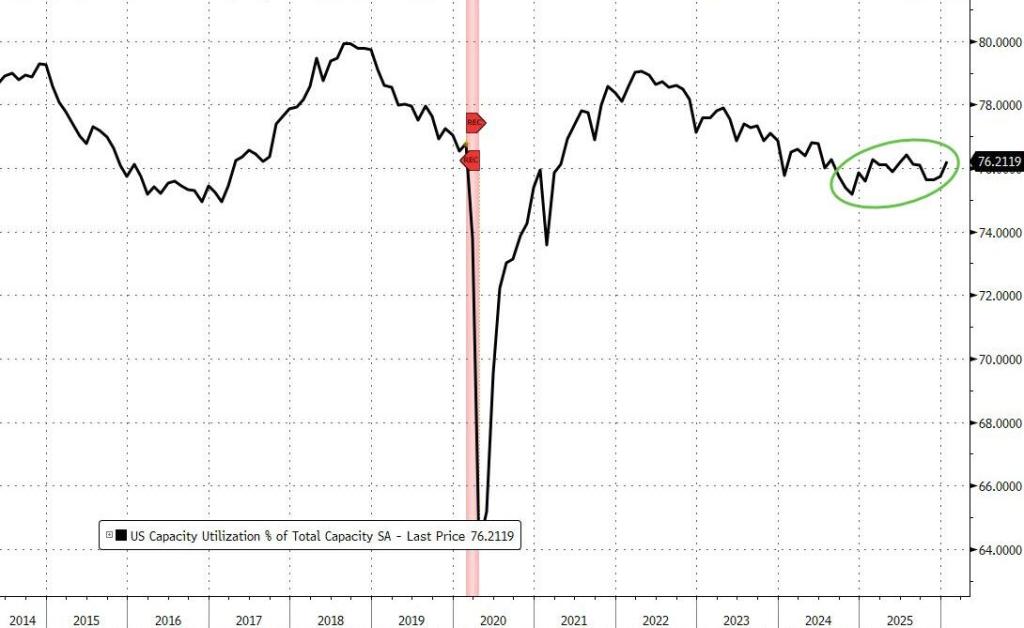
Capacity utililzation rose in January to 76.22%.
Pass the Save Act and don’t listen to leftist propaganda that women won’t be allowed to vote. Then get a passport and show that.
Rate-cut expectations have surged (dovishly) higher this week (along with tumbling Treasury yields) amid a mixed macro picture (Labor market ‘good’, Retail sales bad, Housing ugly).
Today could change all that as CPI for January prints with risk skewed to the upside. January brings annual resets and they tend to surprise on the high side.
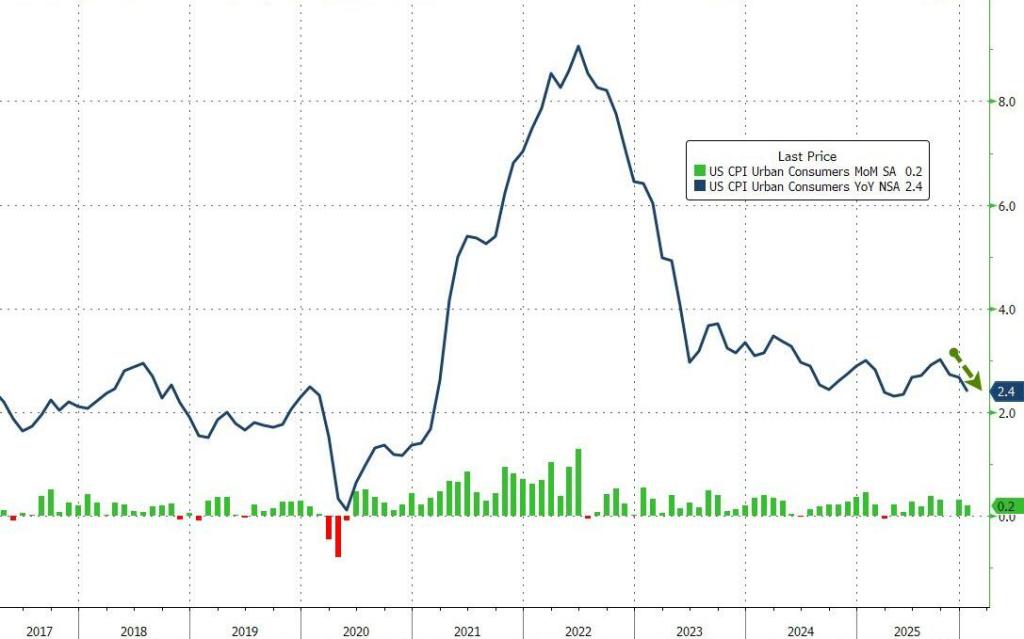
Despite the ‘hot’ whisper numbers (and 4 previous Januarys in a row of upside surprises), headline consumer price inflation came in cooler than expected in January (+0.2% MoM vs +0.3% expected). That pulled the headline CPI down dramatically from +2.7% to +2.4% – near the lowest in 4 years.
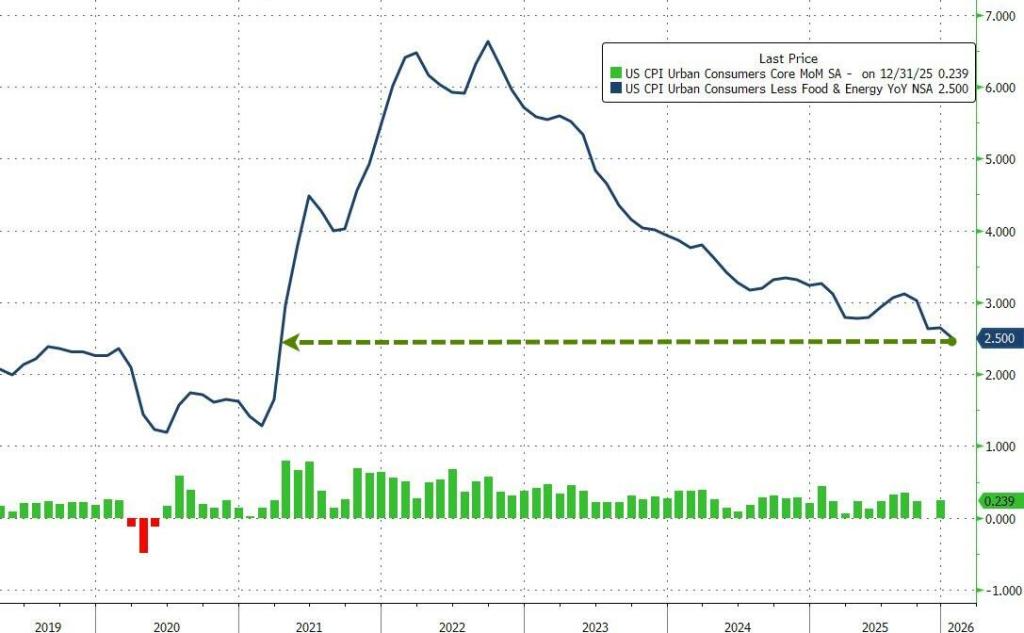
Core CPI printed +0.3% MoM (in line with expectations), lowering the YoY change in core prices to +2.5% – the lowest since March 2021.
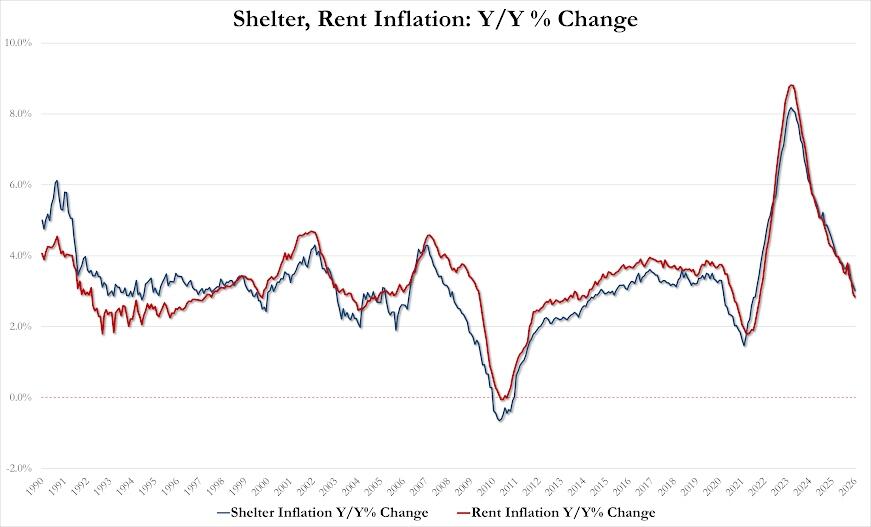
The Shelter index rose 0.2% in January and was the largest factor in the all items monthly increase. The food index increased 0.2% over the month as did the food at home index, while the food away from home index rose 0.1 percent. These increases were partially offset by the index for energy, which fell 1.5% in January.
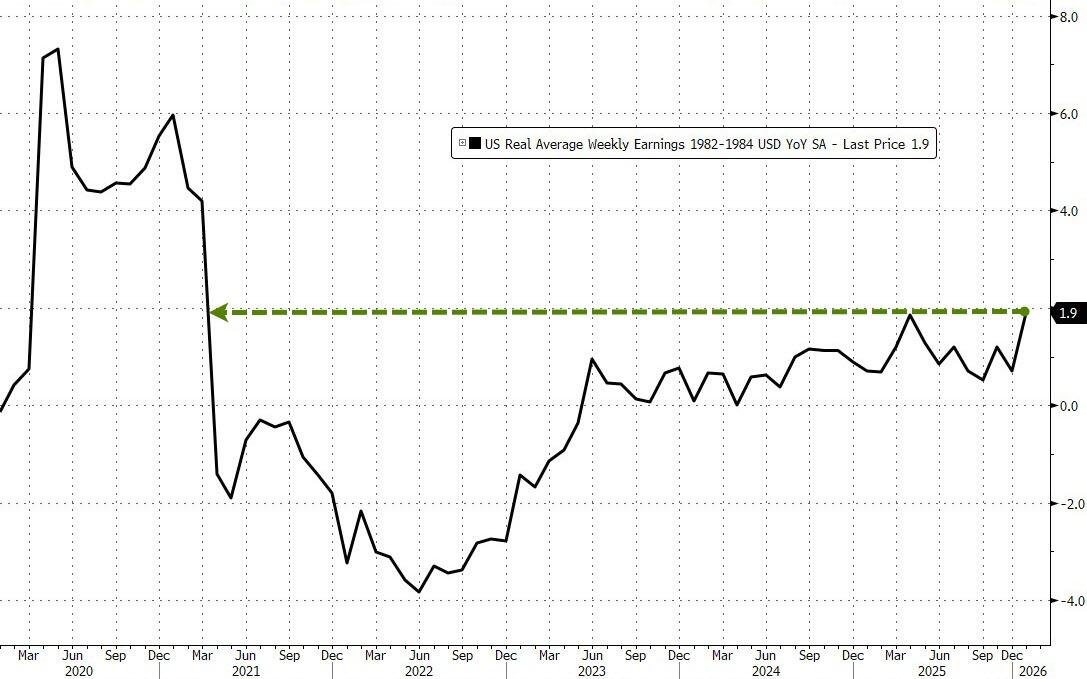
January saw real average weekly earnings rise 1.9% YoY – its highest since March 2021…
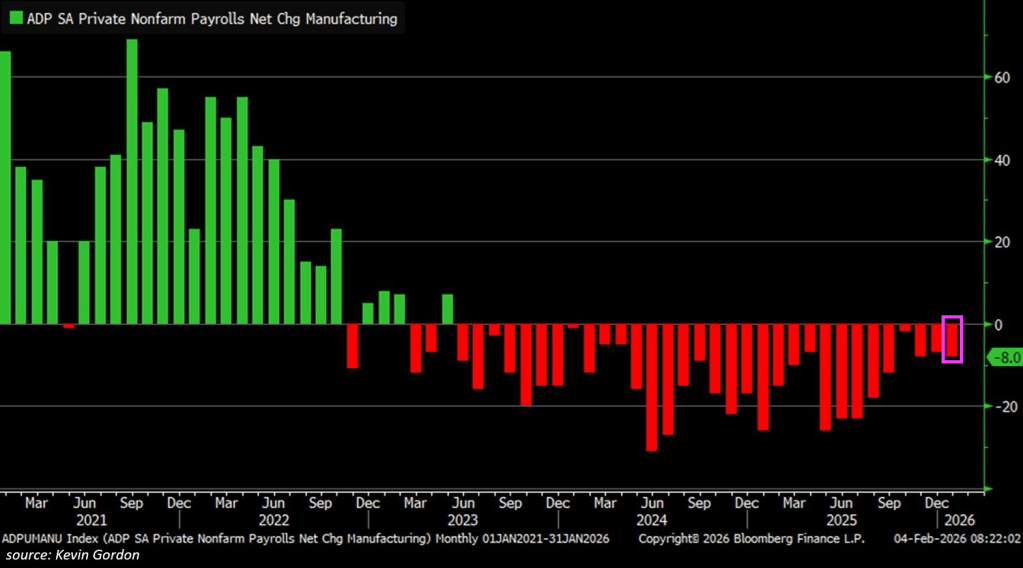
The manufacturing sector shed -8,000 jobs in January, according to the ADP private employment report.
This marks the 32nd consecutive monthly decline, the longest streak since data began in 2010.
In 2024 and 2025, manufacturing employment fell -154,000 and -177,000, respectively.
Since the 2022 peak, -403,000 jobs have been lost, bringing total manufacturing employment down to 12.483 million, the lowest since November 2021.
The sector has now lost HALF the number of jobs wiped out during the 2020 pandemic.
The US manufacturing sector is in recession.
It is difficult to undo the damage to the economy done by Biden and Chuck Schumer with their insane spending and open borders. Like pushing up housing prices to obscene levels under Clueless Joe.
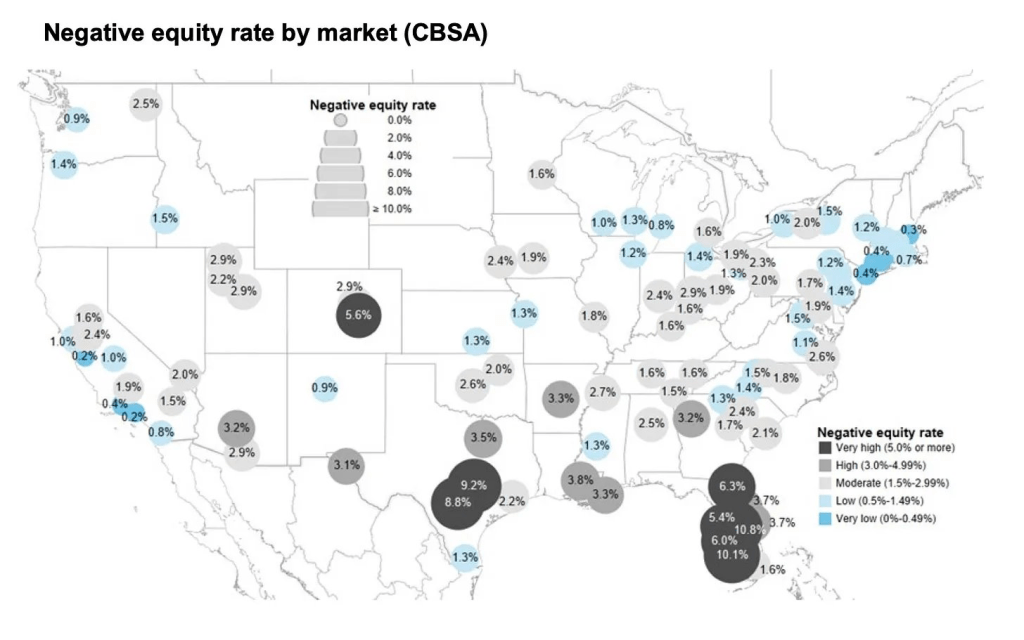
US Manufacturing Sector Shed -8k Jobs on January (Difficult To Undo Damage Done By Biden and Schumer Including Negative Home Equity).
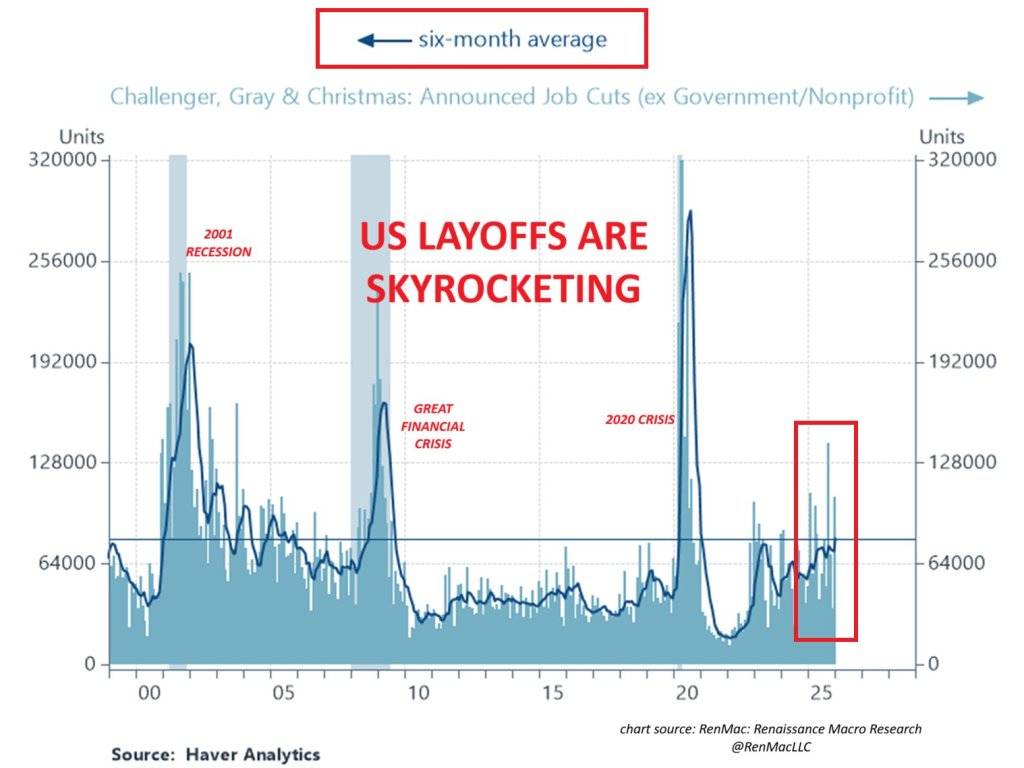
US layoffs are skyrocketing, largely due to the cost of providing Obamacare to employees. Easier to replace full-time workers with part-time and no healthcare benefits.
Sorry Bad Bunny, Your open border fantasies are a nightmare for law and order.
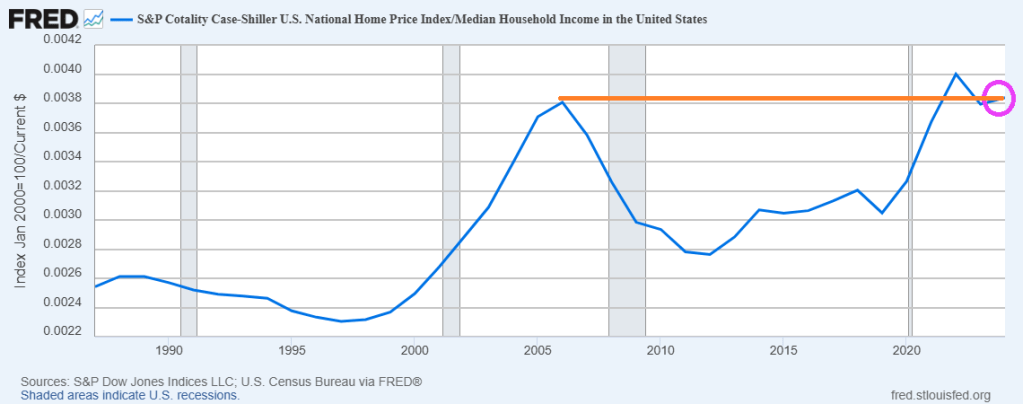
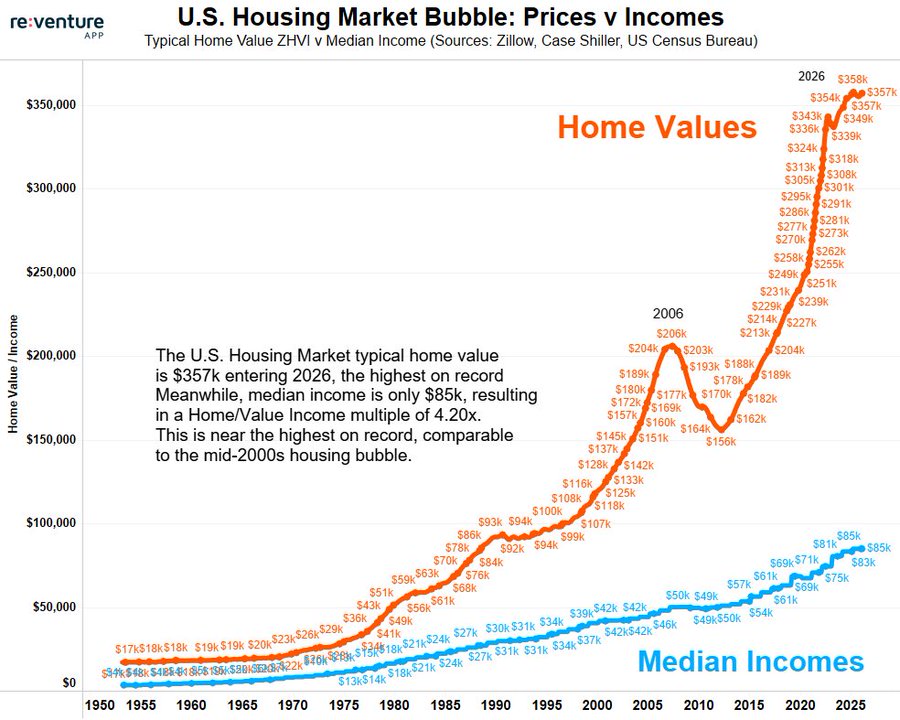
Yikes! The ratio of US Home Prices to US Median Household Income is now higher than the ratio during the catestrophic housing bubble during the latter half of the 2000s.
Here is a chart of home prices and median household incone,
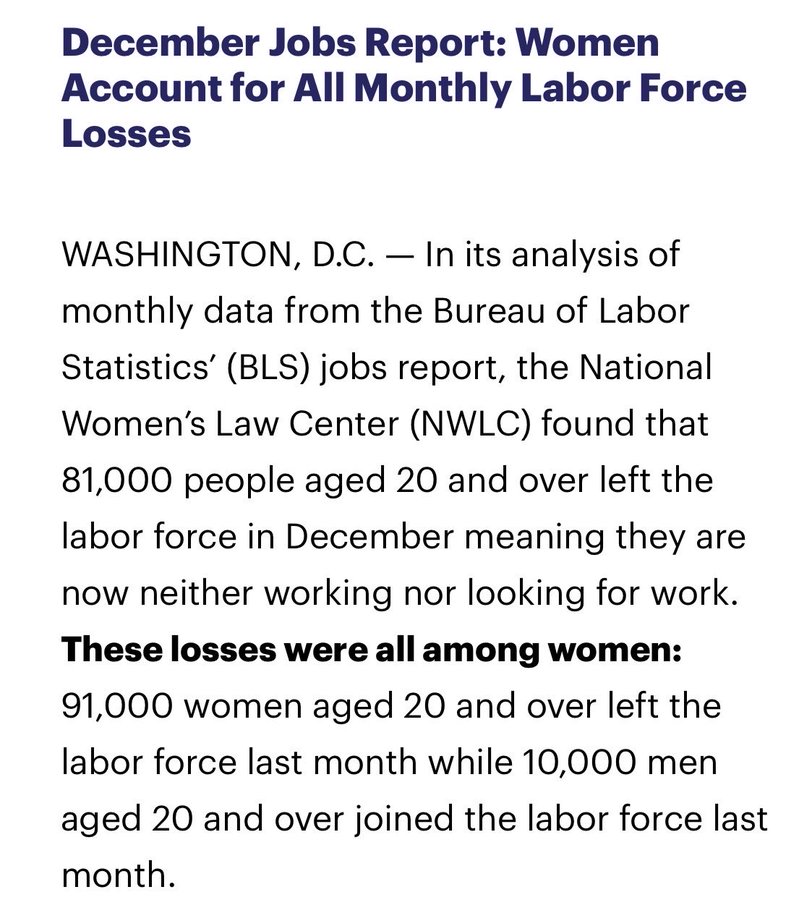
The labor market is truly screwed-up. The December jobs report reveals that women account for nearly all labor force losses.
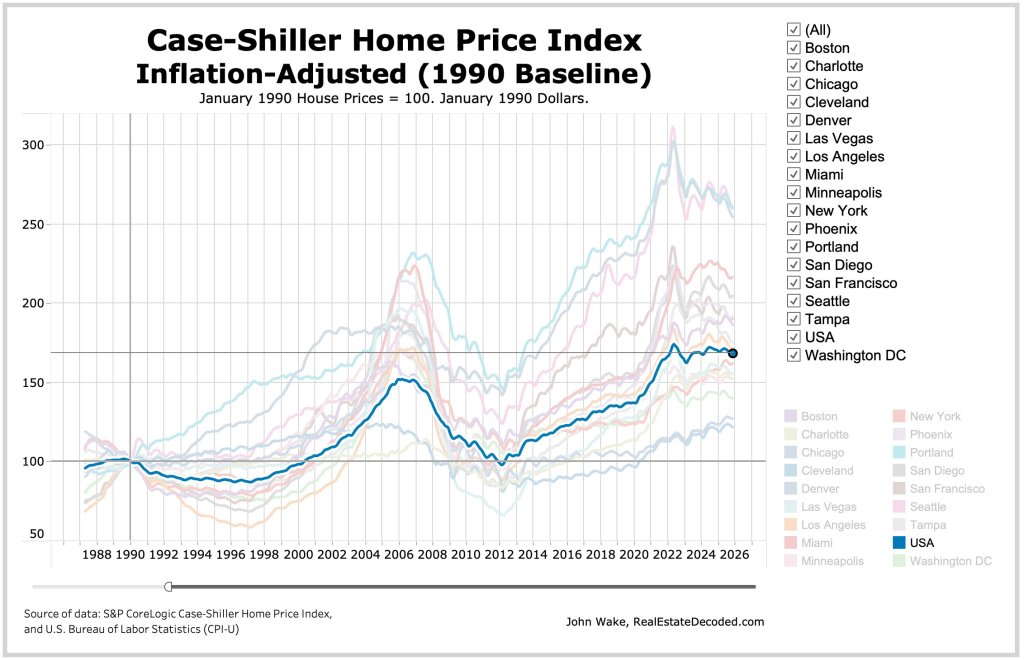
Keep on printing money. It seems that home price growth requires The Fed to keep printing money.
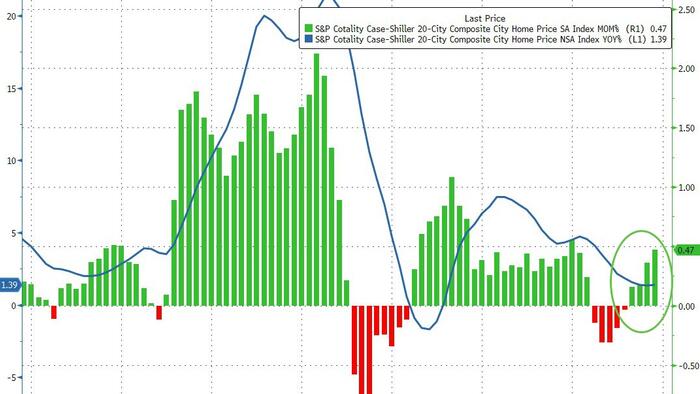
S&P/Case-Shiller released the monthly Home Price Indices for November (“November” is a 3-month average of September, October and November closing prices). September closing prices include some contracts signed in July, so there is a significant lag to this data. Here is a graph of the month-over-month (MoM) change in the Case-Shiller National Index Seasonally Adjusted (SA).
The S&P Cotality Case-Shiller U.S. National Home Price NSA Index posted a 1.4% annual gain for November, in line with the previous month.
Real home values declined as consumer inflation (2.7%) outpaced the National Index gain (1.4%) by 1.3 percentage points.
Regional divergence persisted: Midwestern and Northeastern markets led by Chicago (+5.7%) and New York (+5.0%) posted gains, while Sun Belt cities including Tampa (–3.9%), Phoenix (–1.4%), Dallas (–1.4%), and Miami (–1.0%) saw declines. … “Regional patterns continue to illustrate a stark divergence. Chicago leads all cities for a second consecutive month with a 5.7% year-over-year price increase, followed by New York at 5.0% and Cleveland at 3.4%. These historically steady Midwestern and Northeastern markets have maintained respectable gains even as overall conditions cool. By contrast, Tampa home prices are 3.9% lower than a year ago – the steepest decline among the 20 cities, extending that market’s 13-month streak of annual drops. Other Sun Belt boomtowns remain under pressure as well: Phoenix (-1.4%), Dallas (-1.4%), and Miami (-1.0%) each continue to see year-over-year declines, a dramatic turnaround from their pandemic-era strength.
“Monthly price changes were mixed but leaned negative in November, underscoring persistent softness. On a non-seasonally adjusted basis, 15 of the 20 major metro areas saw prices decline from October (versus 16 declines in the previous month). Only a handful of markets – including Los Angeles, San Diego, Miami, New York, and Phoenix – eked out slight gains before seasonal adjustment. After accounting for typical seasonal slowing, the National Index inched up just 0.4% for the month, indicating that price momentum remains muted. … The S&P Cotality Case-Shiller U.S. National Home Price NSA Index, covering all nine U.S. census divisions, reported a 1.4% annual gain for November. The 10-City Composite showed an annual increase of 2.0%, up from a 1.9% increase in the previous month. The 20-City Composite posted a year-over-year increase of 1.4%, up from a 1.3% increase in the previous month. … The pre-seasonally adjusted U.S. National Index saw a drop of 0.1% and the 20-City Composite Index fell 0.03%, while the 10-City Composite Index increased 0.1%.
After seasonal adjustment, the U.S. National Index reported a monthly increase of 0.4%, and both the 10-City Composite and 20-City Composite Indices posted month-over-month gains of 0.5%.


You must be logged in to post a comment.