Appropriately, the song “The Morning After” is from the liquidity disaster film “The Poseidon Adventure.”
Here is chart of Bitcoin, Ethereum and the US Dollar Index after The Fed’s announcement yesterday at 2pm EST. The US Dollar fell and Bitcoin/Ethereum rose.
And then we have Evergrande bonds, hovering around $30 (down from par of $100). Waiting for the next shoe to drop.
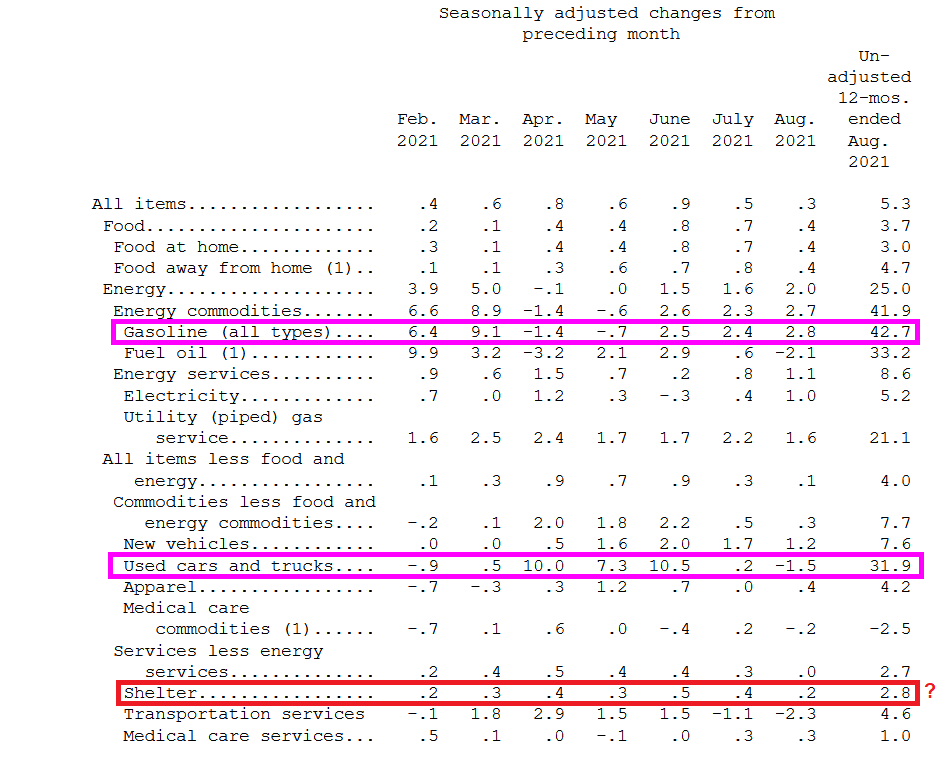
US inflation remained about the same in August as it was in July. CPI YoY fell ever so slightly from 5.4% in July to 5.3% in August. Real hourly earnings remain negative.
The source of consumer inflation? Gasoline prices rose 42.7% YoY while used cars and trucks rose 31.9% YoY.
Shelter rose 2.8% YoY. That is odd since the Case-Shiller national price index is growing at a torrid 18.61% YoY pace and the Zillow Rent Index YoY has recovered to a sizzling 9.24% YoY pace.
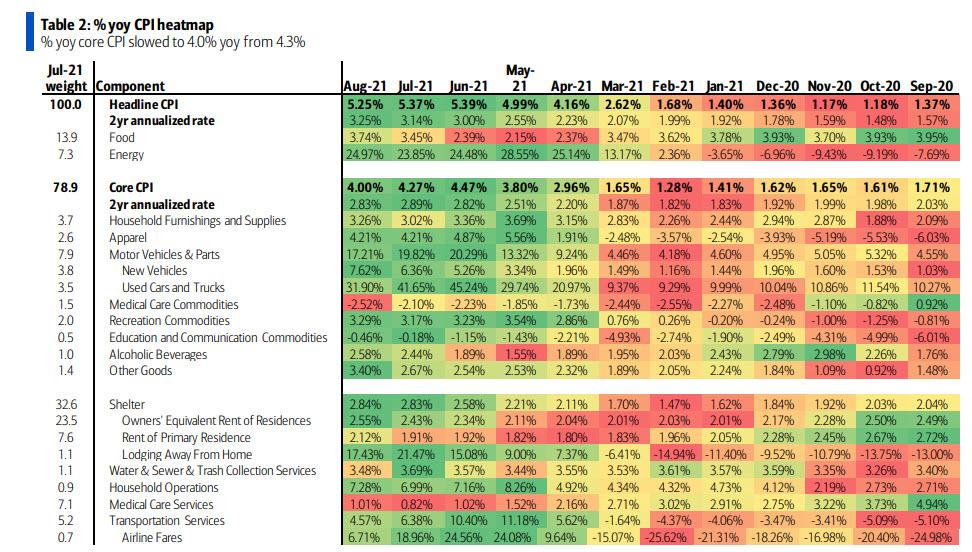
The YoY heatmap of inflation.
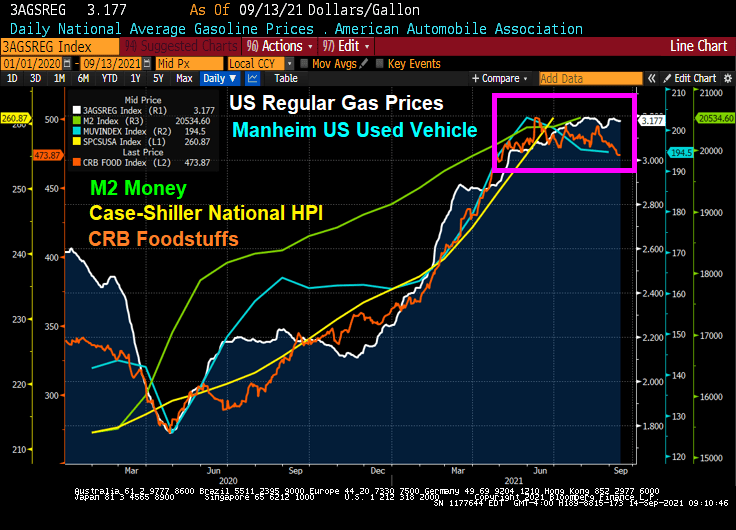
However, with the exception of home prices and rent, we are seeing a slowing of used car, foodstuffs and regular gas prices over the summer.
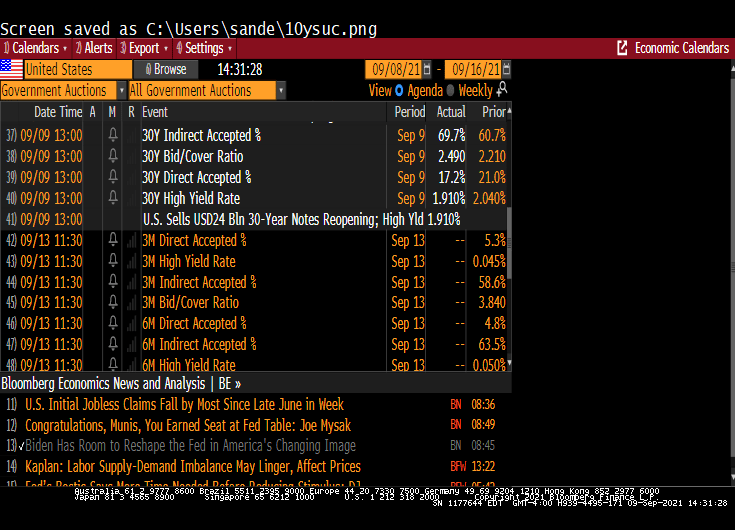
Face it, the 30-year Treasury market is not as interesting as widely-traded as the 10-year Treasury market. But we did see some interesting revelations in today’s 30 year Treasury auction.
If yesterday’s 10Y auction was blockbuster, one of the strongest benchmark sales on record, then today’s $24 billion offering of 30Y paper – the last coupon auction of the week – was nothing short of spectacular.
Printing at a high yield of just 1.910%, the auction not only stopped at the lowest yield since January’s 1.825%, but also stopped through the When Issued by a whopping 1.8bps, the most since April and ended 4 consecutive months of tails in the 30Y tenor.
The bid to cover of 2.486 was not only a big jump from last month’s 2.208 but also the highest since the 2.500% in July 2020, and far above the six-auction average of 2.276.
The bid-to-cover ratio is the dollar amount of bids received in a Treasury security auction versus the amount sold. The bid-to-cover ratio is an indicator of the demand for Treasury securities. A high ratio is an indication of strong demand.
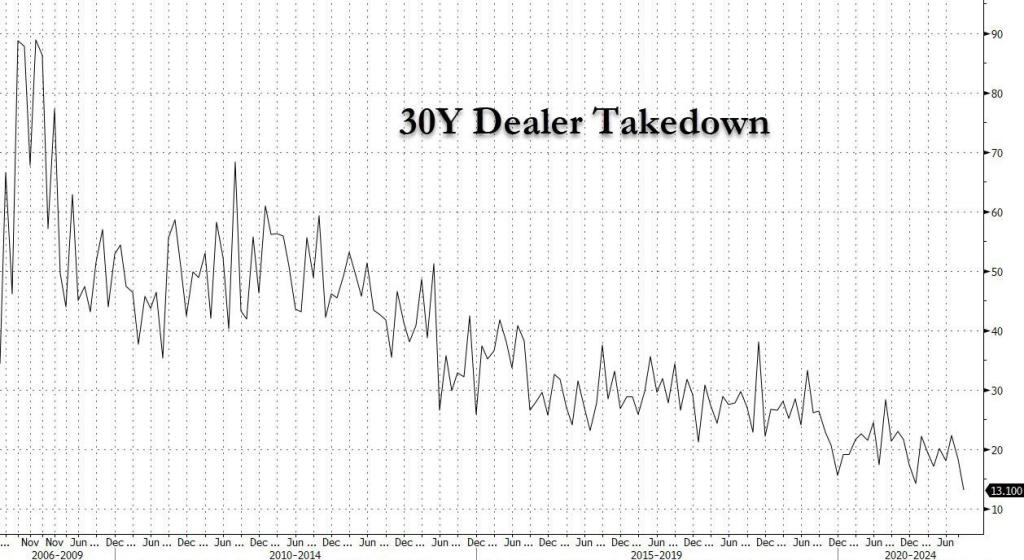
Primary dealers are responsible for absorbing any supply not bought by direct or indirect bidders. Indirect bidders, which include fund managers and foreign central banks. Dealer takedown of the 30Y Treasury is historically low.
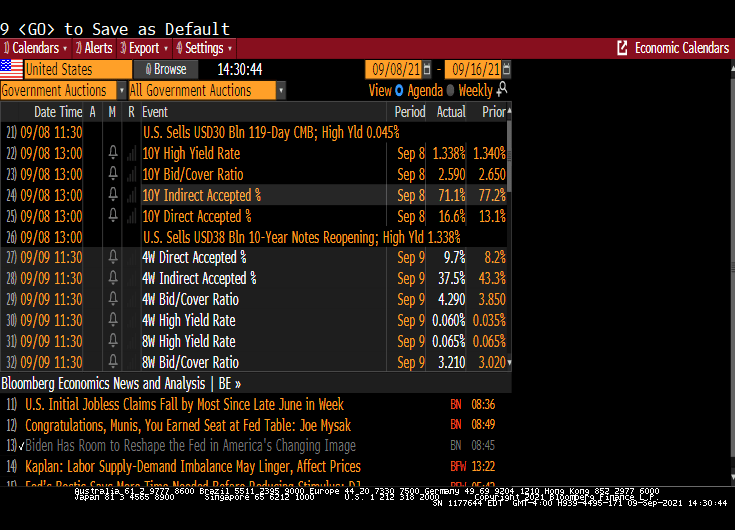
The 10-year auction was similar in that the high rate fell. But the bid-to-cover declined.
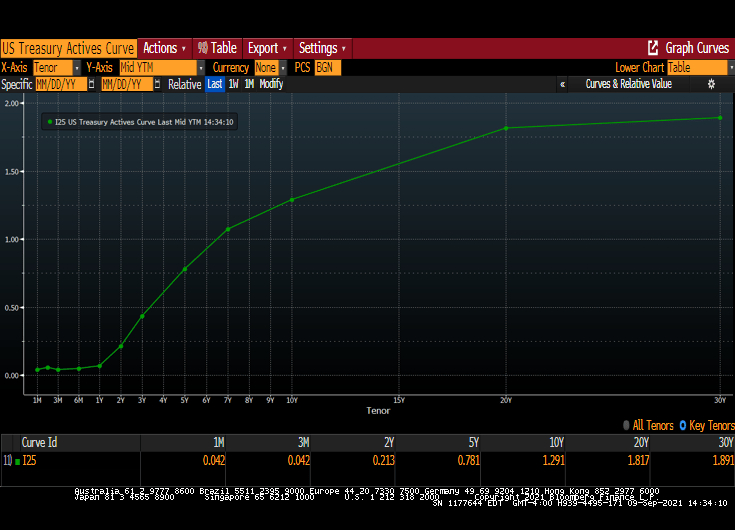
The US Treasury actives curve remains upward sloping, albeit at lower yields across the curve.
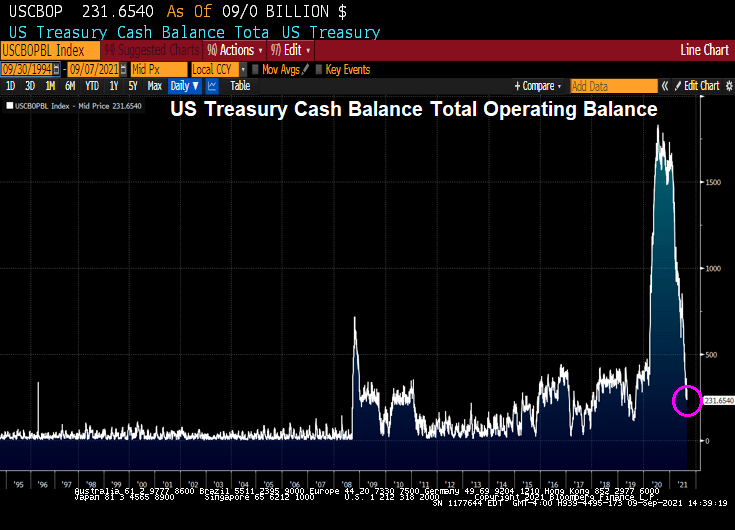
Meanwhile, Treasury Secretary Janet Yellin’ is fear-mongering about a possible US debt default. True, US Treasury cash balance has declined to $231 billion.
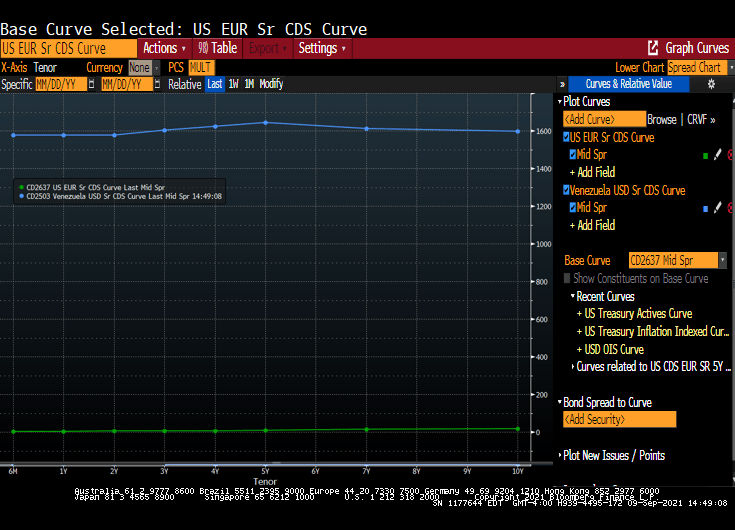
Will Congress pass a budget and fill the Treasury coffers will lots of money? Of course. Here is the US CDS curve compared to Venezuela’s CDS curve. The US curve is close to zero while Venezuela’s at near 1,600 across tenors.
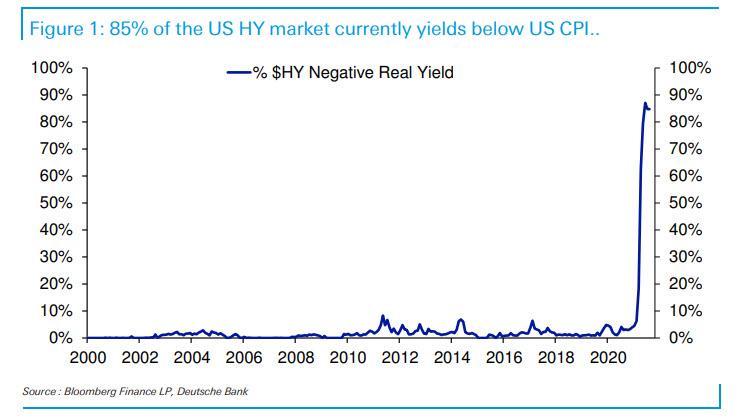
According to Deutsche Bank, 85% of the US High Yield market has a yield below the current rate of inflation.
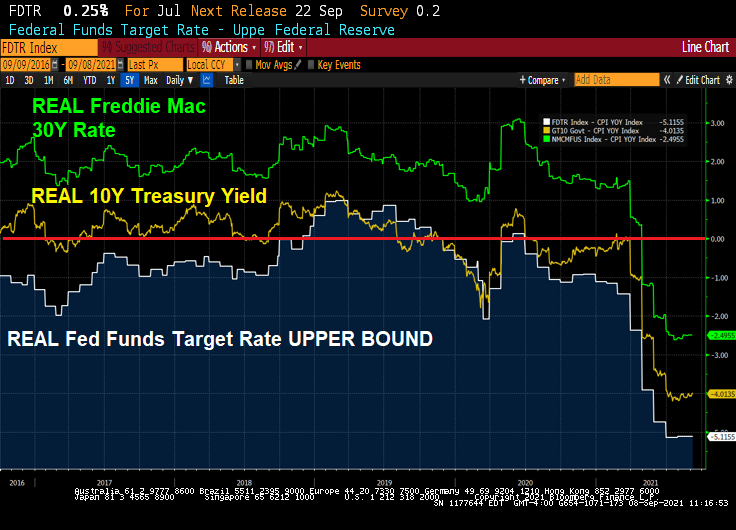
Its not only high-yield bonds that have negative REAL yields, but even The Fed Funds Target rate is negative at -5.12%. The real 10-year government bond yield is -4.01% and the REAL Freddie Mac 30-year mortgage survey rate is -2.5%.
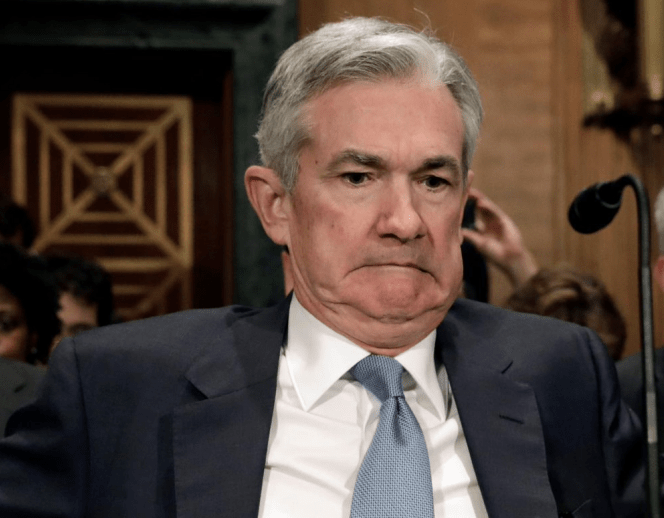
At the annual Jackson Hole (aka, J-Hole) Economic Symposium, Federal Reserve Chairman Jerome Powell reiterated that the Fed is in no hurry to either taper asset purchases immediately or aggressively. Additionally he made crystal clear that even when the Fed does eventually start tapering asset purchases (likely November or December), it should not be taken as signaling interest rate hikes will follow on some preset course. Indeed, Fed Chairman Powell continues to claim that inflation is transitory. Finally, he said that part of the mandate (employment) is still far from being achieved. So, expect more SNAKE JUICE.
The shape of the yield curve has been highly influential recently in relative performance trends between various areas of the market. From last summer through May of this year, the steepening of the yield curve coincided with healthy outperformance of cyclical stocks. Since May, the flattening of the curve has coincided with more defensive (or at least high quality) leadership out of the tech and health care sectors. The logic goes, therefore, that a re-steepening of the curve should coincide with a shift back to cyclicals. Indeed, that shift may be in the early innings.
Let’s take a look at the US Treasury 10Y-2Y curve slope over the past twelve months against the Citi Economic Surprise Index for the US. You can see curve fatigue starting in April 2021 as the Citi Economic Surprise Index turns negative.
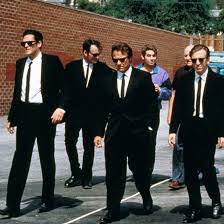
The the more cyclical and smaller skewed S&P 500 equal weight index has started to outperform the S&P 500 again, right on queue with the yield curve re-steepening.
Industrial stocks are under-performing the broader S&P 500 index as the curve flattens.
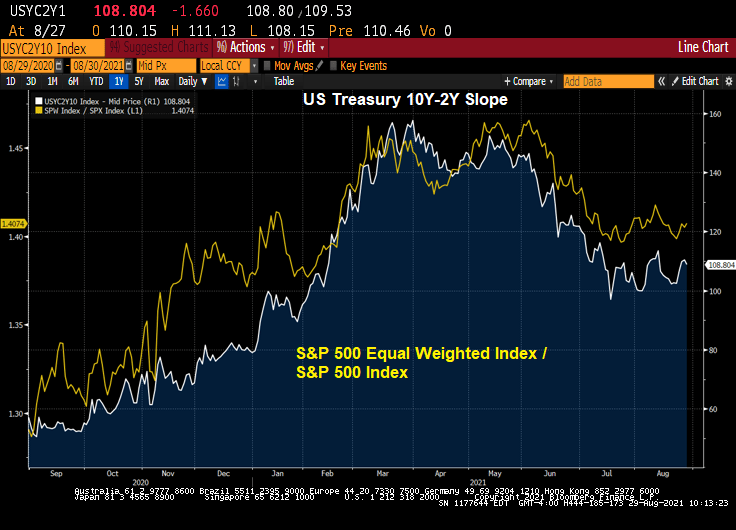
Real estate stocks? They are outperforming the broader S&P 500 index.
Mining stocks like gold mines? They are underperforming the broader S&P 500 index.
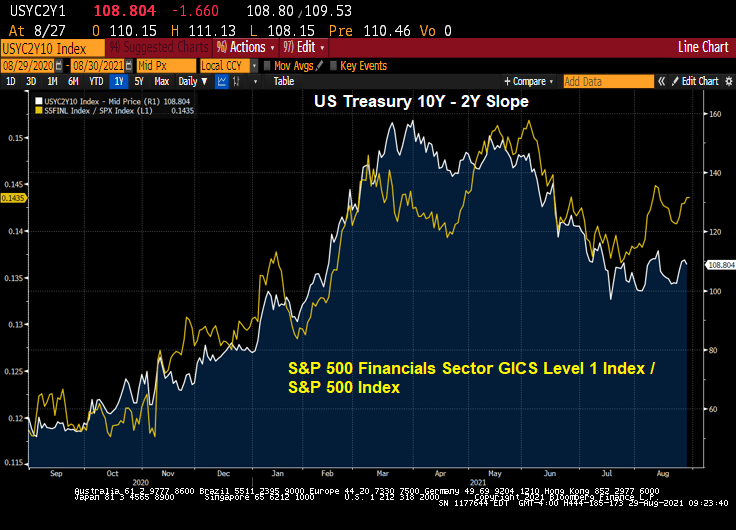
Financial stocks? Not surprisingly, The Fed’s dovish behavior is causing financial stocks to outperform the broader S&P index.
Likewise, information technology stocks are outperforming the broader S&P 500 index.
So, by Powell delaying any balance sheet slowdown and rate increases, we have clear winners (real estate, financials, information tech) and clear losers on a relative basis (industrials, retail, metals and mining).
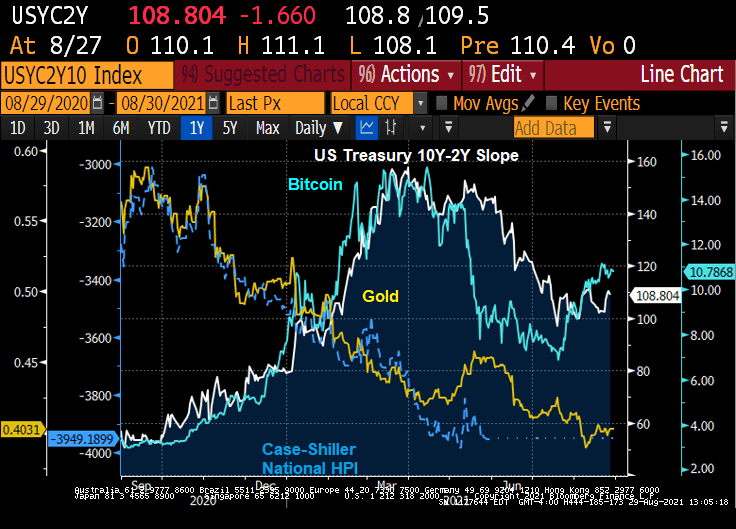
The Others! Due to volatility differences, I wouldn’t over-interpret this chart. But Bitcoin as a ratio of the S&P 500 index is “kicking ass!” Gold and housing as a ratio of the S&P 500 index seemingly can’t keep up with the S&P 500 index.
Powell and The Fed’s policies have veered from their mandate requiring Chairman Powell to meet 350 times with Congress to sell The Fed’s policies.
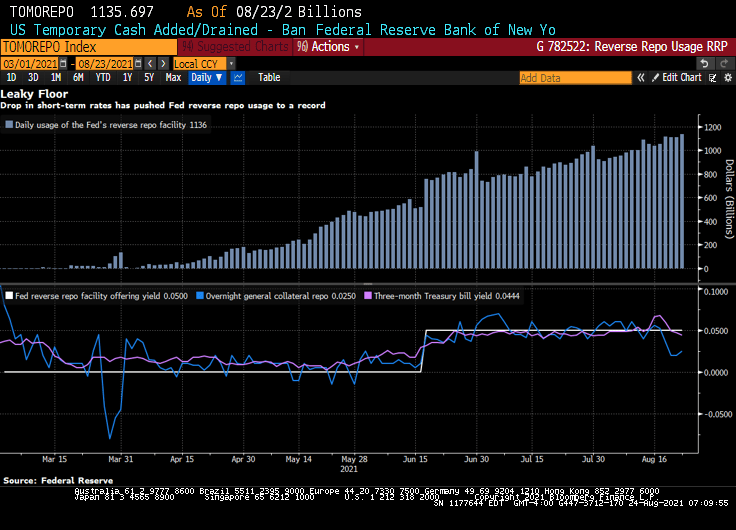
Bloomberg) — The Federal Reserve’s floor for overnight funding markets is proving to be no match for the deluge of cash.
Money-market securities ranging from Treasury bills to repurchase agreements continue to trade below 0.05% — the offering rate on the overnight reverse repo facility, which is supposed to act like a floor for the front end. The Fed at its June meeting had raised the rate by five basis points to help support the smooth functioning of short-term funding markets.
Still, usage of the tool climbed to a record $1.136 trillion on Monday, eclipsing the previous high of $1.116 trillion on Aug. 18.
Demand for the so-called RRP facility has surged as a flood of dollars threatens to overwhelm funding markets. That’s in part a result of the central bank’s long-standing asset purchases and drawdowns of the Treasury’s cash account, which is pushing reserves into the system. As a result, liquidity has been swelling, especially as the Treasury cuts supply to create more borrowing room under the debt ceiling.
The pressure pushing down overnight rates toward zero is proving a major headache for money-market funds. It hampers their ability to invest profitably, and can lead to further disruptions as they begin to waive fees to avoid passing on negative rates to shareholders. A number of firms including Vanguard Group shut down prime money-market funds last year after struggling to cover operating costs in the low-interest-rate environment.
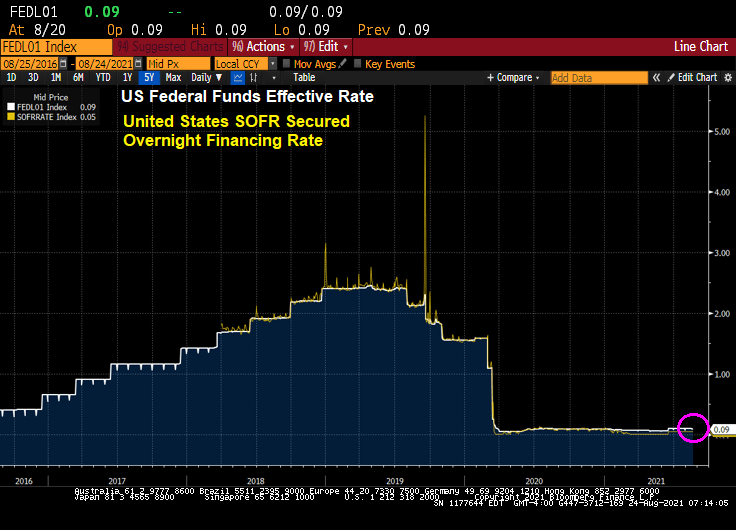
Yes, overnight rates such as the US SOFR rate, are near zero.
Powell’s Charm Offensive in Congress Positions Him to Keep Job
Perhaps that is why Federal Reserve Chair Jerome Powell is acting as a lobbyist with Congress for The Fed’s nontraditional approach to monetary policy.
(Bloomberg) Since he took the helm of the Fed in February 2018, through June of this year, he’s held at least 350 meetings, dinners or phone calls with members of Congress, according to his monthly calendars. That’s almost nine per month, and many of those included more than one lawmaker. The tally doesn’t count at least 16 appearances as chair before numerous congressional committees.
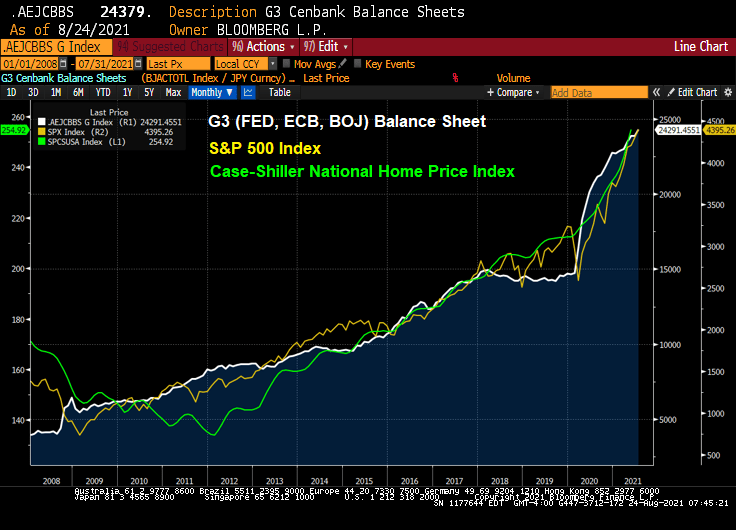
Well, the stock market has zoomed-up since Bernanke and The Fed adopted zero-interest rate (ZIRP) policies and the now famous quantitative easing (QE) policies in late 2008.
Congress member Alexandria Ocasio-Cortez asked Fed Chair Powell about the Fed helping with US unemployment. We are already at zero rates (on the short-end), and Congress should look at their policies on why labor force participation is slow to recover from the Covid epidemic.
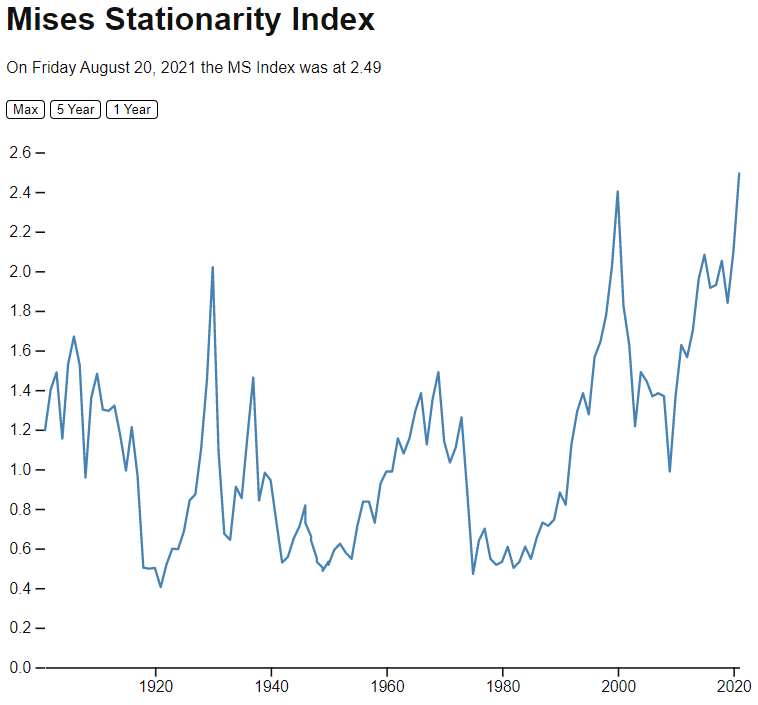
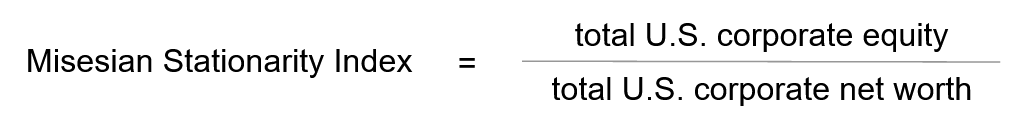
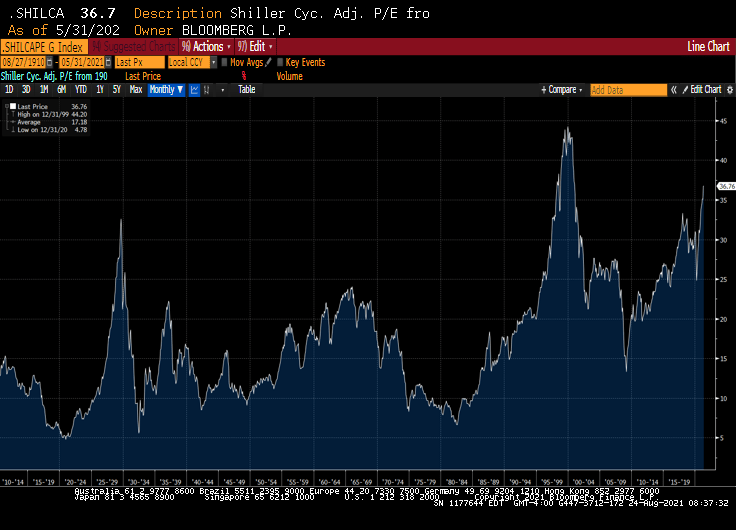
The Mises Stationarity Index is different than the Shiller CAPE index, which is showing equities as being overpriced, but not yet in dot.com bubble zone.
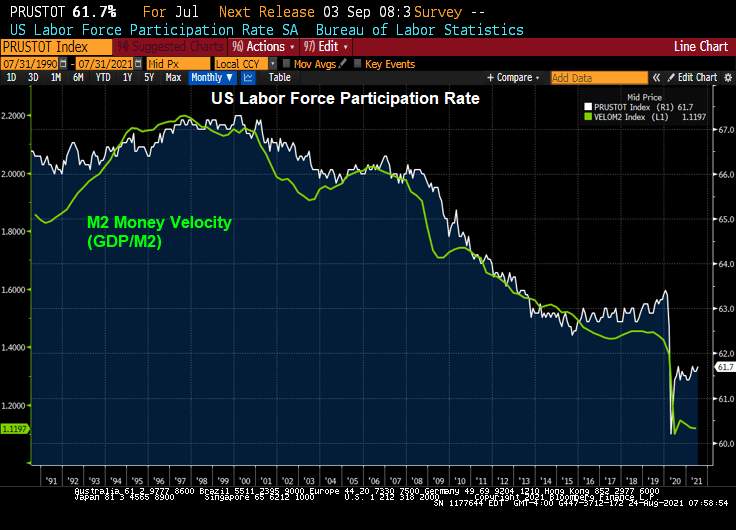
The purchasing power of the US Dollar has been virtually erased since the creation of The Federal Reserve in 1913 when $1,000 in 1913 is now worth $36.36. And M2 Money Velocity (GDP/M2 Money) has crashed and burned to the lowest level in history.
Inflation? Home price growth YoY is the highest in modern US history. And CPI growth YoY is the highest since the Financial Crisis and July 2008.
Bear in mind that before the creation of The Federal Reserve System in 1913, there were numerous incidents of inflation and bank failures leading banks to want protection of a national banking system that controlled the currency. Well, the banks got what they wanted.
The Fed is predicted to ease its foot off the printing press in the latter half of 2022.
The University of Michigan survey of consumers is out and their buying conditions for housing (good) was a disasters. Only 32% on consumers view buying conditions for a house as good. That means that 68% think buying conditions are not good. Why? With the Case-Shiller National Home Price Index growing at a scorching 16.6% YoY making housing simply unaffordable for many Americans.
On a different note, The Fed’s overnight reverse repo facility (aka, the slosh” just breached the $1 trillion mark.
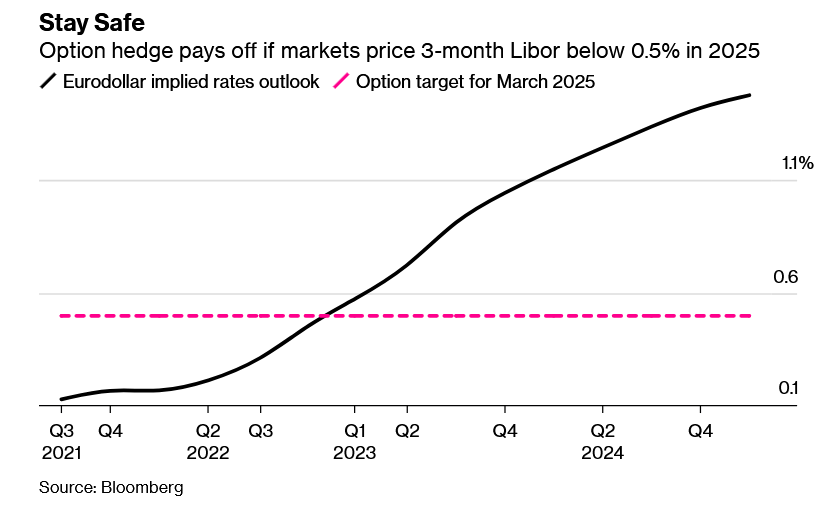
Treasury yields are rising amid optimism over the global recovery but there has been a run on Eurodollar options betting the Federal Reserve will opt not to raise interest rates at all.
Traders this week have been busy snapping up Eurodollar call options on underlying March 2025 futures that target three-month Libor to fix below 0.5%. These pay off if markets price the Fed keeping its benchmark at its lower bound until then. Futures markets are currently anticipating Libor will rise to about 1.47% by the first quarter of 2025.
So, it looks like The Fed (aka, Greenman) may not be going anywhere.


You must be logged in to post a comment.