The last mortgage purchase applications index from the Mortgage Bankers Association was released this morning. The headline is “Mortgage Purchase Applications Plunge 10% WoW (since the previous week). But this is called “Seasonality.” And it happens EVERY YEAR.
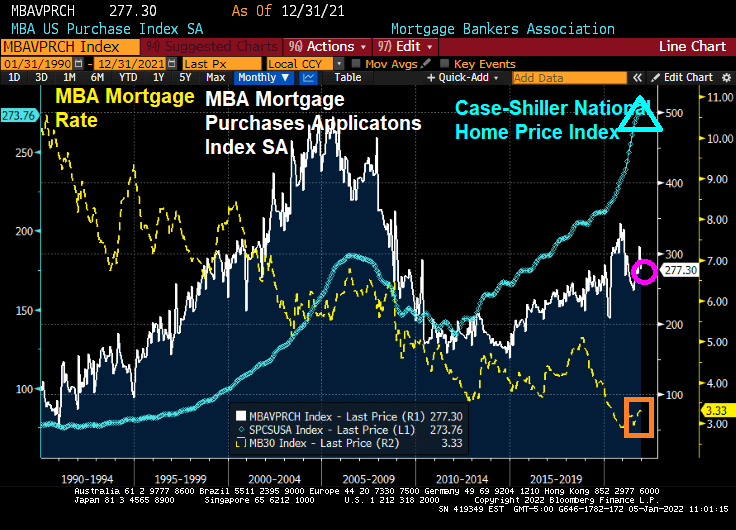
Here is a chart of mortgage purchase application (NON-seasonally adjusted). What will happen when the new year starts and purchase applications began rising?
Whether seasonally-adjusted or not, all number are down for the final week of 2021, except for the 30-year mortgage rate that rose 60 basis points.
On a seasonally-adjusted basis (aka, smoothed-out), we can see the impact of super-low mortgage rates on home prices.
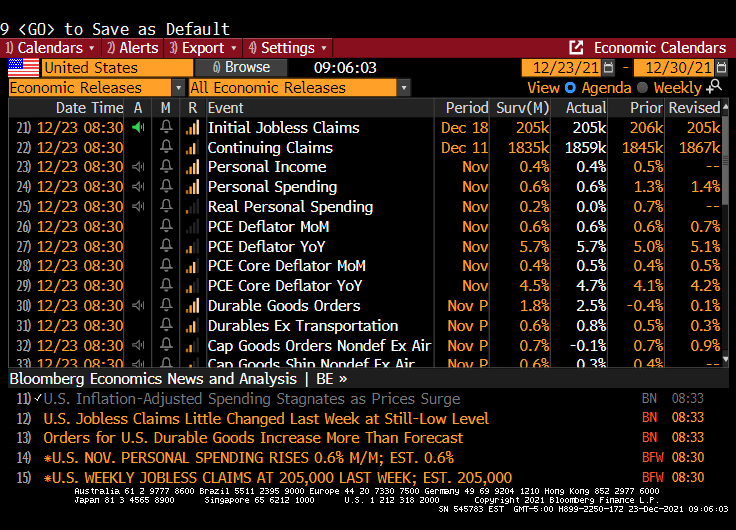
Here is the data summary for the last week of December 2021. All indices are down … except for the 30 year mortgage rate which was up 60 basis points.
Treasury yields rose a second day, with five-year rates hitting the highest since before the pandemic took hold in the U.S., amid increasing conviction that the Federal Reserve will raise rates at least three times beginning in May.
The five-year Treasury note’s yield climbed as much as 3.8 basis points to 1.392%, the highest since Feb. 20, 2020, while 30-year yields bumped up toward their 200-day moving average.
Yields across the curve are rising for a second straight day, after Monday’s selloff lifted the 10-year note’s yield by nearly 12 basis points in its worst start to a year since 2009. The two-year yield topped 0.80% for the first time since March 2020.
At the 10-year mark, we see Canada’s sovereign notes rising 18.7 basis points.
Also at the 10 year mark, we see the US 1-year breakeven inflation rate (red line) surging.
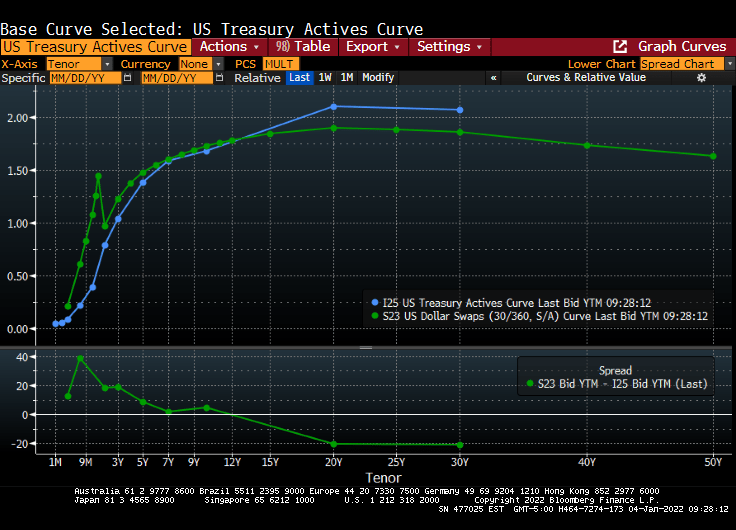
The US Treasury actives curve and Dollar Swaps curve remain steeply upward sloping.
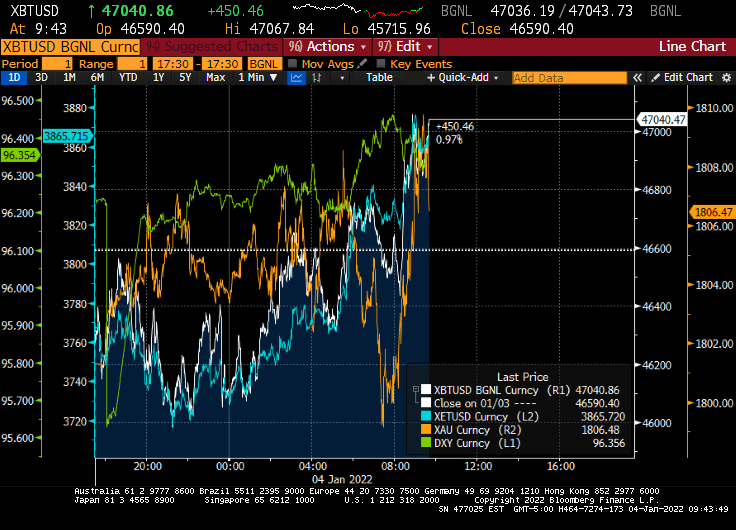
And on the crypto and gold front, gold surged this morning after tanking in the evening, while Ethereum (blue) is doing quite well along with Bitcoin.
My favorite non-bond, non-alt investment chart. The S&P 500 index charted against The Fed’s M2 Money Stock.
Following my friend Jesse’s habit of posting great French food dishes, here is one from my favorite Parisian eatery, Le Duc de Richelieu. Mmmmmmm.
Happy New Year! And Treasuries are off to fast start with investors bailing on Treasuries and buying stocks. AND the expectation that The Fed will raise rates 3 times this year.
The 10-year Treasury Note yield rose above 1.60% this morning.
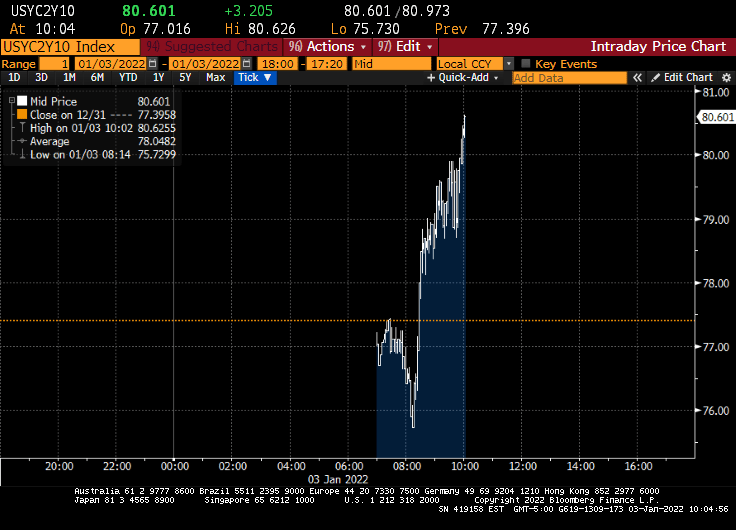
And the US Treasury 10Y-2Y curve rose to 80.601 basis points.
Fed Funds Futures data is showing 3 rates hikes in 2022. May, September and December.
The Fed Dots project is definitely showing an upward trend in the Fed Funds Target rate with FOMC member forecasting the median target rate to be above 2% by 2024.
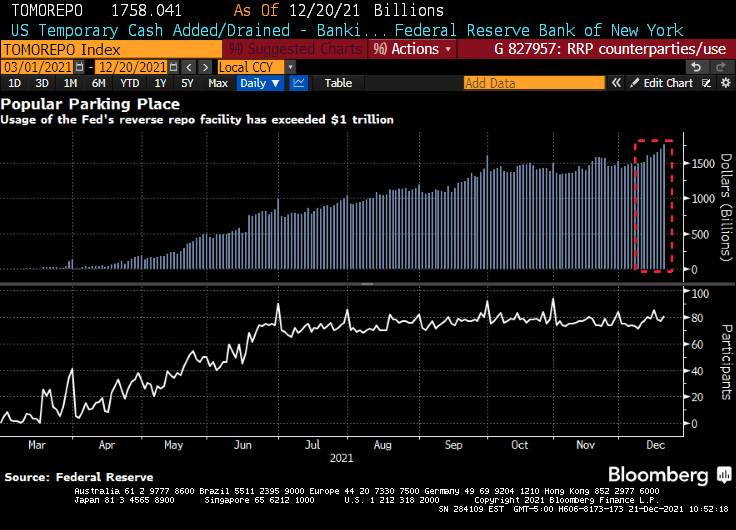
Of course, Fed reverse repo activity grew to an all-time high (but it is expected to pare-back).
How about mortgage rates? I expect mortgages rates to rise over 2022 as the 10-year Treasury Note rises.
Cautionary note: The Fed is likely to protect economic growth and ignore inflation. So I expect FOMC will continue to reinvest prepayments into Treasury and MBS, pro-rata to the current portfolio.
A good quote from The Hill story: “Under Biden, the American economy has recovered from its Trump-era lows with remarkable speed.” As Leslie Knope said “That seems like an unfair phrasing.”
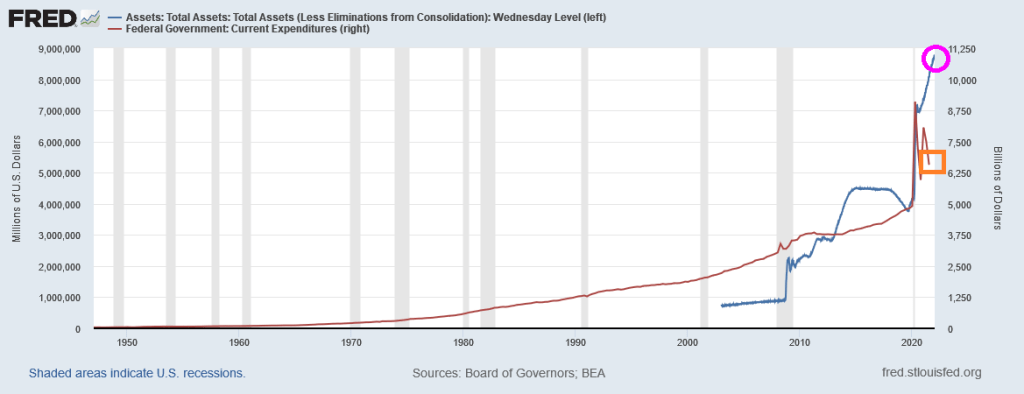
Hmm. Well, here is a chart that best explains the “Biden Miracle.” It shows the growth in Federal expenditures from the previous year during the banking crisis and then the COVID crisis. During the banking crisis, the increase in Federal expenditures (red) was normal. It was the increase in The Fed’s balance sheet (blue) that was staggering. But for the mini-recession related to COVID (only two months so you can barely see it on the chart below), it was the growth in Federal expenditures (red) combined with another round of staggering Federal Reserve stimulus (blue).
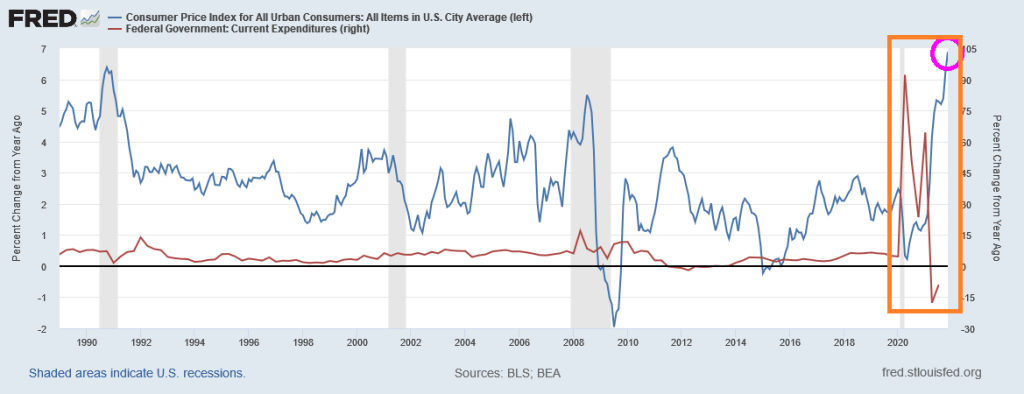
A different view of Federal “Stimulypto” is show below. Since COVID and the election of Joe Biden as President, Fed monetary stimulus is at an all-time high and Federal expenditures, while they have slowed, are still above the pre-COVID spending levels.
Please note that the massive surge in Federal expenditures and Fed monetary stimulus began under Trump, but were only continued under Biden. That is why no one notices … it was Trump.
And if we look at the 10Y-2Y Treasury curve slope, the US is slippin’ into darkness since the slope typically rises after a recession, then falls. And we are in the falling (or slippin’) stage.
So, President Biden is benefiting from Trump’s and The Fed’s Stimulypto. I don’t expect partisan outlets like The Hill or crooner Barbra Streisand to look at the data.
With Build Back (Inflation) Better not passing in the US Senate, I fully expect The Federal Reserve to continue “low riding” interest rates. Inflation will probably cool as well as Federal expenditure growth slows.
So, Streisand’s statement should have said “Joe Biden’s economic record in his first year is the best in 40 years. The media largely ignores this … because the unsustainable Federal stimulus began under Trump, not Biden.”
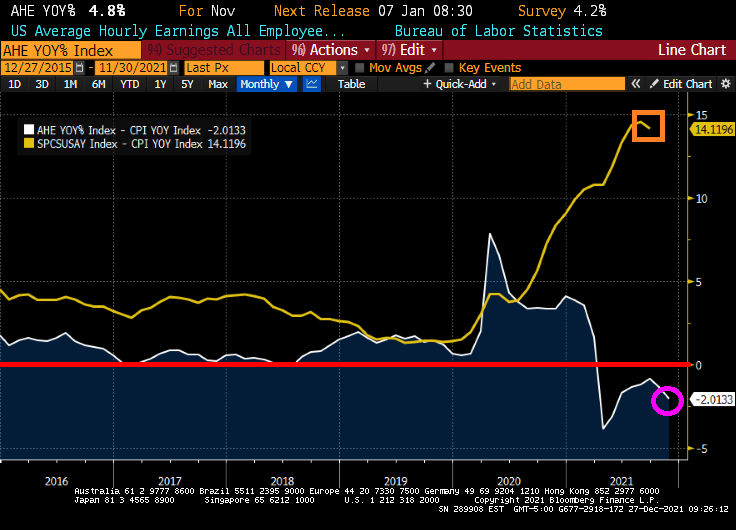
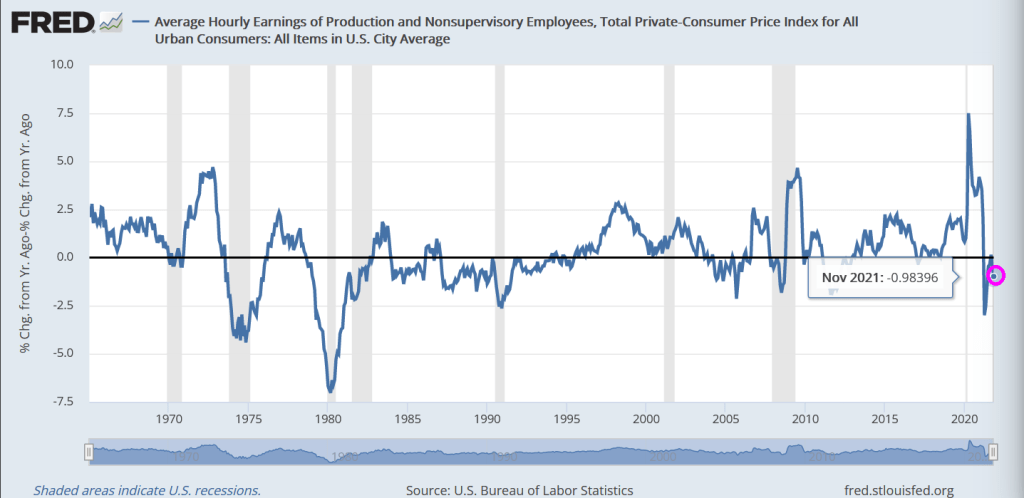
Another thing The Hill and Barbra Streisand left out was declining REAL average hourly earnings growth (that is, average hourly earnings YoY – inflation).
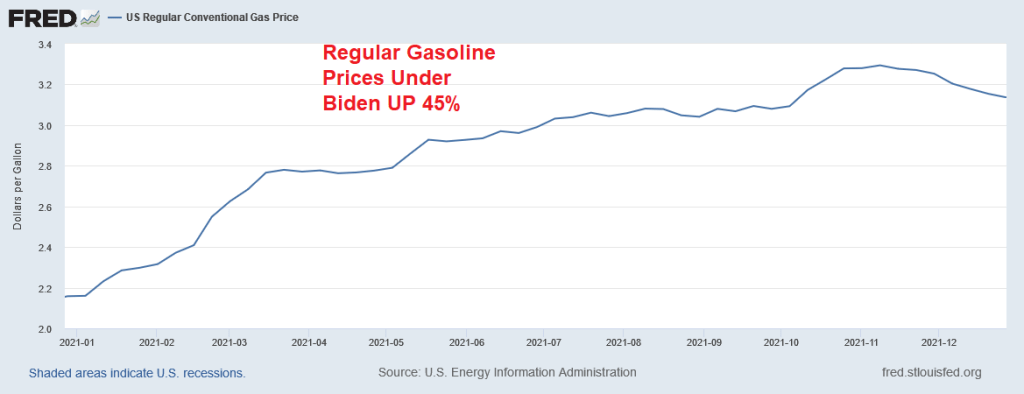
Biden’s real contribution? Anti-fossil fuels actions have driven up energy prices. Regular gasoline prices, for example, are up 45% under Biden.
If The Fed actually follows through and removes COVID stimulus and Congress doesn’t keep the incredible rate Federal spending growing, I sincerely doubt that GDP will continue at this hot pace.
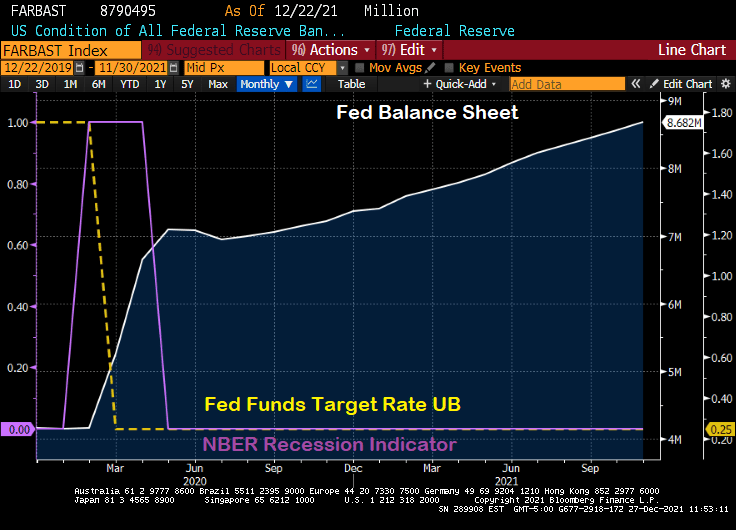
The global economy has certainly been turned on its head by the COVID outbreak in early 2020. Not so much by the virus itself, but by Central Bank hysteria in terms of rate lowering and balance sheet expansion. Which The Fed has not yet unwound.
Let’s look at what has happened since the mini-recession caused by COVID in early 2020. The shortest recession in US history, a measly 2 months. The Fed expanded its balance sheet from $4.17 million in February 2020 to $8.79 million today. That is, The Fed over doubled the size of their balance sheet in reaction to the shortest recession in US history. Overreaction much?
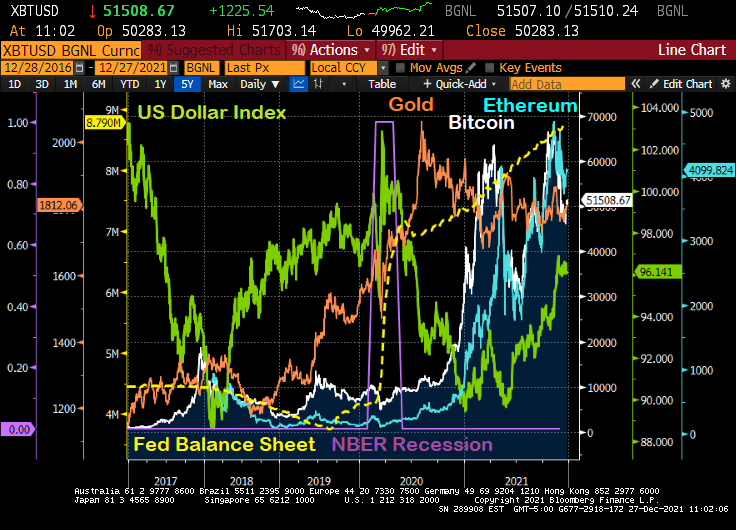
What has happened since the mini-recession and The Fed’s massive overreaction?
First, gold (gold line) surged then calmed down. Then cryptocurrency Bitcoin (while line) surged, then calmed down, then surged again only to calm down again. Then crypto Ethereum surged, calmed, surged, calmed. Meanwhile the US Dollar Index crashed only to start rising again.
The Fed’s overreaction and failure to withdraw excessive stimulus has led to the rise of alternatives to the deflating dollar due to inflation.
When will The Fed ACTUALLY start removing the overreaction stimulus? Let’s get it started.
Perhaps only April Ludgate can kill The Fed’s overreaction stimulus.
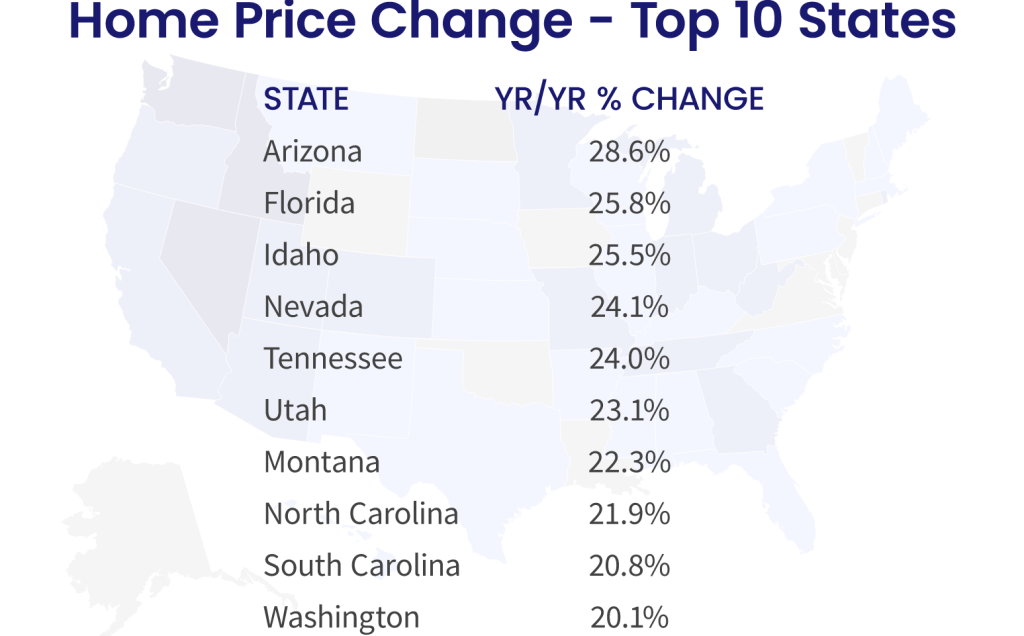
Housing in the US is getting “simply unaffordable.” And it has gotten far worse over the past year. Thanks to BAD government policies.
While wage growth is positive, inflation is sucking the life from consumers. REAL average hourly earnings growth is -2.0133%. Even worse, home prices are rising at a 14.12% pace in REAL terms. So, wages are losing to inflation and housing is pulling away from renters in terms of affordability.`
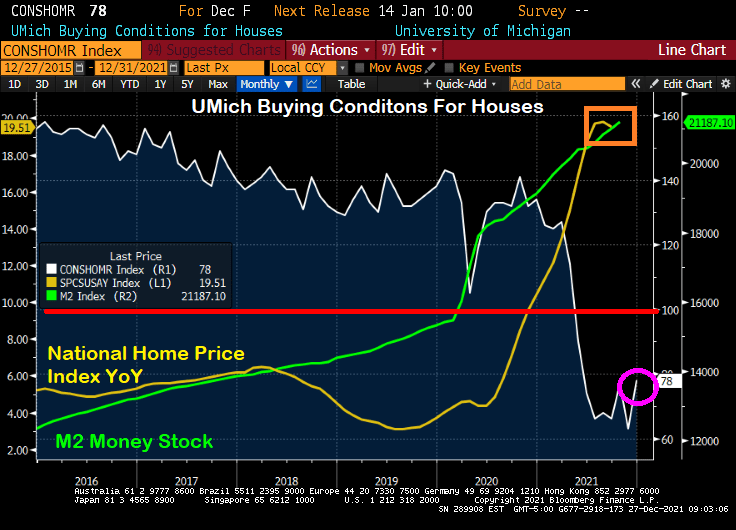
So it is not surprising that the University of Michigan consumer survey for “Buying Conditions For Housing” remains below 100 (meaning that more people think buying conditions for housing are negative than positive). With the Case-Shiller National home price index growing at a 19.51% YoY pace, it is no wonder that consumers are getting scared of the housing market.
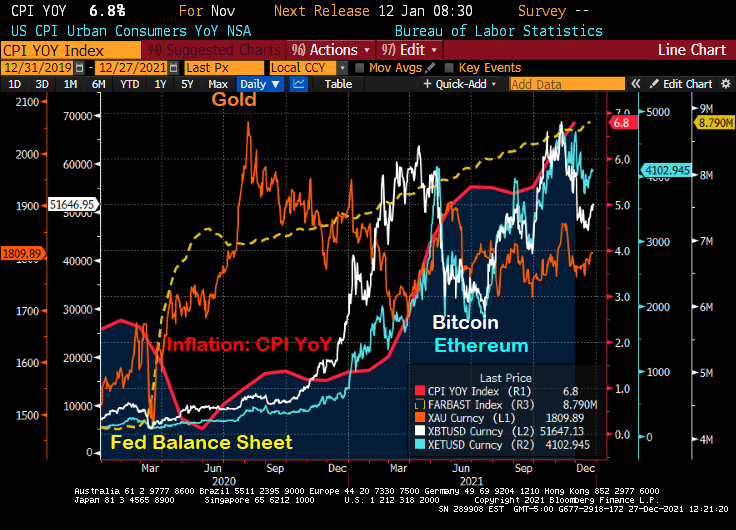
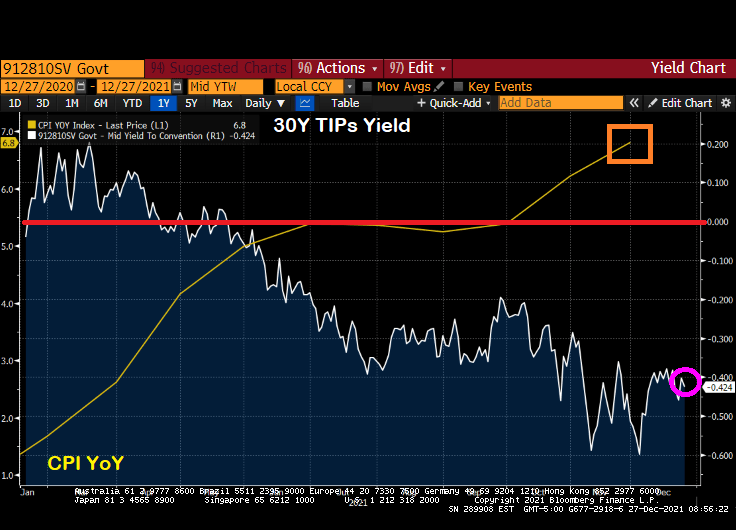
Yes, US inflation is at a 40-year high and the 30-year Treasury Inflation Protected (TIP) yields is at -0.424%. That says quite a bit about the pickle US consumers are in.
US consumer confidence overall has declined to the lowest level since just after the financial crisis and housing bubble burst of 2008-9.
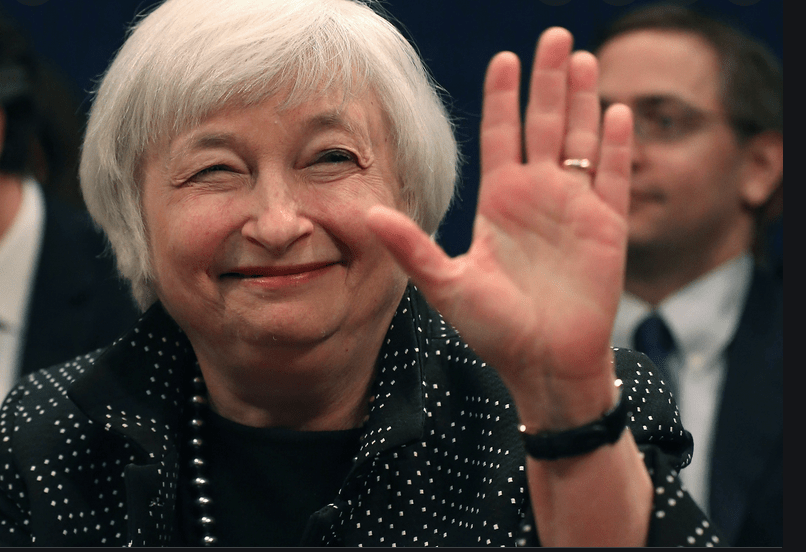
Doctor, Doctor (Yellen), please don’t try to make housing more “affordable” which will result in housing being even LESS affordable.
But I do like how Biden took credit for lowering gasoline prices a little after his anti-energy policies drove up gasoline prices in the first place from $2.20 to $3.40 a gallon, a 55% price increase. Thanks for nothing, Joe!
And with Omicron raging (with few reported deaths), Anthony Fauci, President Biden’s top medical adviser, indicated support for making vaccinations a requirement for domestic fights.
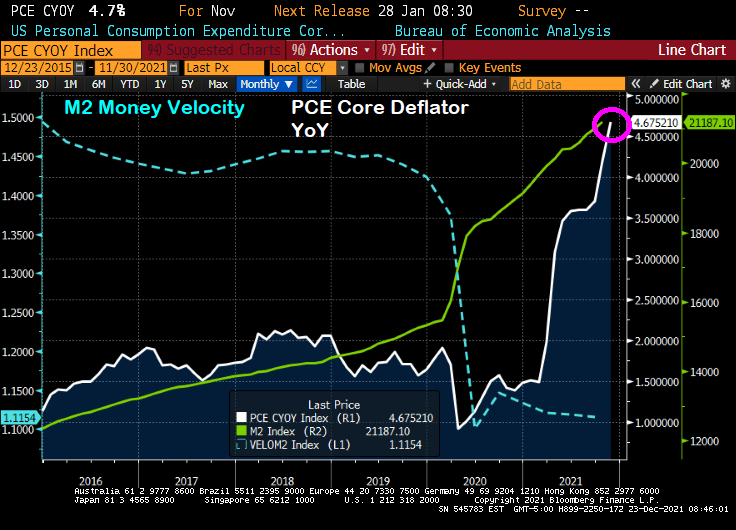
The core Personal Consumption Expenditures (PCE) deflator numbers for November were released this morning and the print was a whopping 4.7% YoY, the highest rate since 1989.
Meanwhile, U.S. consumer spending, adjusted for inflation (aka, REAL personal spending), stagnated in November as the fastest price gains in nearly four decades eroded purchasing power. Stagnated to 0.
Purchases of goods and services, after adjusting for higher prices, were little changed following a 0.7% gain in October, Commerce Department figures showed Thursday.
And as Paul Harvey would say, here is the rest of the story.
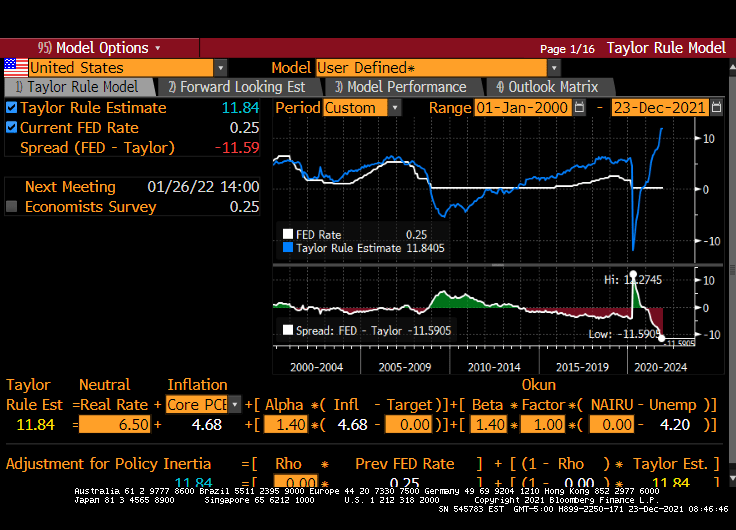
Core PCE growth YoY of 4.68% implies a Fed Funds target rate of 11.84%. Powell and the gang have the target rate at 0.25%. But the Taylor Rule doesn’t take into account the latest FEAR raging in Washington DC … the Omicron variant. Just another excuse for The Fed to do nothing and let asset bubbles blow out of control.
(Bloomberg) — The amount of money that investors are parking at a major central bank facility climbed to yet another all-time high as supply-demand imbalances continue to dog U.S. dollar funding markets.
Eighty-one participants on Monday placed a total of $1.758 trillion at the Federal Reserve’s overnight reverse repurchase agreement facility, in which counterparties like money-market funds can place cash with the central bank. That surpassed the previous record volume of $1.705 trillion from Dec. 17, New York Fed data show.
Demand for the so-called RRP has climbed further as principal and interest payments from government-sponsored enterprises has entered short-end funding markets. However, that cash is expected to exit the overnight space by the end of the week as the Treasury ramps up its issuance of Treasury bills now that Congress has increased the debt limit.
Overall volume has been rising this year as a flood of cash continues to overwhelm the U.S. dollar funding markets due to central-bank asset purchases and the drawdown of the Treasury’s cash account, which is pushing reserves into the system. The larger takeup looks set to persist even as the Fed tapers its asset-purchase program — something it began this month — because the supply-demand imbalances in short-end securities are likely to persist.
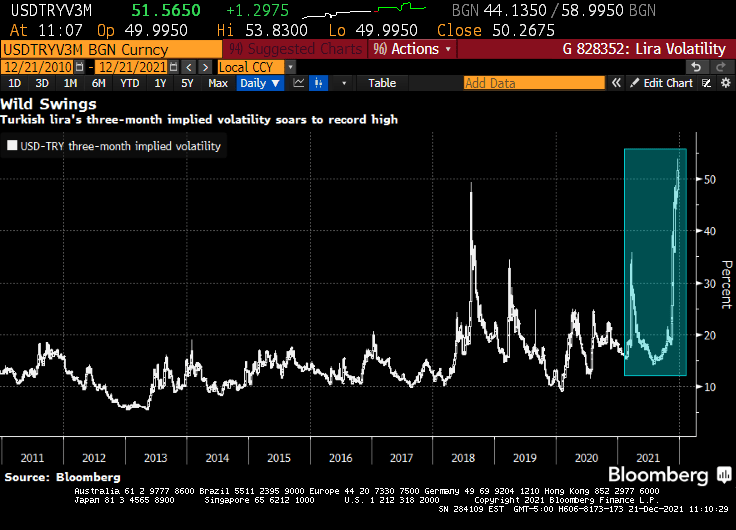
Then we have the Turkish Lira volatility hitting an all-time high.
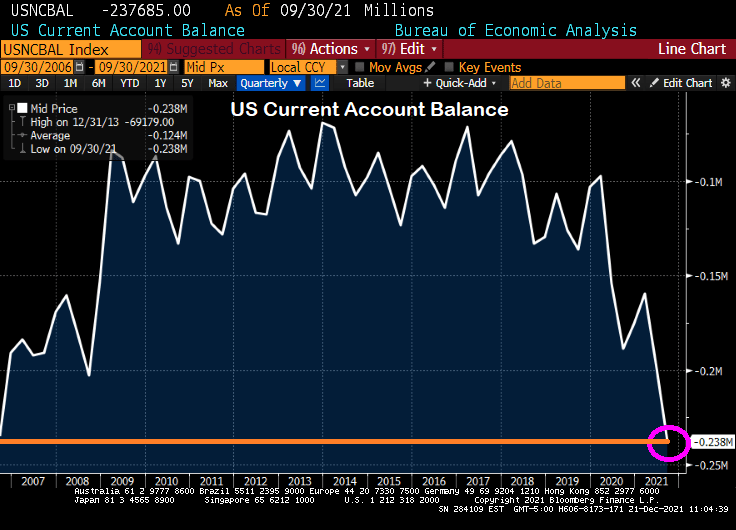
And finally we have the US Current Account Balance rising to levels last seen in 2006 just after the peak of the US housing bubble.
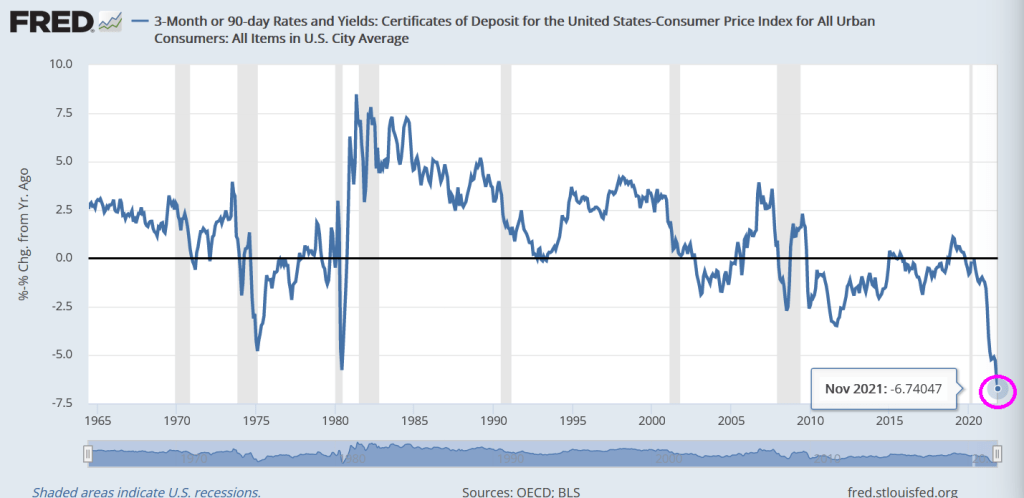
The Federal Reserve’s zero-interest rate policies (ZIRP) has The Fed Funds Target Rate at a measly 25 basis points or 0.25%. While this is great for some, it is disastrous for savers. Once we subtract off the inflation rate (CPI YoY), we find that the REAL 90-day Certificate of Deposit (CD) rate is a horrifying -6.74%.
I don’t think that Congress or the Biden Administration really think about how their spending may contribute to inflation and crush savers. Or the American worker who is seeing NEGATIVE real average hourly earnings growth (yes, Biden said that Americans have more money this holiday season … but not if we account for reduced spending power, also known as inflation.
Here is US Treasury Secretary Janet Yellen singing “Goodbye Savers.”
Goodbye Savers Will we ever meet again Feel sorrow, feel shame Come tomorrow, feel lots of pain


You must be logged in to post a comment.