Homebuying Startup Orchard Reaches $1 Billion Unicorn Valuation (But What Is House Price Growth Slows … Or Falls??)

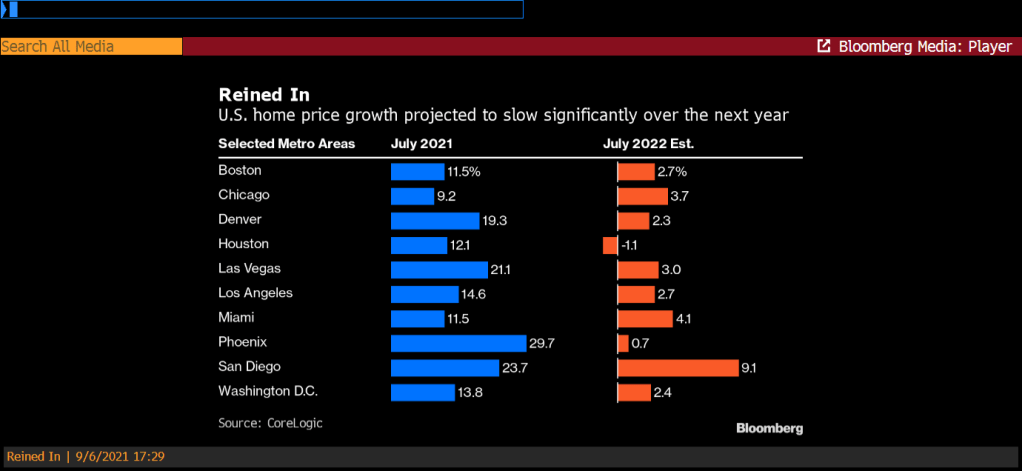
Let’s get ready to tumble! New homebuying startup emerges as US house prices begin slowing.

(Bloomberg) — Orchard, which offers cash to homebuyers upfront so they can purchase a new residence before selling their old one, raised $100 million to fuel growth in an ultra-competitive housing market that’s pushing shoppers to find new ways to stand out.

The fundraising round values the startup at more than $1 billion, making it the latest unicorn company to tackle the challenge of simplifying the process of buying or selling a home. Boston-based Accomplice led the round, with existing investors FirstMark, Revolution, First American and Juxtapose also participating.

“We can say we’re a unicorn, which feels good for about five seconds, and then it’s back to the real world of building a business,” Chief Executive Officer Court Cunningham said in an interview. “We’re trying to create a modern way to buy and sell homes, and that’s capital intensive.”

Cunningham, previously CEO of online marketing company Yodle, started Orchard in 2017 to take on what he viewed as a ripe opportunity: Consumers were frustrated with the traditional way of buying and selling homes, and the $1.7 trillion U.S. housing market was big enough to make tackling the problem worthwhile.

Orchard focuses on people who are trying to buy their next home while selling an existing one, a nerve-wracking process that can cause a transaction to collapse or result in households carrying two mortgages.
In addition to offering cash to help clients buy their next home, the New York-based company provides funds to make light repairs before listing the existing home on the market. Orchard seeks to profit by operating as a brokerage and earning commissions.

There have always been services that purchase homes from you. Typically, there firms simply pay off your mortgage, so if you have a higher mortgage balance relative to you home value, you may not like what you are offered. But Orchard is not that model.

If you “List with Orchard,” and your home doesn’t end up selling on the open market, Orchard will buy your home. Sellers in some markets also have the option to sell immediately to the company. Orchard wants you to list for 30 days before selling to them for their backup cash offer price. If you sell directly to Orchard, you’ll also pay an additional 1% convenience fee on top of the 6% you’re already paying commission.

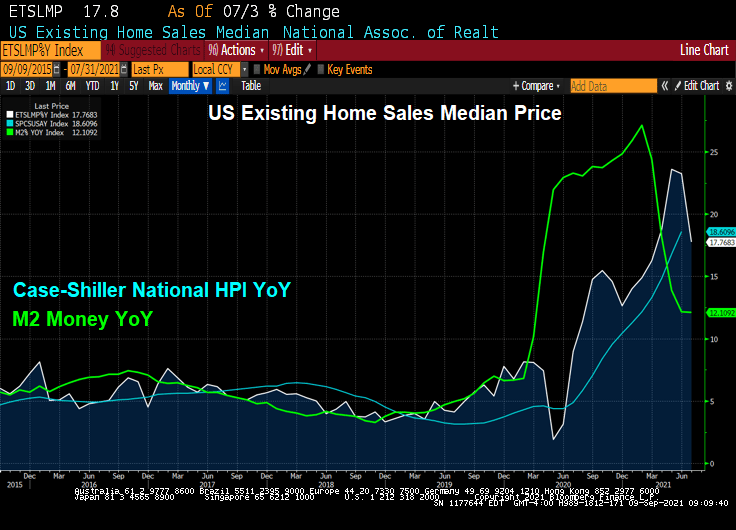
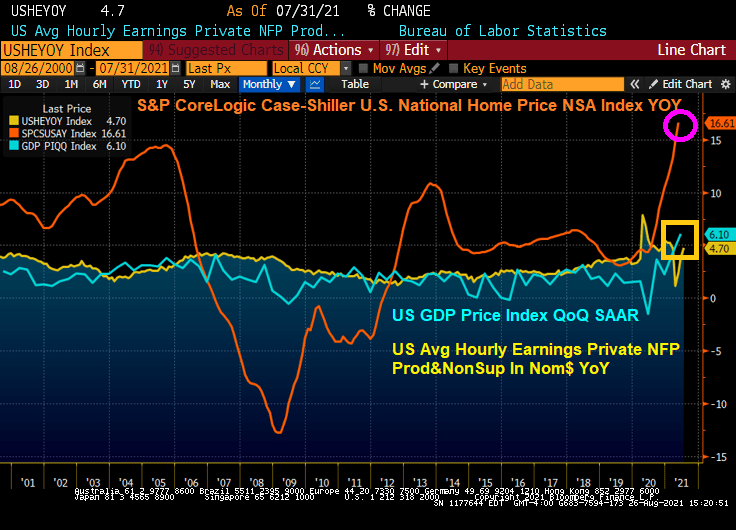
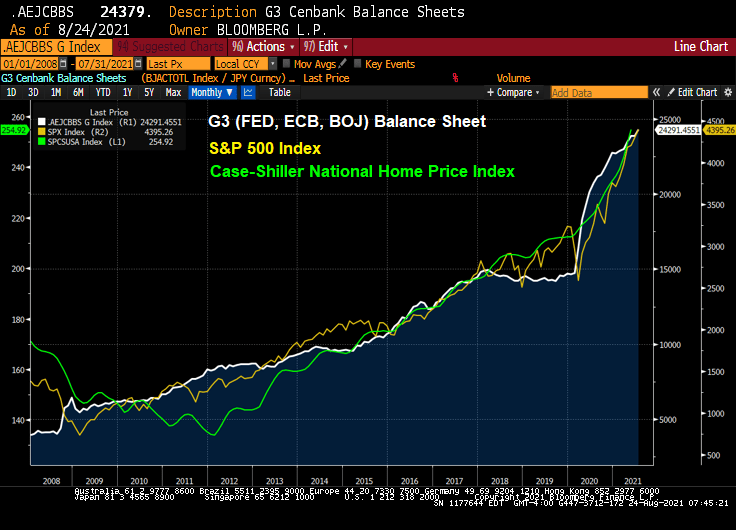
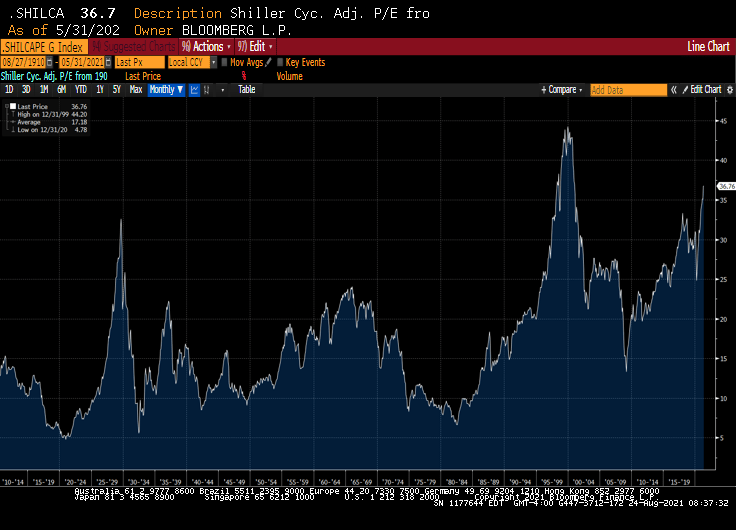
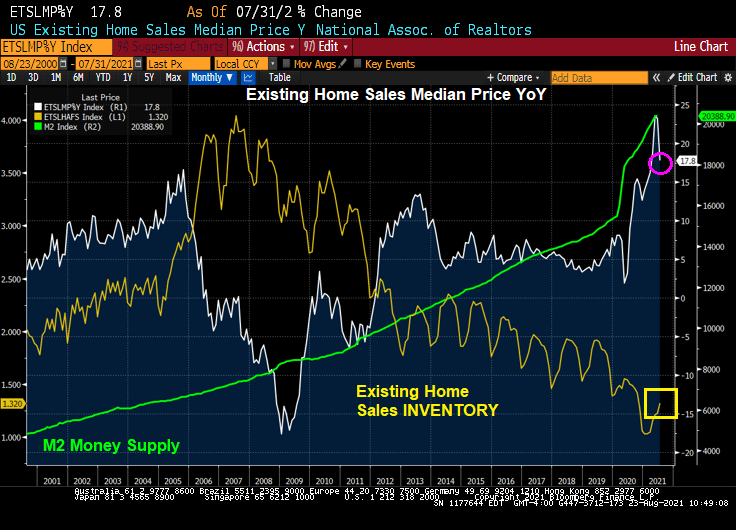
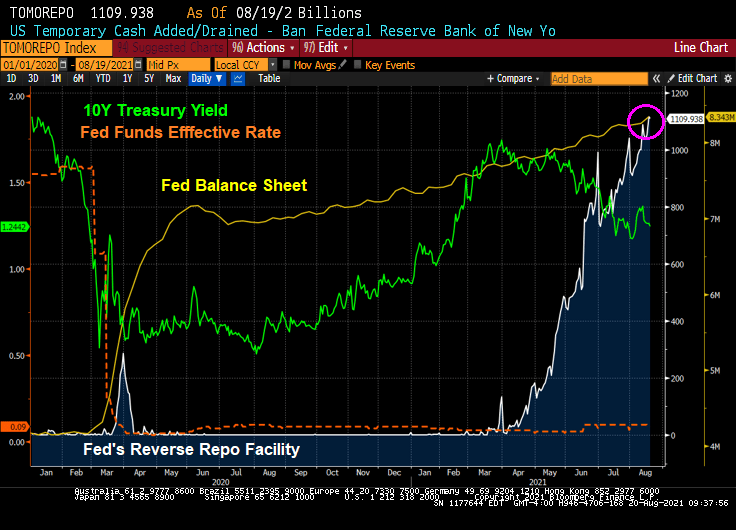
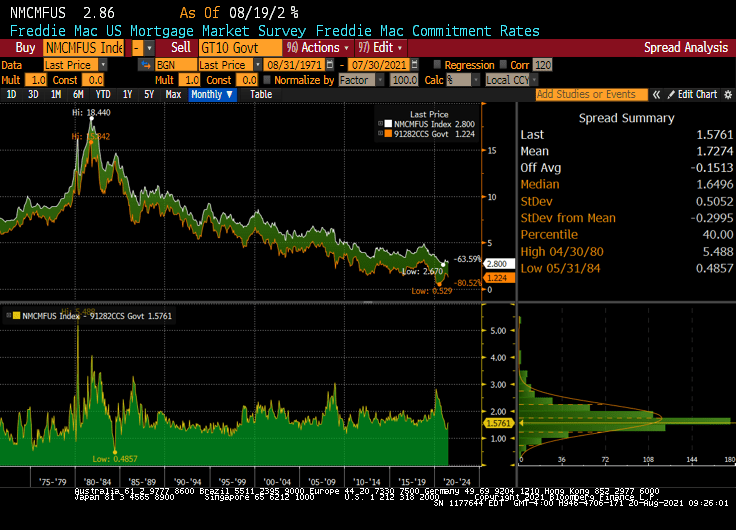
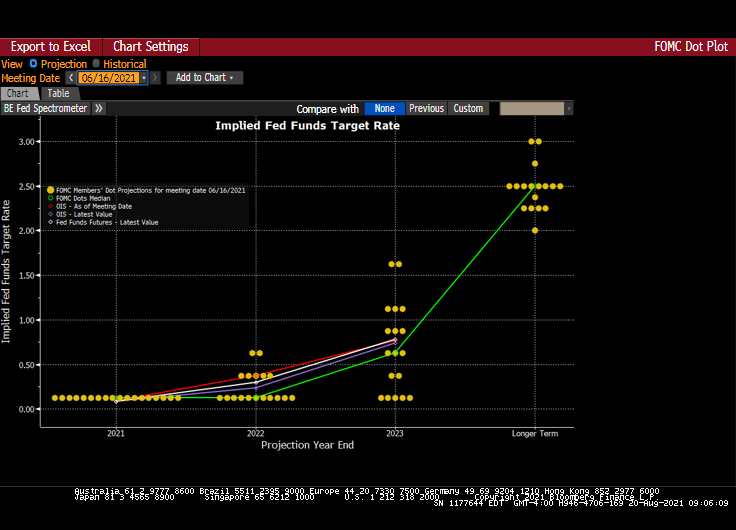
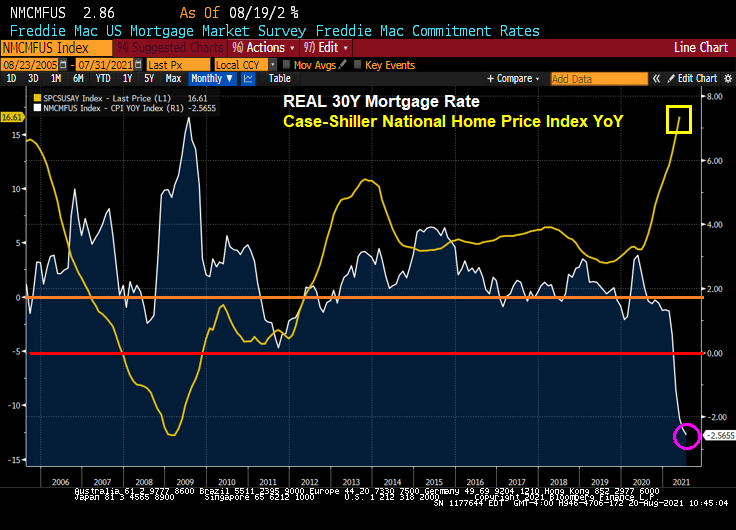
When home prices have been rising at a 17-18% YoY pace, this seems like a good model. But what if The Federal Reserve removes it massive monetary stimulus and/or The Federal Government slows down it fiscal stimulus? Then Orchard, if they purchase your home, will likely lose considerable amounts. Being aware of this possibility, Orchard is likely to buy homes at a considerable discount.

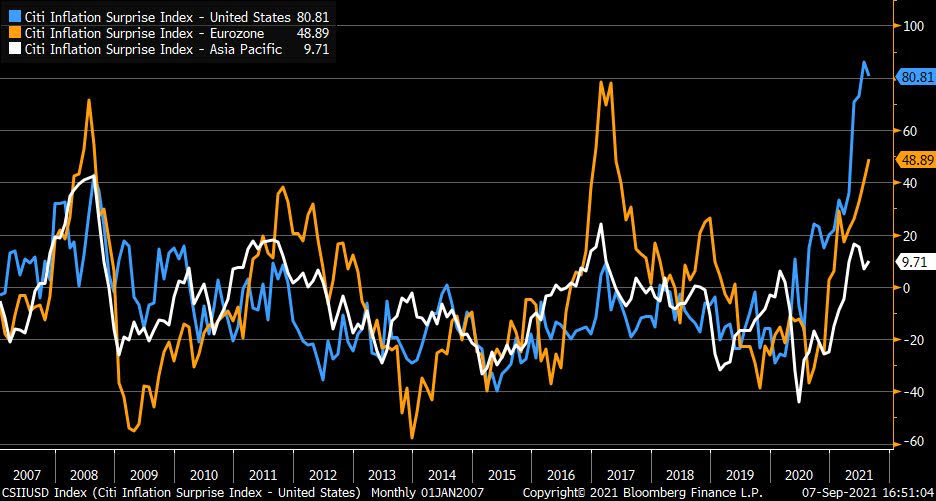
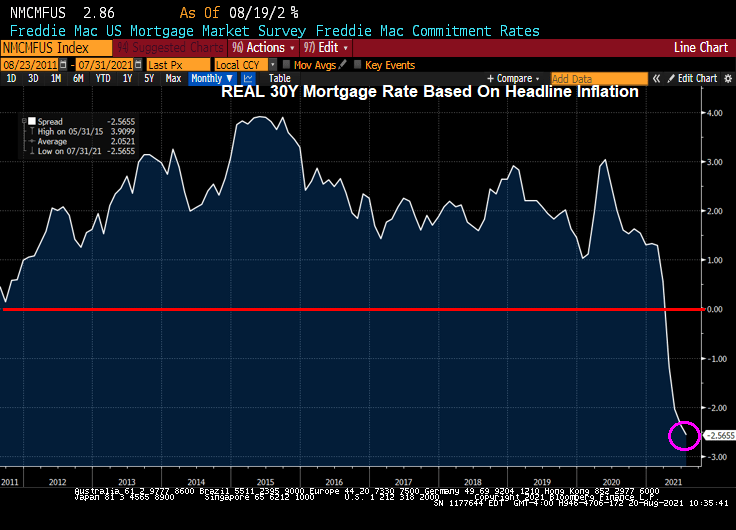
But there is still worries about inflation. Here is the Citi Inflation Surprise index.

Orchard has a northern Virginia site.

Publicly traded companies known as iBuyers are pioneering a high-tech approach to home-flipping intended to make selling properties easier. Those firms include Opendoor Technologies Inc., Redfin Corp., and Offerpad Solutions Inc. A fourth, Zillow Group Inc., recently raised $450 million by issuing bonds, backed by the homes it buys and sells.

Whoomp, there it is.

The Fed’s Little Beige Book: Keyword? SHORTAGES!

The Fed’s Little Beige Book. Keyword? SHORTAGES!

Overall Economic Activity:

  • Economic growth downshifted slightly to a moderate pace in early July through August. The stronger sectors of the economy of late included manufacturing, transportation, nonfinancial services, and residential real estate. The deceleration in economic activity was largely attributable to a pullback in dining out, travel, and tourism in most Districts, reflecting safety concerns due to the rise of the Delta variant, and, in a few cases, international travel restrictions.
  • The other sectors of the economy where growth slowed or activity declined were those constrained by supply disruptions and labor shortages, as opposed to softening demand. In particular, weakness in auto sales was widely ascribed to low inventories amidst the ongoing microchip shortage, and restrained home sales activity was attributed to low supply.
  • Growth in non-auto retail sales slowed a bit in some Districts, rising at a modest pace, on balance, across the nation.
  • Residential construction was up slightly, on balance, and nonresidential construction picked up modestly.
  • Trends in loan volumes varied widely across Districts, ranging from down modestly to up strongly.
  • Reports on the agriculture and energy sectors were mixed across Districts but, on balance, positive.
  • Looking ahead, businesses in most Districts remained optimistic about near-term prospects, though there continued to be widespread concern about ongoing supply disruptions and resource shortages.

Employment and Wages:

  • All Districts continued to report rising employment overall, though the characterization of the pace of job creation ranged from slight to strong.
  • Demand for workers continued to strengthen, but all Districts noted extensive labor shortages that were constraining employment and, in many cases, impeding business activity.
  • Contributing to these shortages were increased turnover, early retirements (especially in health care), childcare needs, challenges in negotiating job offers, and enhanced unemployment benefits.
  • Some Districts noted that return-to-work schedules were pushed back due to the increase in the Delta variant.
  • With persistent and extensive labor shortages, a number of Districts reported an acceleration in wages, and most characterized wage growth as strong—including all of the midwestern and western regions.
  • Several Districts noted particularly brisk wage gains among lower-wage workers.
  • Employers were reported to be using more frequent raises, bonuses, training, and flexible work arrangements to attract and retain workers.

Prices:

  • Inflation was reported to be steady at an elevated pace, as half of the Districts characterized the pace of price increases as strong, while half described it as moderate.
  • With pervasive resource shortages, input price pressures continued to be widespread.
  • Most Districts noted substantial escalation in the cost of metals and metal-based products, freight and transportation services, and construction materials, with the notable exception of lumber whose cost has retreated from exceptionally high levels.
  • Even at greatly increased prices, many businesses reported having trouble sourcing key inputs.
  • Some Districts reported that businesses are finding it easier to pass along more cost increases through higher prices.
  • Several Districts indicated that businesses anticipate significant hikes in their selling prices in the months ahead.

Here are the highlights by Regional Feds:

  • Boston: Economic activity in the First District expanded at a modest to strong pace over the summer of 2021. Contacts reported higher prices and wages but complained more about an inability to get supplies and to hire workers. Contacts were optimistic and hoped supply issues would ease in 2022.
  • New York: Growth in the regional economy moderated, though contacts remained optimistic about the near-term outlook. Employment and wages increased, with businesses reporting widespread labor shortages. Tourism leveled off, and service-sector businesses reported some deceleration in activity. Input price pressures remained widespread, and more businesses have raised or plan to raise their selling prices.
  • Philadelphia: Business activity continued at a moderate pace of growth during the current Beige Book period – still below levels attained prior to the pandemic. The rise of Delta variant cases has trimmed growth in some sectors, while labor shortages and supply chain disruptions continued apace. Overall, wage growth increased to a moderate pace, while prices continued growing moderately and employment continued to grow modestly.
  • Cleveland: Economic activity grew solidly, but supply constraints limited many firms’ ability to meet demand. Staff levels increased modestly amid intense labor shortages. Reports of rising nonlabor costs, wages, and prices continued to be widespread. Firms expected demand would remain strong in the near term, but they were less optimistic that labor and supply challenges would abate enough to ease the upward pressure on wages and costs.
  • Richmond: The regional economy expanded moderately, but many firms faced shortages and higher costs for both labor and non-labor inputs. Port and trucking volumes picked up from already high levels, but manufacturers and services firms experienced delays and long lead times for goods. Employment rose moderately as labor shortages and wage increases were widely reported. Price growth picked up and was robust compared to last year.
  • Atlanta: Economic activity expanded moderately. Labor markets improved and wage pressures became more widespread. Some nonlabor costs rose. Retail sales increased. Leisure travel was strong and hotel occupancy levels rose. Residential real estate demand remained solid. Commercial real estate conditions were steady. Manufacturing activity expanded. Banking conditions were stable.
  • Chicago: Economic activity increased moderately. Employment increased strongly, manufacturing grew moderately, business spending was up modestly, construction and real estate rose slightly, and consumer spending decreased slightly. Wages and prices increased strongly while financial conditions slightly improved. There was some retreat in prospects for agricultural income.
  • St. Louis: Economic conditions have continued to improve at a moderate pace since our previous report. Across all industries, contacts are concerned about the Delta variant and its economic impact. Contacts continued to report that labor and material shortages. Overall inflation pressures remain elevated, but firms reported varying degrees of pass-through to customers.
  • Minneapolis: The District economy saw moderate growth despite continued inventory shortages and higher prices. Employment grew strongly but hiring demand continued to outstrip labor response by a wide margin. Consumer demand remained strong, leveraging growth in services, tourism, and manufacturing. Drought took a growing toll on agriculture, though higher prices benefited farmers. Minority and women-owned business enterprises saw moderate growth in activity.
  • Kansas City: Economic activity continued to grow at a moderate pace through August. Demand remains elevated for most businesses, and a majority of contacts expect activity to remain elevated amid the recent surge in COVID cases. Wages grew at a robust pace, but labor shortages persist. As a result of widespread drought, pasture and range land in several states was in poor or very poor condition.
  • Dallas: The District economy expanded at a solid rate, with broad-based growth across sectors. Employment growth was robust, with a pickup seen in the service sector. Wage and price growth remained elevated amid widespread labor and supply chain shortages. Outlooks stayed positive, though surging COVID-19 cases has added uncertainty to outlooks.
  • San Francisco: Economic activity in the District expanded moderately. Hiring activity intensified further, as did upward pressures on wages and inflation. Retail sales increased modestly, while conditions in the services sector deteriorated somewhat. Activity in the manufacturing and agriculture sectors increased slightly. Residential construction edged down somewhat, while lending activity remained largely unchanged.

As Milton Friedman once said, “If you put The Federal Government in charge of the Sahara Desert, in 5 years there would be a shortage of sand.” And The Fed is no slouch at creating shortages either.

Slowdown! U.S. Annual Home Prices Gain a Record 18% in July (But Forecast To Slow Considerably By July 2022)

Slowdown! Forecast home price growth for July 2022, that is.

(Bloomberg) — U.S. home prices increased 18% in July compared to a year earlier, according to a CoreLogic Inc. report released Tuesday.

The jump is the largest 12-month gain in the index since the series began 45 years ago. On a month-over-month basis, home prices increased by 1.8% in July from June. 

Home price appreciation continues to escalate as millennials entering their prime home buying years, renters looking to escape skyrocketing rents and deep pocketed investors drive demand,” said Frank Martell, president and CEO of CoreLogic, a global property-information firm. 

The rush of home buyers — amid extremely low mortgage rates — has caused a lack of supply, which is unlikely to be resolved over the next five to 10 years “without more aggressive incentives for builders to add new units,” he said in a statement

But it is the forecast for July 2022 that is interesting. A slowdown in home price growth across the board.

Lets see what happens to wage growth are three out of four Americans lose their Covid benefits as of today.

Fed’s Snakejuice And Winners/Losers From T-Curve Flatterning (Winners: Real Estate, Financials, Information Tech, Losers: Industrials, Retail, Metals And Mining)

At the annual Jackson Hole (aka, J-Hole) Economic Symposium, Federal Reserve Chairman Jerome Powell reiterated that the Fed is in no hurry to either taper asset purchases immediately or aggressively. Additionally he made crystal clear that even when the Fed does eventually start tapering asset purchases (likely November or December), it should not be taken as signaling interest rate hikes will follow on some preset course. Indeed, Fed Chairman Powell continues to claim that inflation is transitory. Finally, he said that part of the mandate (employment) is still far from being achieved. So, expect more SNAKE JUICE.

The shape of the yield curve has been highly influential recently in relative performance trends between various areas of the market. From last summer through May of this year, the steepening of the yield curve coincided with healthy outperformance of cyclical stocks. Since May, the flattening of the curve has coincided with more defensive (or at least high quality) leadership out of the tech and health care sectors. The logic goes, therefore, that a re-steepening of the curve should coincide with a shift back to cyclicals. Indeed, that shift may be in the early innings.

Let’s take a look at the US Treasury 10Y-2Y curve slope over the past twelve months against the Citi Economic Surprise Index for the US. You can see curve fatigue starting in April 2021 as the Citi Economic Surprise Index turns negative.

The the more cyclical and smaller skewed S&P 500 equal weight index has started to outperform the S&P 500 again, right on queue with the yield curve re-steepening.

Industrial stocks are under-performing the broader S&P 500 index as the curve flattens.

Real estate stocks? They are outperforming the broader S&P 500 index.

Mining stocks like gold mines? They are underperforming the broader S&P 500 index.

Financial stocks? Not surprisingly, The Fed’s dovish behavior is causing financial stocks to outperform the broader S&P index.

Likewise, information technology stocks are outperforming the broader S&P 500 index.

So, by Powell delaying any balance sheet slowdown and rate increases, we have clear winners (real estate, financials, information tech) and clear losers on a relative basis (industrials, retail, metals and mining).

Pure snake juice.

The Others! Due to volatility differences, I wouldn’t over-interpret this chart. But Bitcoin as a ratio of the S&P 500 index is “kicking ass!” Gold and housing as a ratio of the S&P 500 index seemingly can’t keep up with the S&P 500 index.

US Q2 GDP Prices Rise 6.10% Compared To Home Prices Rising At 16.61% YoY While Avg Hourly Earnings Rising At 4.70% YoY (UGLY Chart Warning!!)

For your viewing pleasure.

Looks an awful lot like 2005 before the housing price crash, financial crisis and Great Recession. US home prices, HOUSING inflation, is growing at 16.61% YoY, GDP Price index QoQ (annualized) is growing at 6.10%, and average hourly earnings is growing at 4.20% YoY.

Let’s see what happens in Jackson Hole this weekend!

US Mortgage Purchase Applications Rise 1% From Previous Week, But 16% Lower Than 1 Year Ago

Mortgage applications increased 1.6 percent from one week earlier, according to data from the Mortgage Bankers Association’s (MBA) Weekly Mortgage Applications Survey for the week ending August 20, 2021.

The Refinance Index increased 1 percent from the previous week and was 3 percent higher than the same week one year ago. You can clearly see the Refi Wave associated with the Covid outbreak and sudden Fed monetary stimulus resulting in a lowering of 30-year mortgage rates.

The seasonally adjusted Purchase Index increased 3 percent from one week earlier. Notice the general slowdown in purchase applications with soaring home prices.

The unadjusted Purchase Index increased 1 percent compared with the previous week and was 16 percent lower than the same week one year ago.

Rolling, rolling, rolling, keep those mortgages moving.

US New Home Sales Rise To 708K Units SAAR In July (+1% From June) While Median Price Soars To $390K

The good news! US new home sales rose 1% in July to 708k units SAAR.

The bad news? The median price of new home sales is $390k.

More bad news for the midwest and northeast. New home sales dropped. Most of the growth in new home sales occurred in The West.

Hot, hot, hot! But not in the northeast and midwest. There it is not, not, not.

Fed’s Ability to Set Rates Floor Is Weakening on Cash Deluge (“Charming” Powell Had At Least 350 Meetings, Dinners Or Phone Calls With Members Of Congress)

Powell and The Fed’s policies have veered from their mandate requiring Chairman Powell to meet 350 times with Congress to sell The Fed’s policies.

Bloomberg) — The Federal Reserve’s floor for overnight funding markets is proving to be no match for the deluge of cash. 

Money-market securities ranging from Treasury bills to repurchase agreements continue to trade below 0.05% — the offering rate on the overnight reverse repo facility, which is supposed to act like a floor for the front end. The Fed at its June meeting had raised the rate by five basis points to help support the smooth functioning of short-term funding markets.

Still, usage of the tool climbed to a record $1.136 trillion on Monday, eclipsing the previous high of $1.116 trillion on Aug. 18. 

Demand for the so-called RRP facility has surged as a flood of dollars threatens to overwhelm funding markets. That’s in part a result of the central bank’s long-standing asset purchases and drawdowns of the Treasury’s cash account, which is pushing reserves into the system. As a result, liquidity has been swelling, especially as the Treasury cuts supply to create more borrowing room under the debt ceiling.

The pressure pushing down overnight rates toward zero is proving a major headache for money-market funds. It hampers their ability to invest profitably, and can lead to further disruptions as they begin to waive fees to avoid passing on negative rates to shareholders. A number of firms including Vanguard Group shut down prime money-market funds last year after struggling to cover operating costs in the low-interest-rate environment.

Yes, overnight rates such as the US SOFR rate, are near zero.

Powell’s Charm Offensive in Congress Positions Him to Keep Job

Perhaps that is why Federal Reserve Chair Jerome Powell is acting as a lobbyist with Congress for The Fed’s nontraditional approach to monetary policy.

(Bloomberg) Since he took the helm of the Fed in February 2018, through June of this year, he’s held at least 350 meetings, dinners or phone calls with members of Congress, according to his monthly calendars. That’s almost nine per month, and many of those included more than one lawmaker. The tally doesn’t count at least 16 appearances as chair before numerous congressional committees.

Well, the stock market has zoomed-up since Bernanke and The Fed adopted zero-interest rate (ZIRP) policies and the now famous quantitative easing (QE) policies in late 2008.

Congress member Alexandria Ocasio-Cortez asked Fed Chair Powell about the Fed helping with US unemployment. We are already at zero rates (on the short-end), and Congress should look at their policies on why labor force participation is slow to recover from the Covid epidemic.

Powell is sounding more and more like Parks and Recreation’s Tom Haverford in terms of schmoozing Congress for support.

Update: The Mises Stationarity Index is flashing “BUBBLE.”

The Mises Stationarity Index is different than the Shiller CAPE index, which is showing equities as being overpriced, but not yet in dot.com bubble zone.

US Existing Home Sales Median Price Slows To 17.8% YoY In July On Continued Low Inventory For Sale (EHS Increased To 5.99M SAAR)

Feeling hot, hot, hot. Housing, that is!

US existing home sales in July rose to 5.99 million SAAR, beating expectations. But the inventory of home available for sale remains low by historic standards.

The median price of existing homes declined to 17.8% YoY with The Federal Reserve pumping money into the system like there is no tomorrow.

Bloomberg had the following headline: “Sales of Existing Homes in U.S. Rise as Inventory Picks Up.” While that is a true statement, existing home sales inventory is still down 12% YoY.

I wonder if the attendees at the Jackson Hole Fed conference will be discussing the gut-wrenching home price growth? Rumor has it that Fed Chair Powell will use J-Hole as a platform to suggest paring back on the monetary stimulus.

Treasury And Mortgage Rates In A Never-Ending Balance Sheet World (REAL Mortgage Rates NEGATIVE With Skyrocketing Home Prices)

Headline! “Fed’s Kaplan says delta variant could cause him to rethink his tapering view”

Face it, the Federal Reserve may alter its growth path on asset purchases of Treasuries and Agency Mortgage-backed Securities, but it is doubtful that they will pare back their balance sheet. Call it “A Never-ending balance sheet for you” world.

Why? Seemingly never-ending Covid crisis, etc.

Let’s look at US Treasury yields today. The 10-year Treasury yield is up slightly to 1.25% as of 10am EST.

Here is a chart of the 10-year Treasury yield, Fed Funds effective rate, Fed Balance sheet and reverse repos since the Covid outbreak and Fed massive intervention. Bottom line, the have repressed the short-term interest rates and put downward pressure on the 10-year Treasury yield.

As the 10-year Treasury yield remains repressed DESPITE HIGHEST INFLATION RATE SINCE 2008, the Freddie Mac 30-year mortgage rate remains repressed as well. Yes, that mean NEGATIVE REAL MORTGAGE RATES.

This produces a REAL mortgage rate of -2.56%.

The spread of mortgage rates over the 10-year Treasury yield is about 173 basis point since 1971.

Where will Treasury yields go from hear? If we believe technical analysis like the Ichimoku Cloud, the 10-year Treasury rate will likely rise.

And The Fed’s Dots project also see rates rising (at least on the short-end.

Negative real mortgage rates and blistering home price growth?

Will the attendees at the KC Fed Jackson Hole conference discuss these matters? Or will it just be a Federal Reserve Soul Shake (dance)?