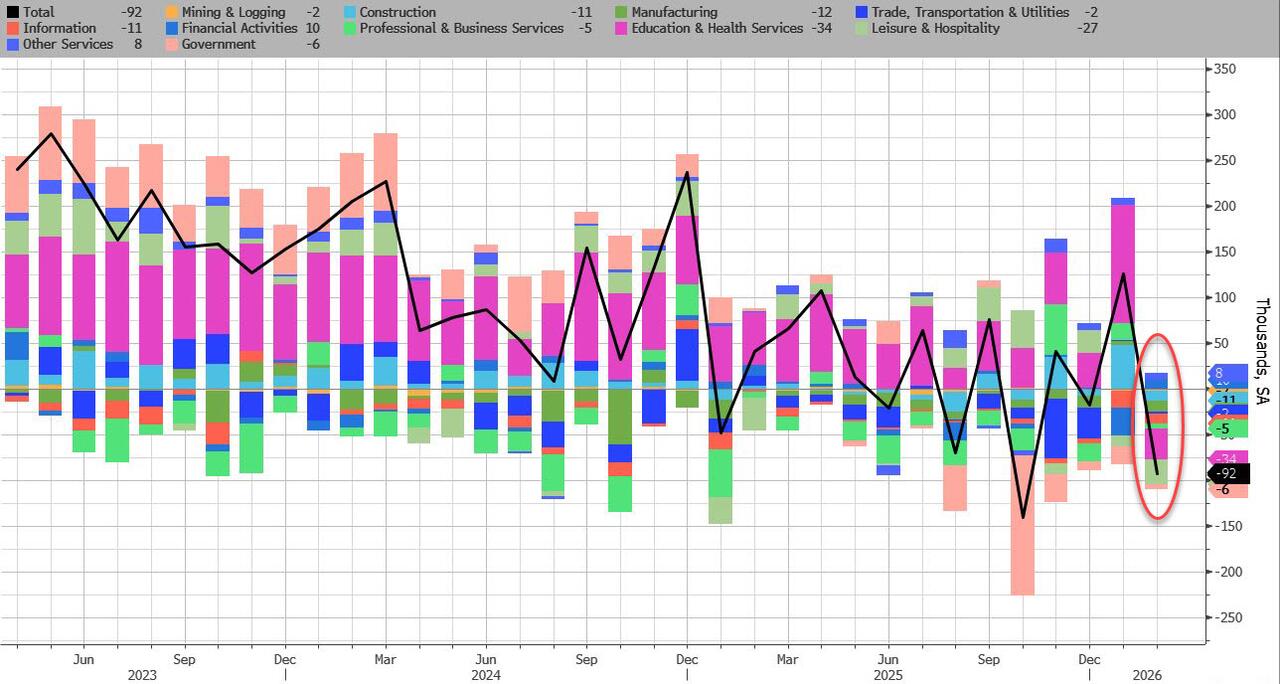
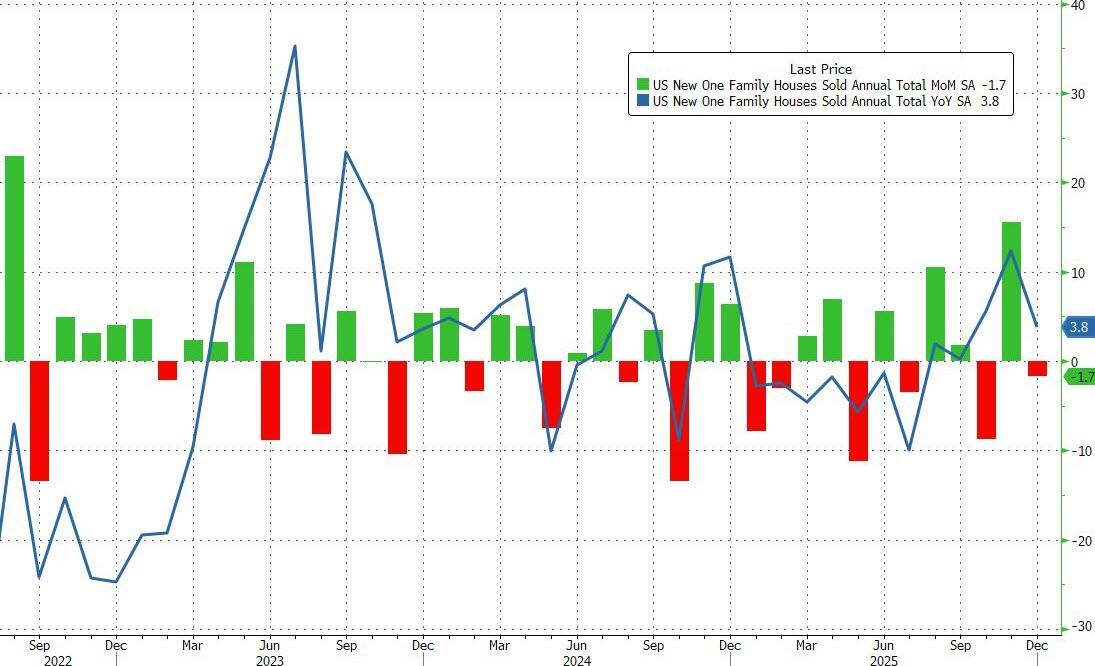
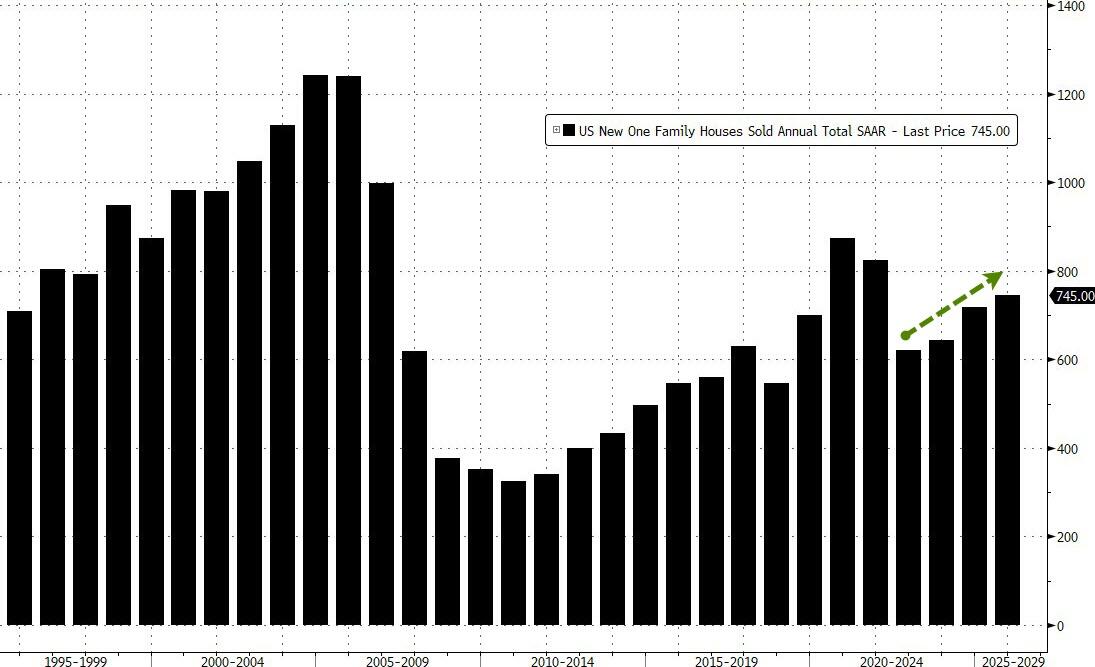
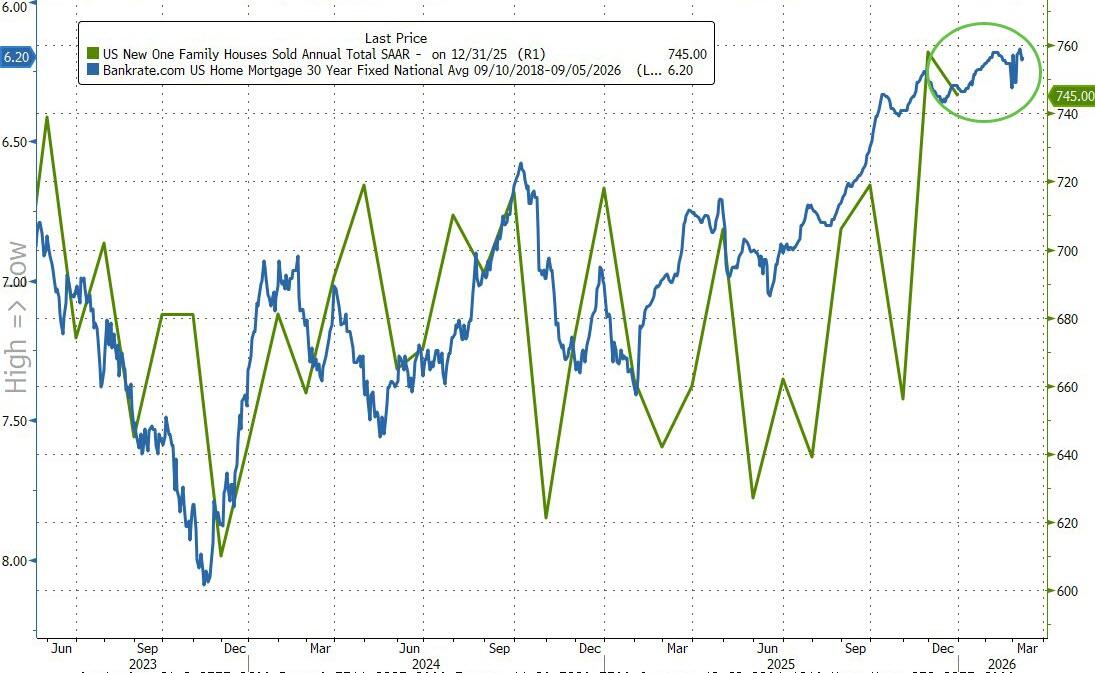
Despite falling mortgage rates, analysts expected December’s drop in new home sales to accelerate in January… and accelerate they did… crashing a stunning 17.6% MoM (-2.7% MoM exp) – the biggest MoM drop since July 2013.
This huge MoM drop dragged sales down 11.3% YoY – the worst slide in three years.
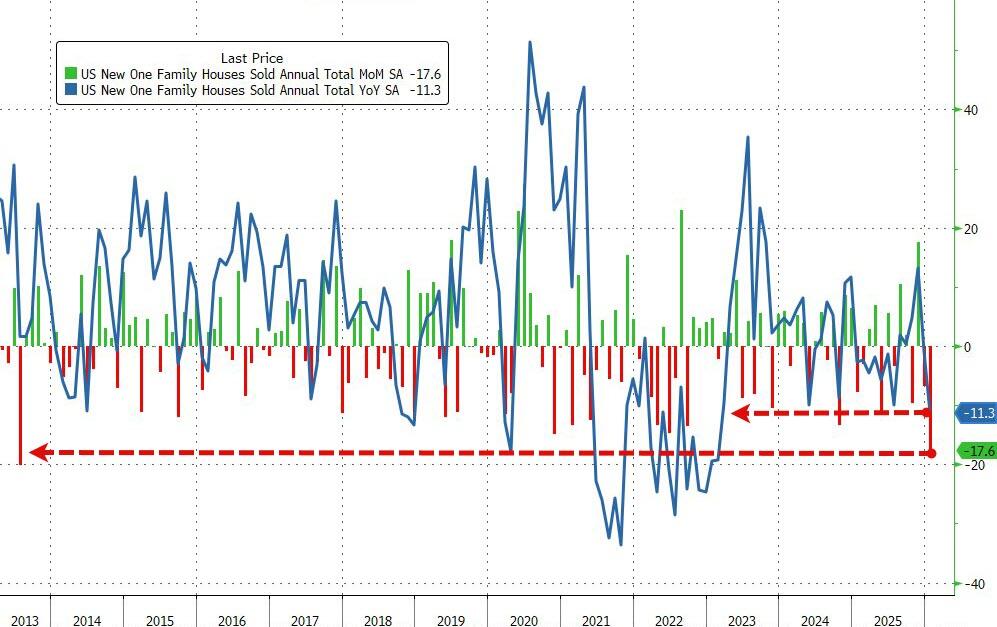
Source: Bloomberg
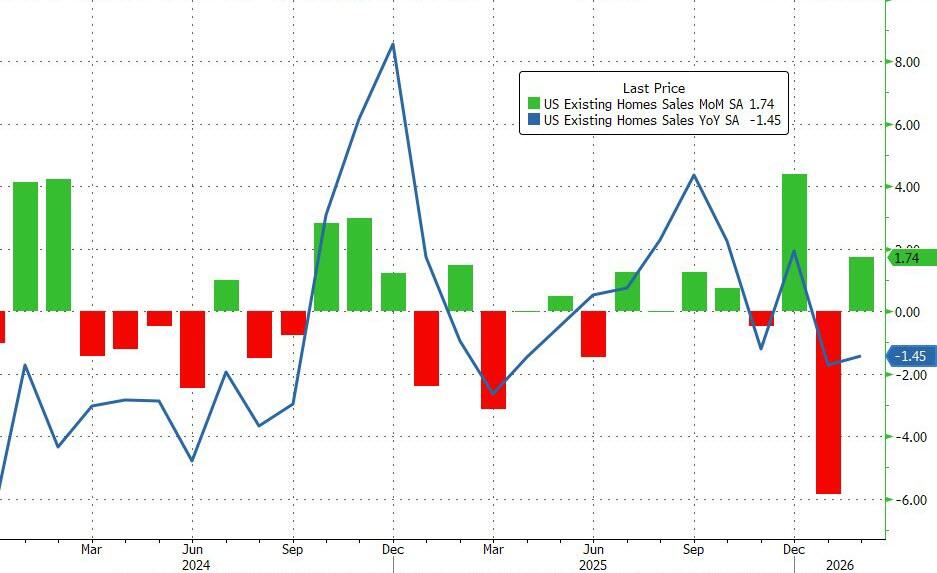
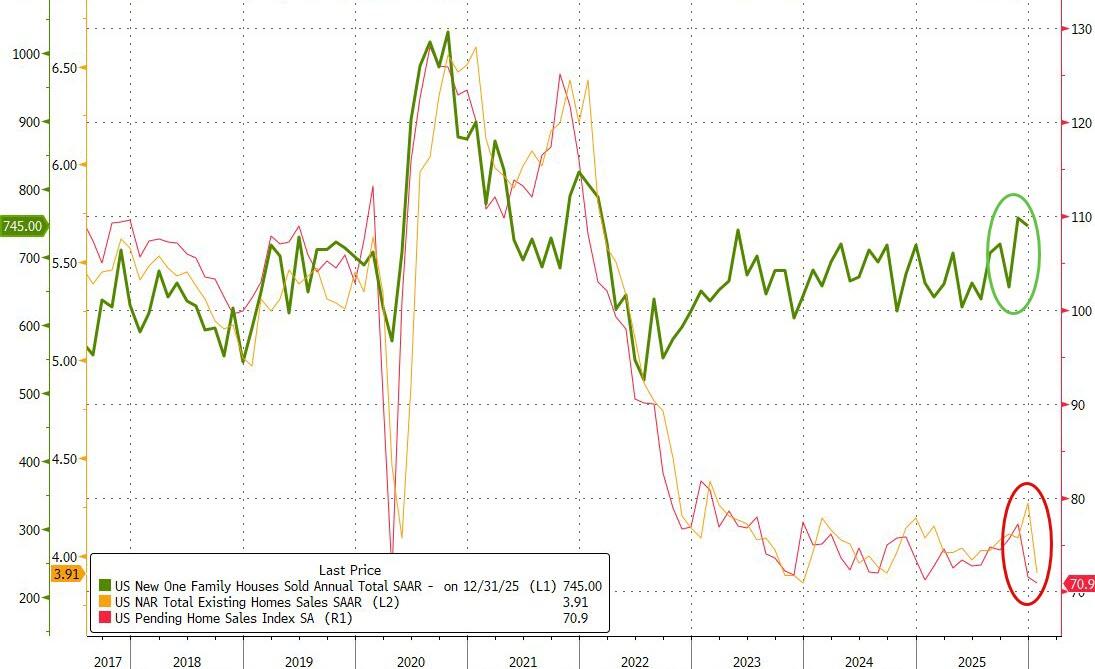
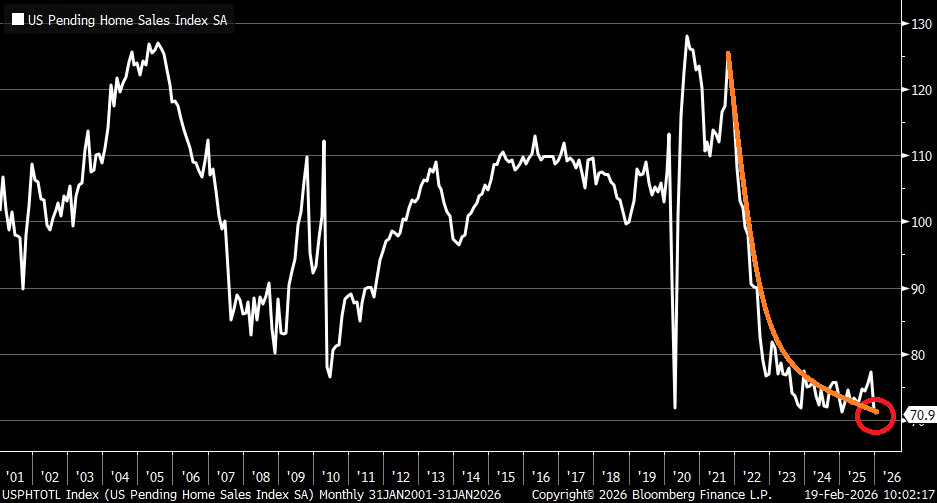
This huge drop dragged the new home sales SAAR down to its lowest since 2022, catching down to existing and pending sales…

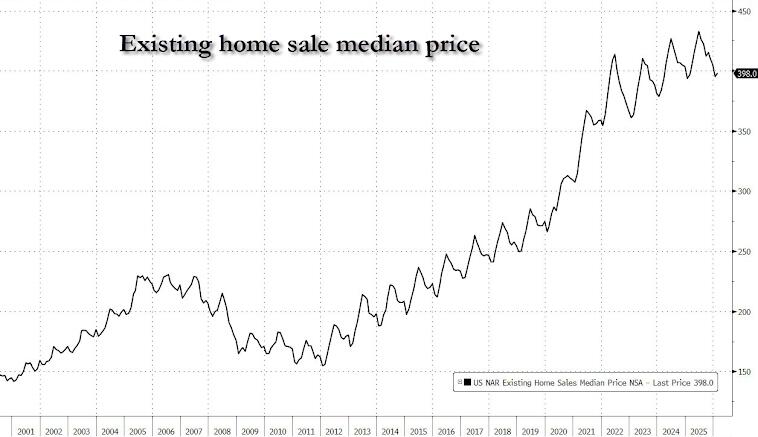
Inventories are up (Houses for sale in Jan. rose 0.4% m/m to 476,000), prices are down (Median down 6.8% YoY at $400k – lowest since 2024)…

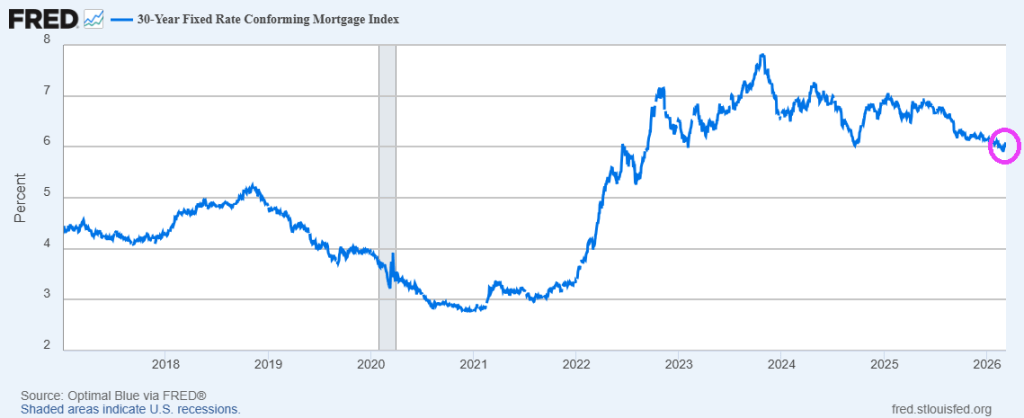
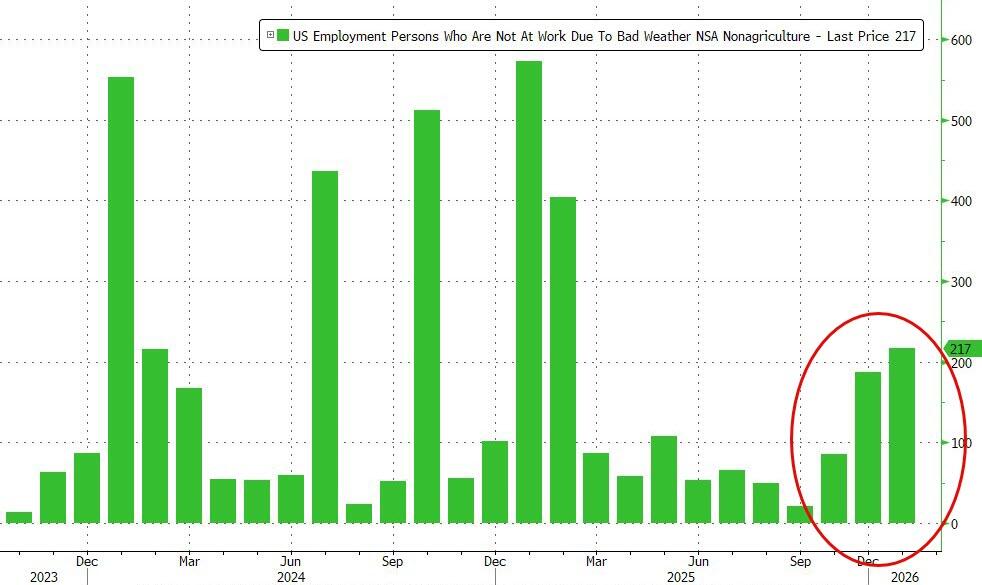
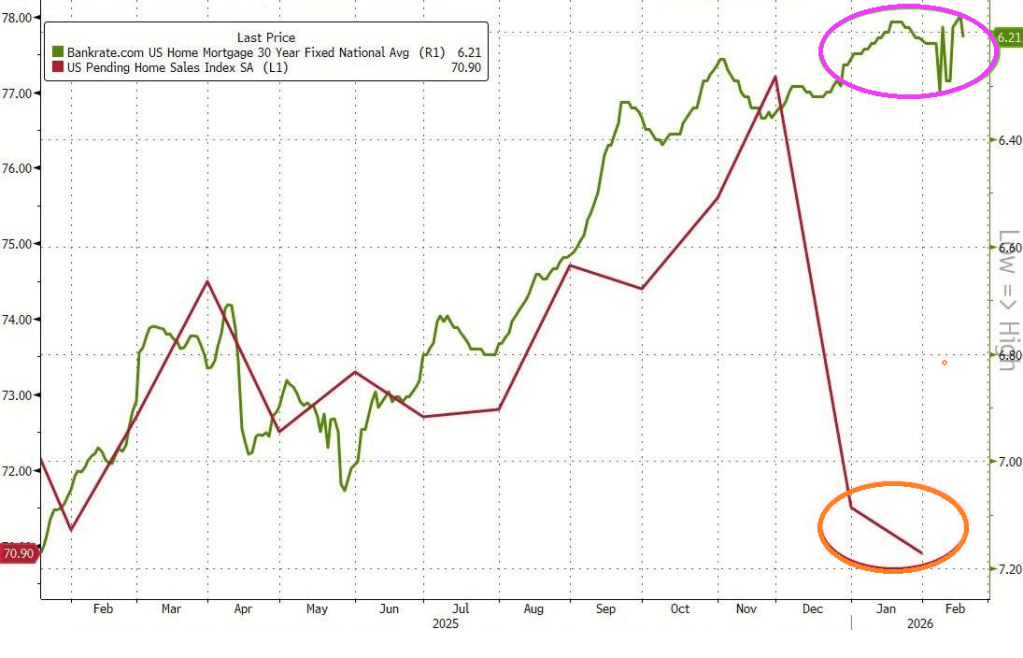
…and remember these deals were signed in January – meaning this is not mortgage related (some suggesting weather impact – Northeast sales down 44.7% MoM, MidWest -33.9% MoM, but the scale is immense).
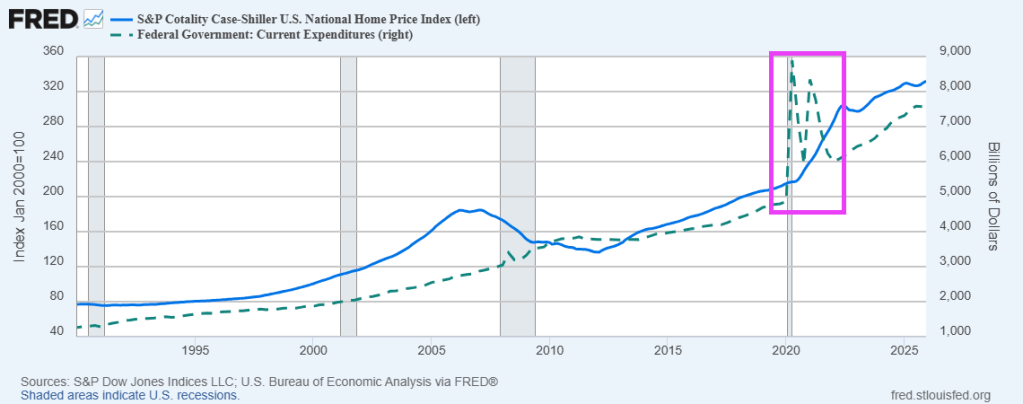
Moral of the story: US home prices are too high for millions of households to afford.


You must be logged in to post a comment.