U-3 unemployment rate rose to 4.3%. U-6 unemployment and part-time rose to 8.1%.
Total private jobs added was 38k while manufacturing jobs added was down -12k.
Government jobs dropped -16k.
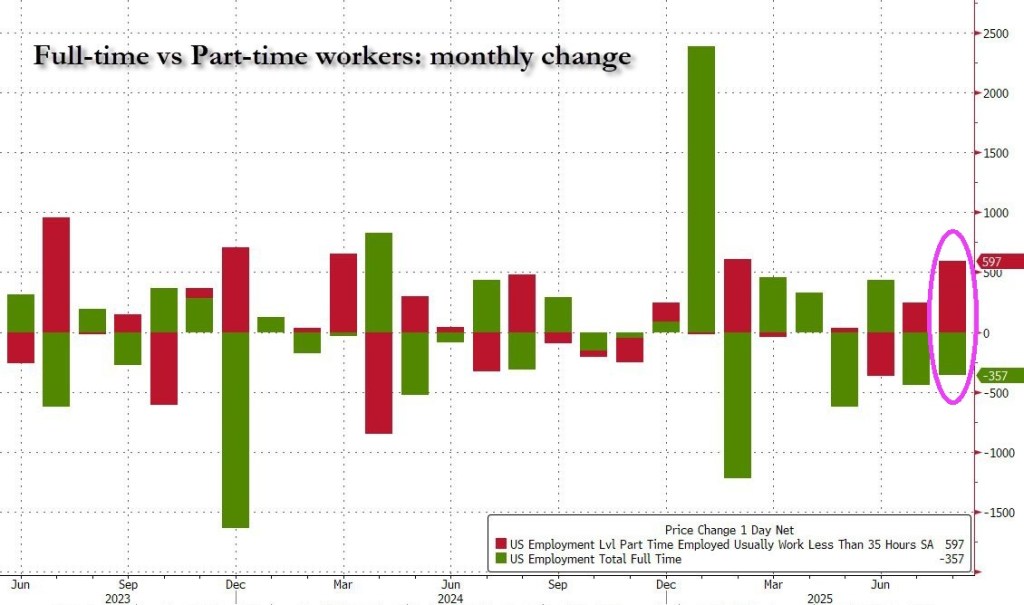
It gets worse! All of the jobs added were PART-TIME!
It gets even worse: native-born workers plunged by 561K, the biggest one month drop since August 2024. Foreign-born workers increased by 50K, the first increase since March.
Let’s see if The Fed drops the hammer on rates by 50 basis points.
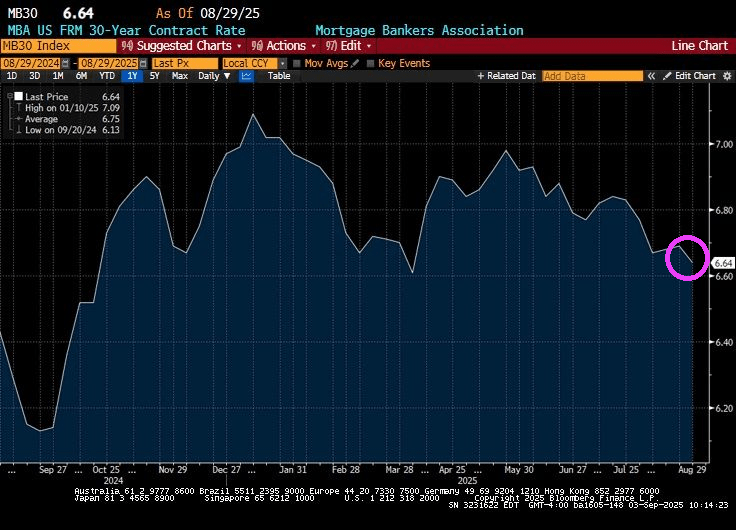
The good news? The US 30-year mortgage rate fell slightly to 6.64%.
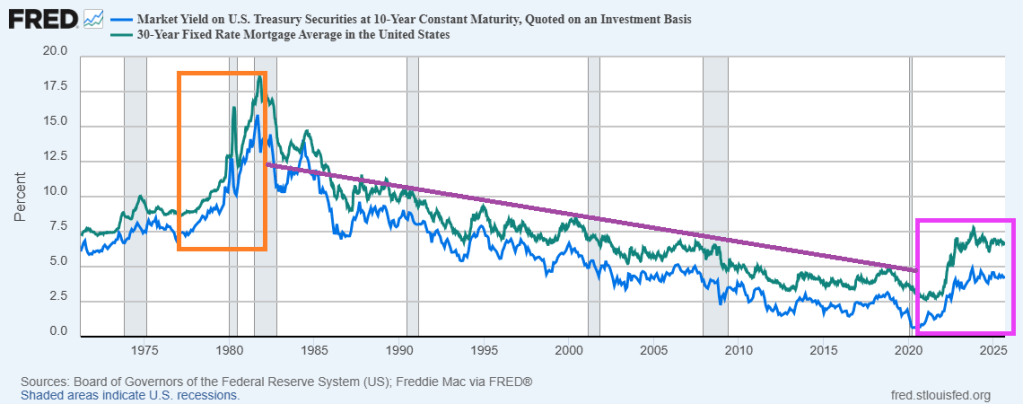
The bad news? It seems to be a milder repeat of the Ford/Carter years of the late 1970s/early 1980s. Rising 10-year Treasury yields and 30-year mortgage rates during the Ford/Carter years … and early Reagan years. The difference? The Federal Reserve is fundamentally different today than previously. With Bernanke/Yellen, The Fed became more “activist” (like Obama/Biden-appoointed District Judges). Powell is returning to the Yellen model of Fed activism … not doing much.
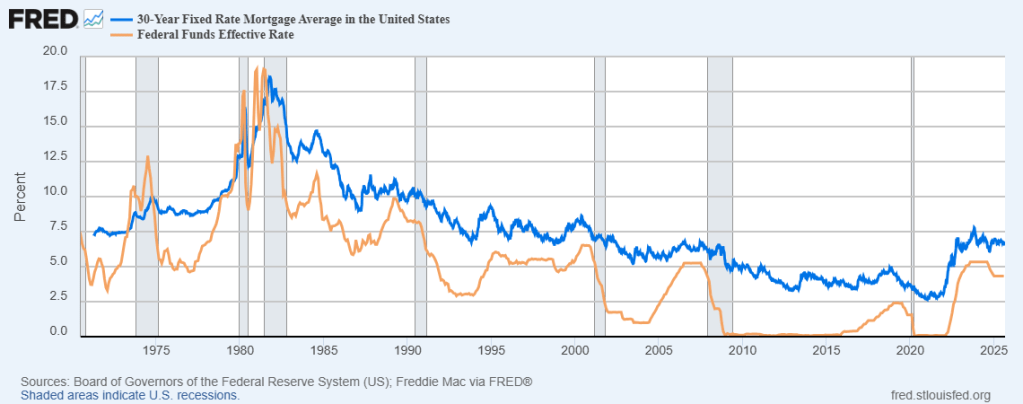
Now the market awaits a rate cut from The Fed at the next FOMC meeting. But 30-year mortgage rates are most closely related to the 10-year Treasury yield than the short-term Fed Funds rate. Theoretically, The Fed could cut their target rate by 25 basis points and mortgage rates could be uneffected. Or even rise.
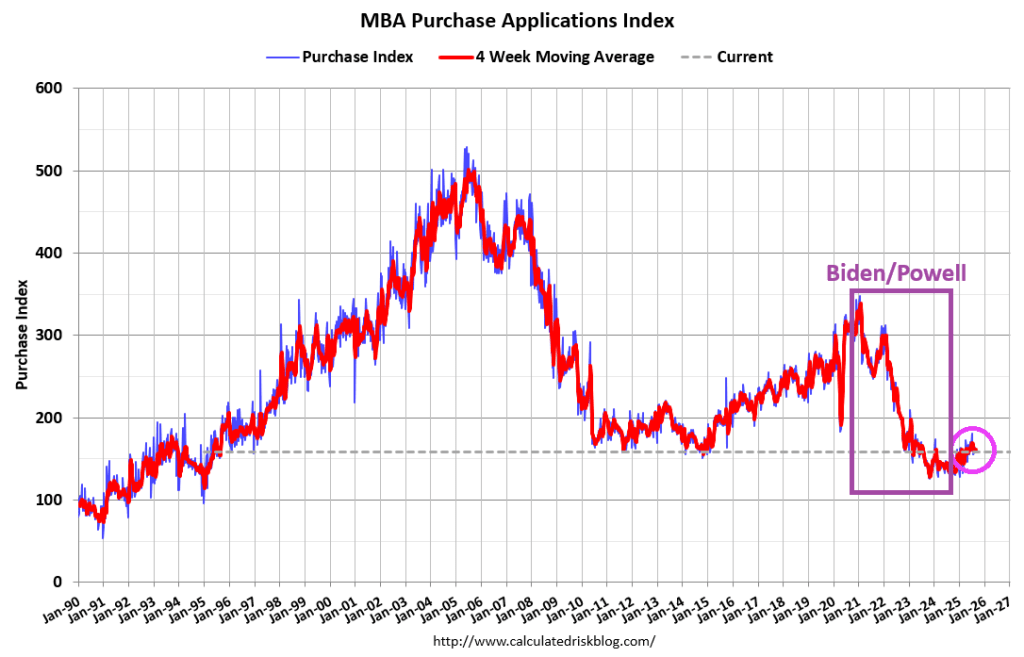
Mortgage applications decreased 1.2 percent from one week earlier, according to data from the Mortgage Bankers Association’s (MBA) Weekly Mortgage Applications Survey for the week ending August 29, 2025.
The Market Composite Index, a measure of mortgage loan application volume, decreased 1.2 percent on a seasonally adjusted basis from one week earlier. On an unadjusted basis, the Index decreased 3 percent compared with the previous week. The seasonally adjusted Purchase Index decreased 3 percent from one week earlier. The unadjusted Purchase Index decreased 6 percent compared with the previous week and was17 percent higher than the same week one year ago.
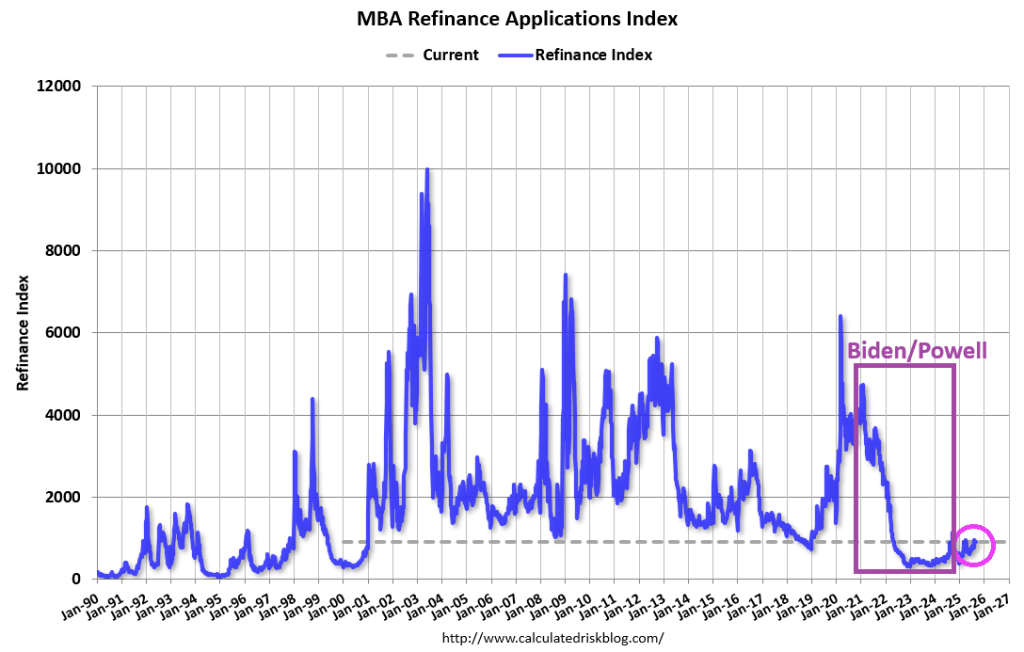
The Refinance Index increased 1 percent from the previous week and was 20 percent higher than the same week one year ago.
Mortgage rates declined last week, with the 30-year fixed rate decreasing to its lowest level since April to 6.64 percent. However, that was not enough to spark more application activity. The average contract interest rate for 30-year fixed-rate mortgages with conforming loan balances ($806,500 or less) decreased to 6.64 percent from 6.69 percent, with points decreasing to 0.59 from 0.60 (including the origination fee) for 80 percent loan-to-value ratio (LTV) loans.
But don’t get your hopes up about The Fed saving the housing market.
So much for the defeatist mentality in the main stream media, Congress and economists!
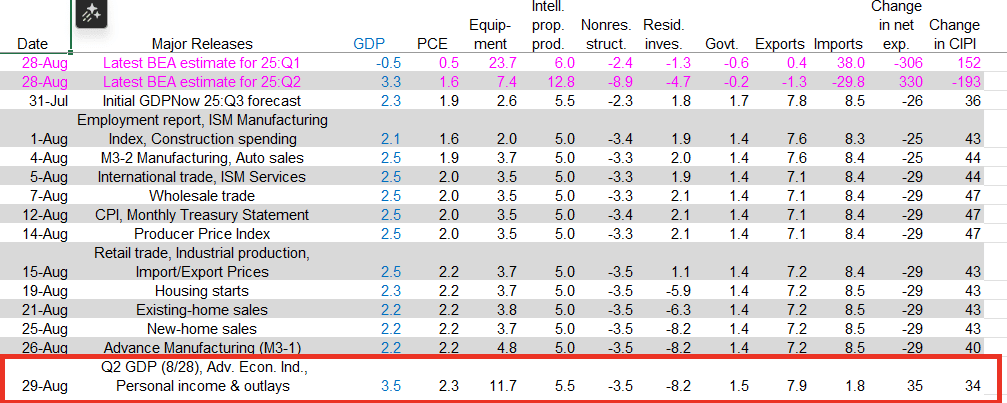
The GDPNow model estimate for real GDP growth (seasonally adjusted annual rate) in the third quarter of 2025 is 3.5 percent on August 29, up from 2.2 percent on August 26. After recent releases from the US Census Bureau and the US Bureau of Economic Analysis, the nowcasts of third-quarter real personal consumption expenditures growth and second-quarter real gross private domestic investment growth increased from 2.2 percent and 4.4 percent, respectively, to 2.3 percent and 6.1 percent, while the nowcast of the contribution of net exports to third-quarter real GDP growth increased from -0.36 percentage points to 0.59 percentage points.
The breakdown? Equipment growth at 11.7 was the standout along with exports at 7.9%.
Residential investment is down -8.2. This isn’t helping!
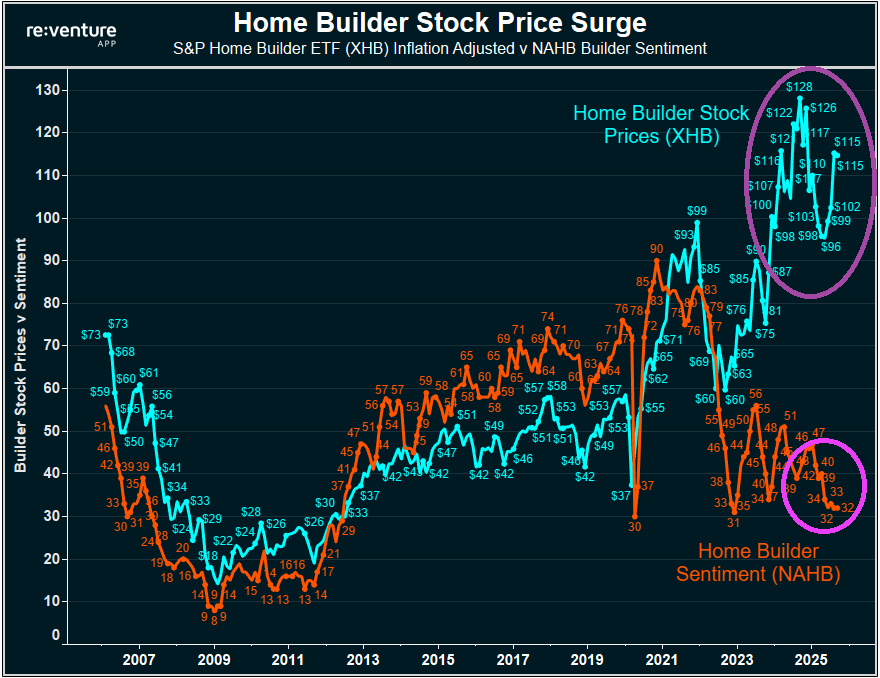
Home builder stock prices have surged, while home builder sentiment has plunged.
Of course, The Fed’s endless money printing isn’t helping the supply side of home building.
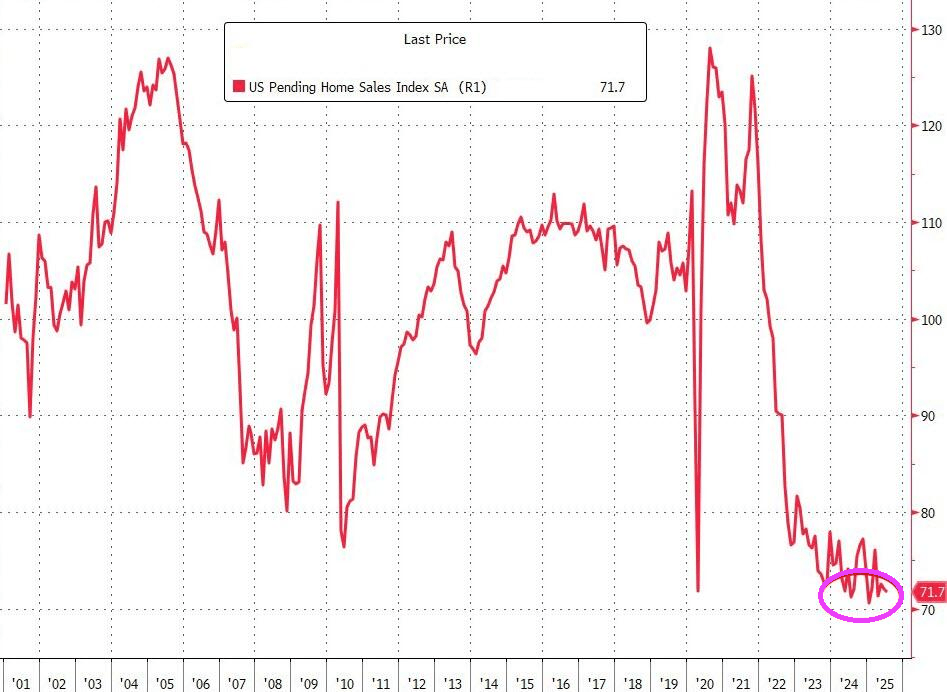
To make matters worse, pending home sales remain in the doldrums.
Federal Reserve Board member Lisa Cook is an embarrasment for committing mortgage fraud, then refusing to step down. And now she has filed a lawsuit against the Trump Administration for wrongful termination. Typical of an Obama appointee!
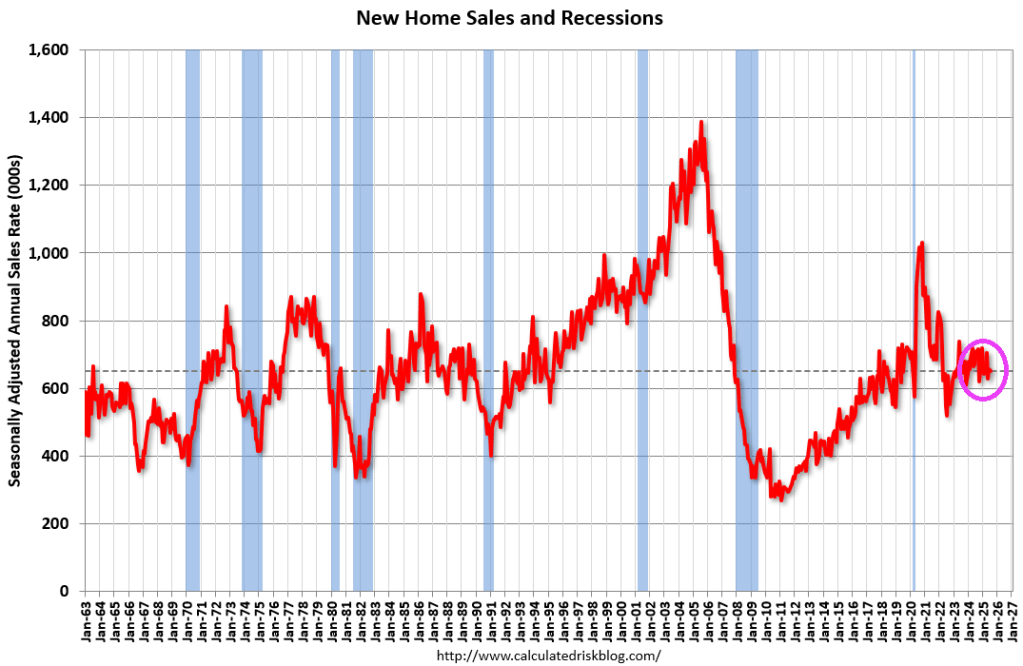
According to the US Census Bureau, New Home Sales of new single-family houses in July 2025 were at a seasonally-adjusted annual rate of 652,000, according to estimates released jointly today by the U.S. Census Bureau and the Department of Housing and Urban Development. This is 0.6 percent (±15.5 percent)* below the June 2025 rate of 656,000, and is 8.2 percent (±14.0 percent)* below the July 2024 rate of 710,000.
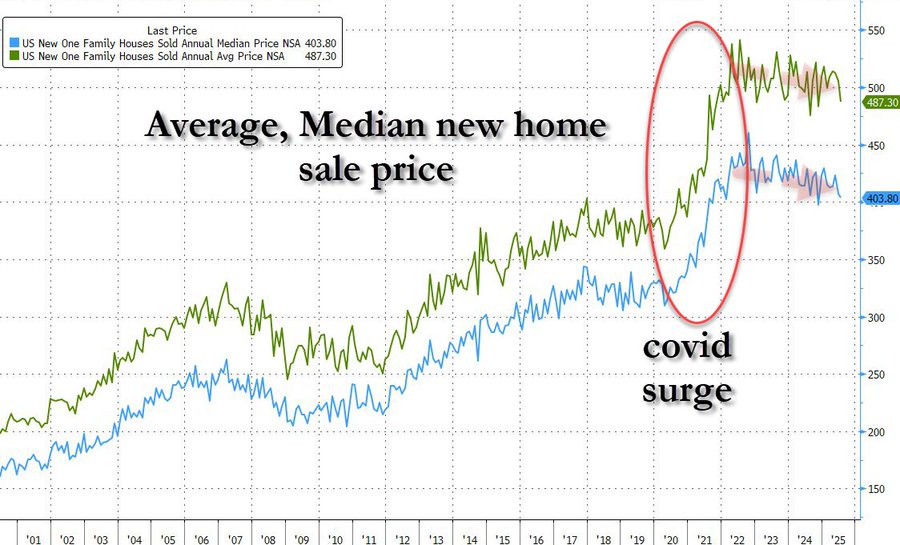
Median and Average Sales Price
The median sales price of new houses sold in July 2025 was $403,800. This is 0.8 percent (±5.9 percent)* below the June 2025 price of $407,200, and is 5.9 percent (±8.5 percent)* below the July 2024 price of $429,000. The average sales price of new houses sold in July 2025 was $487,300. This is 3.6 percent (±8.0 percent)* below the June 2025 price of $505,300, and is 5.0 percent (±8.6 percent)* below the July 2024 price of $513,200.
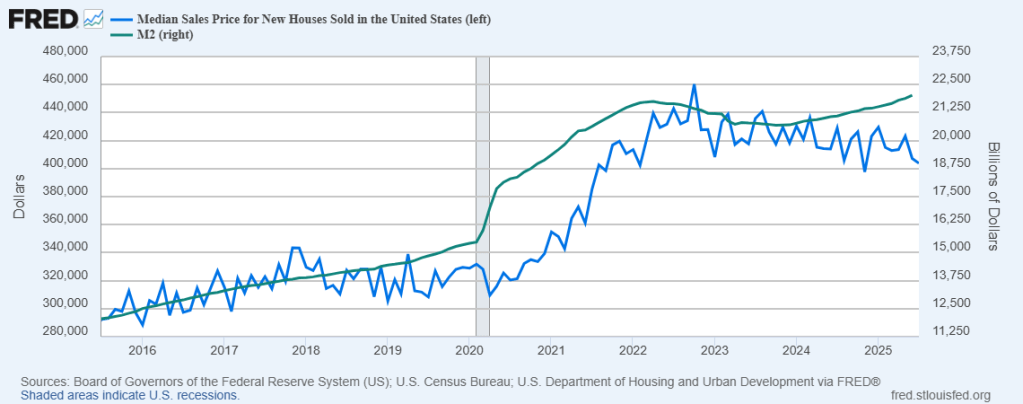
Here is a chart of median sales price of new homes against Fed money printing (M2).
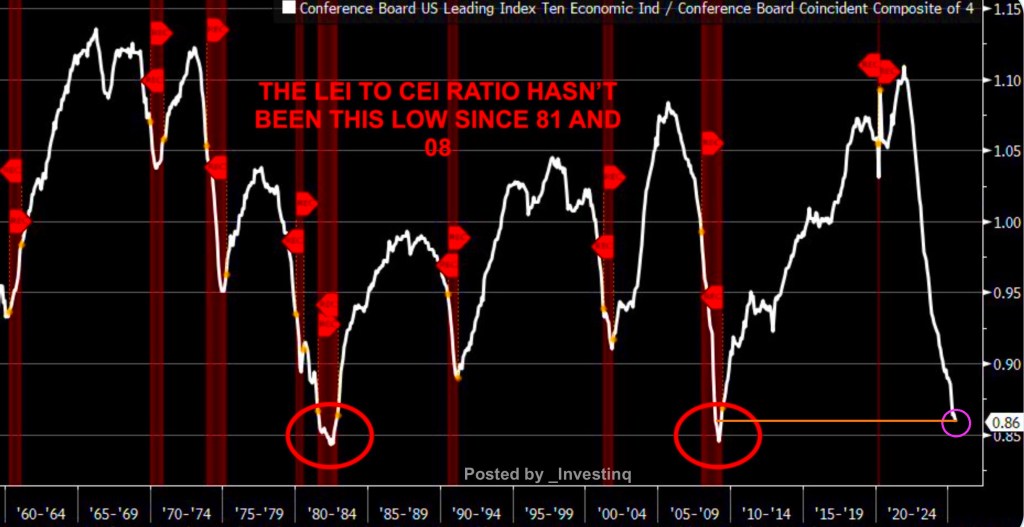
The Fed will have to whip it good with rate cuts if the recession warnings are an indicator of what lies ahead for the US economy.
The ratio of The Conference Board’s Leading Economic Indicators (LEI) vs. The Conference Board’s Coincident Economic Index (CEI) ratio hasn’t been this low since 2008.
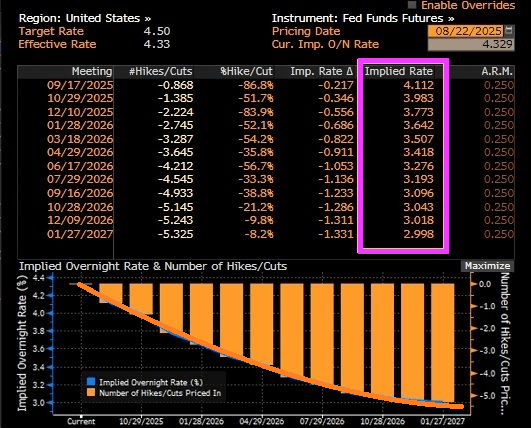
Fed Funds Futures are signalling rate cuts at the September 17th FOMC meeting and December 10th meetings.
Month-over-month sales increased in the Northeast, South, and West, and fell in the Midwest. Year-over-year, sales rose in the South, Northeast, and Midwest, and fell in the West.
• 2.0% increase in existing-home sales – seasonally adjusted annual rate of 4.01 million in July.
• Year-over-year: 0.8% increase in existing-home sales
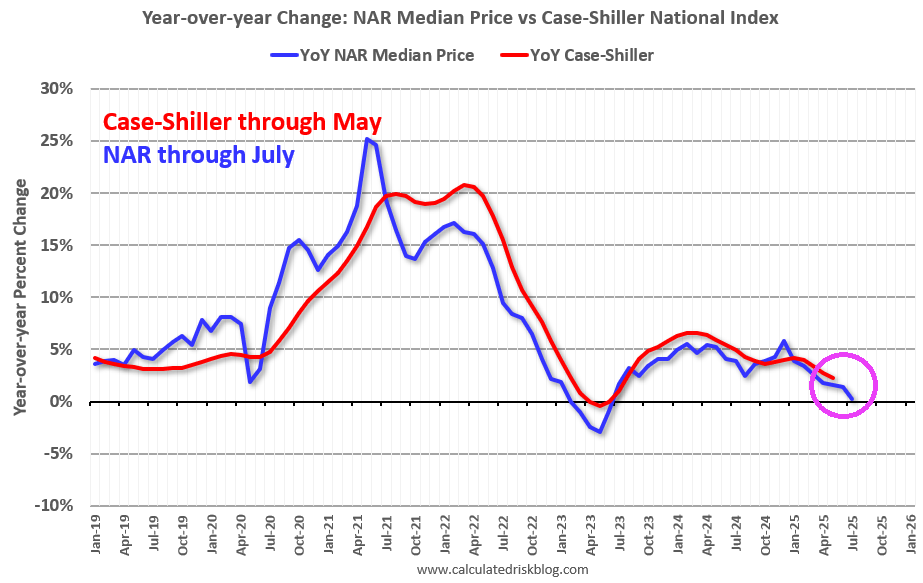
Median existing-home price for all housing types, up 0.2% from one year ago ($421,400) – the 25th consecutive month of year-over-year price increases.
It will be hard to make housing more affordable as long as The Fed keeps printing money.
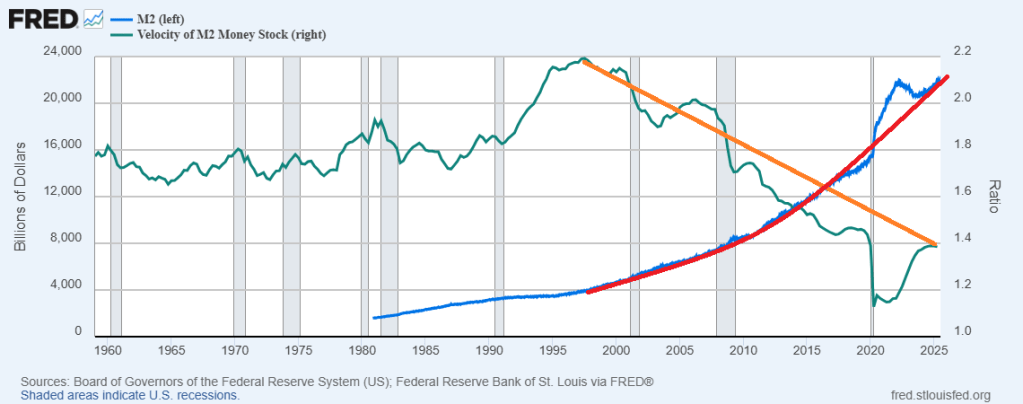
Powell et al cutting rates 25 basis points won’t really matter as long as they continue to print money. Unfortunately, M2 VELOCITY peaked under the Clinton Administration and has declined since despite frantic money printing.
What happended in 1995? Clinton’s National Homeownership Strategy that mandated HUD partners (GNMA, FHA, Fannie Mae, Freddie Mac, banks, etc.) to lower credit standards to encourage homeownership.
We need FHFA Director Bill Pulte to avoid doing what Democrats love (everything free or cheap).


You must be logged in to post a comment.