I called this inflation power!
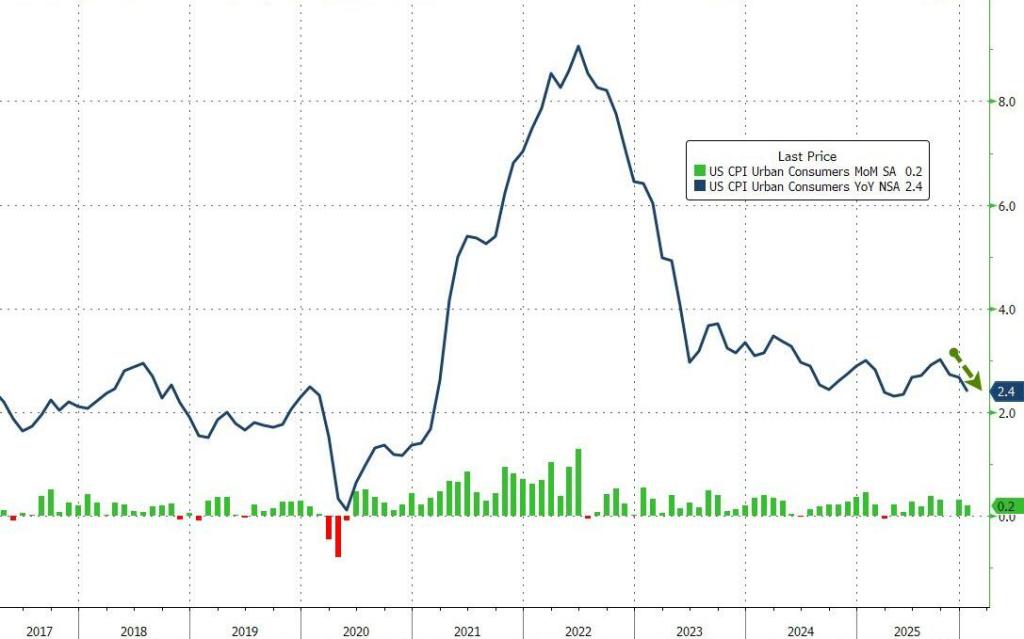
Underlying U.S. inflation increased more than expected in December, and signs are pointing to a further acceleration in January, which would strengthen expectations that the Federal Reserve would not cut interest rates before June.
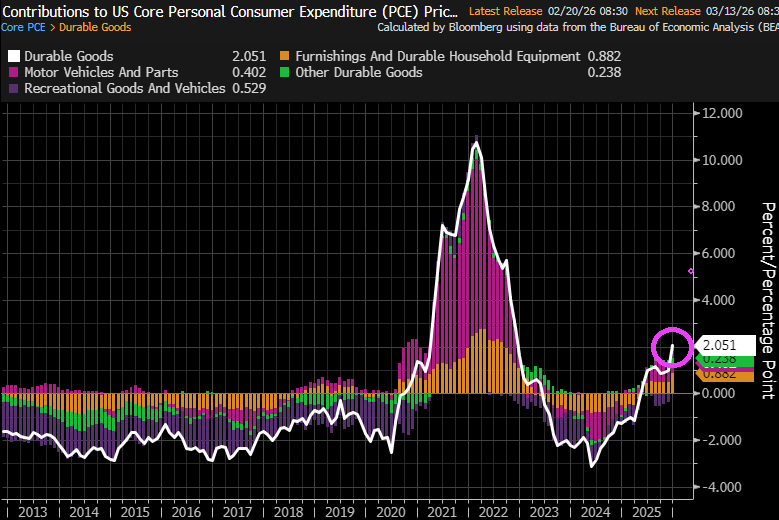
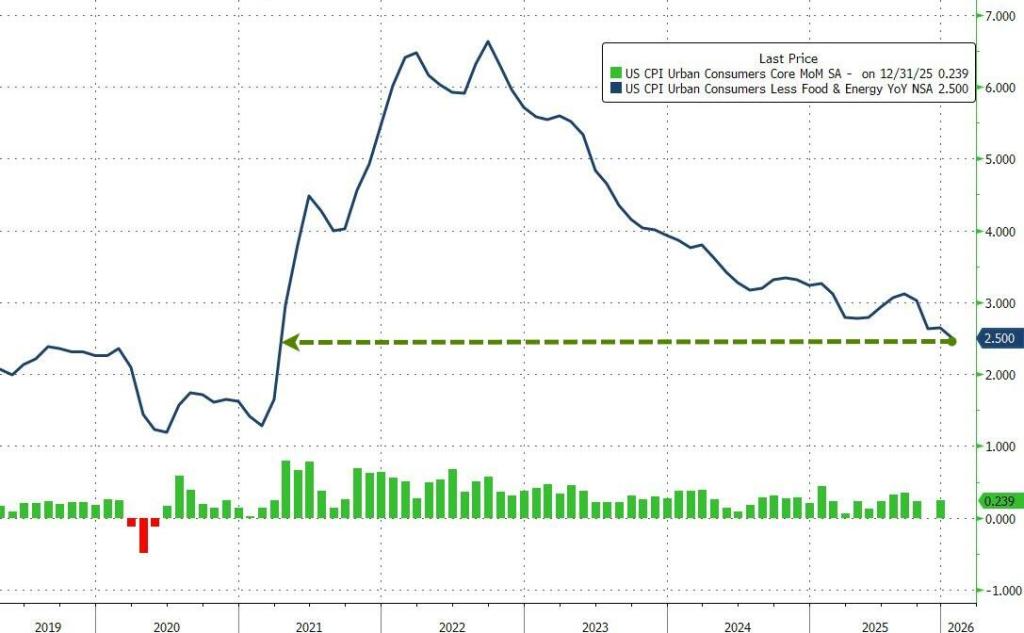
The personal consumption expenditures price index, excluding the volatile food and energy components, rose 0.4% after an unrevised 0.2% gain in November, the Commerce Department’s Bureau of Economic Analysis said on Friday. In the 12 months through December, core PCE inflation advanced 3.0% after increasing 2.8% in November.
The PCE price index increased 0.4% in December after rising 0.2% in November. PCE inflation increased 2.9% year-on-year after gaining 2.8% in November.
But in terms of contributions to the 0.4% figure is that durable goods rose 2.051%.
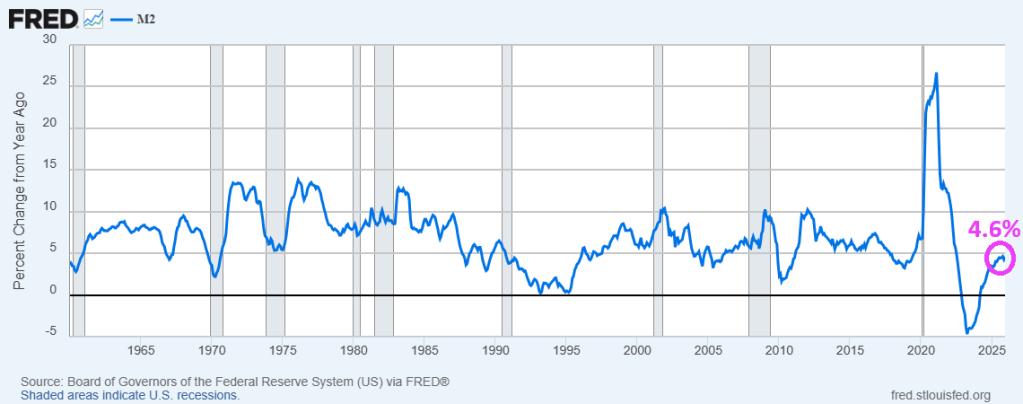
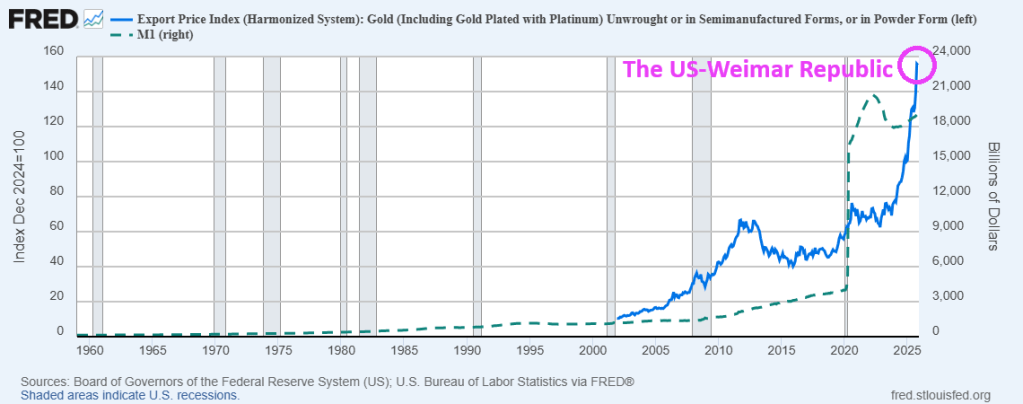
The Fed has been printing money (M2) like there is no tomorrow. With M2 growing at 4.6% YoY in December.


You must be logged in to post a comment.