Housing Starts: Privately-owned housing starts in November were at a seasonally adjusted annual rate of 1,289,000. This is 1.8 percent below the revised October estimate of 1,312,000 and is 14.6 percent below the November 2023 rate of 1,510,000. Single-family housing starts in November were at a rate of 1,011,000; this is 6.4 percent above the revised October figure of 950,000. The November rate for units in buildings with five units or more was 264,000.
And down -10.2% year-over-year.
Building Permits: Privately-owned housing units authorized by building permits in November were at a seasonally adjusted annual rate of 1,505,000. This is 6.1 percent above the revised October rate of 1,419,000, but is 0.2 percent below the November 2023 rate of 1,508,000. Single-family authorizations in November were at a rate of 972,000; this is 0.1 percent above the revised October figure of 971,000. Authorizations of units in buildings with five units or more were at a rate of 481,000 in November.
As we watch Biden and Democrats attempt to demolish the country as Biden leaves office. Let’s see how many criminals Biden will pardon on the way out … like the Jan 6th “select” committee of Adam Schiff, Adam Kinzinger, Liz Cheney, Bennie Thompson, etc.
Let’s start with the Buffett Indicator (Warren, not Jimmy!). It indicates that the stock market is STRONGLY OVERVALUED.
The S&P 500 Mean Reversion Model also shows the stock market to be STRONGLY OVERVALUED.
How about the Shiller P/E Ratio? Also showing strong overvaluation.
House prices under Biden have exploded partly due to the outrageous Federal spending following COVID.
The Feral Reserve also had a hand in the housing bubble. While mortgage rates remain high (relative to the Trump years), The Fed’s balance sheet remains elevated.
To be sure, some Republicans were complicit in the spending spree. But mostly it was Democrats and the Biden/Harris Administration … which is still doling out millions.
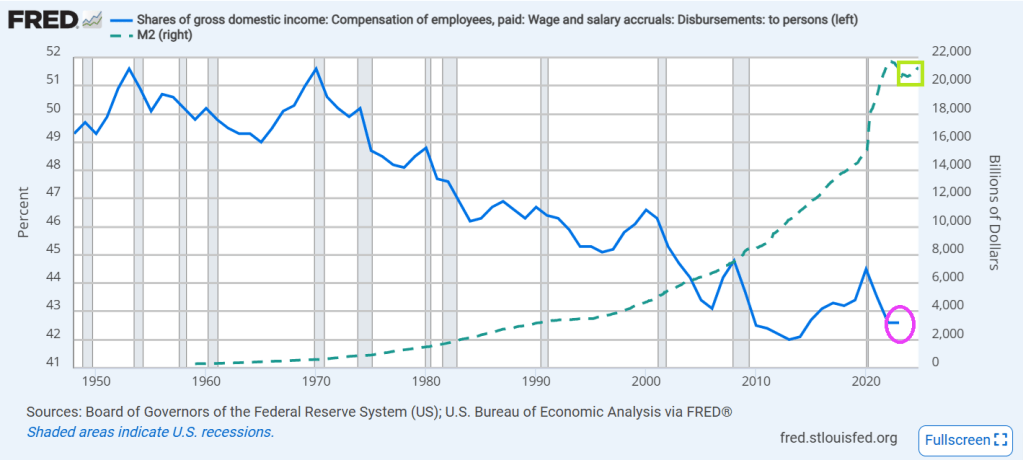
Wage and salary income as a percentage of GDP has fallen from over 50% back in 1970 to 43.1% in 2022. And look at the post Covid decline! And the increase in M2 Money.
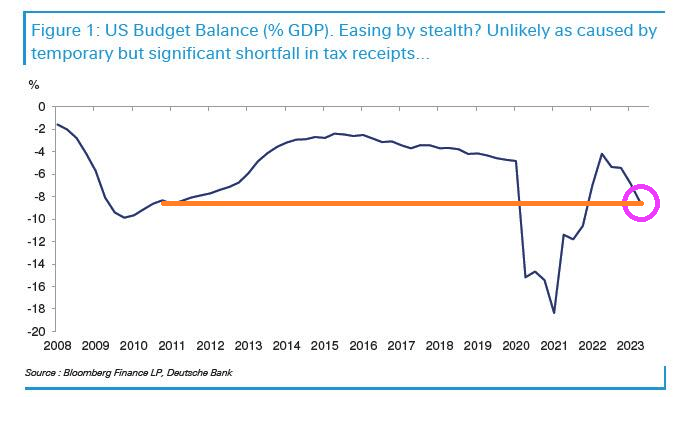
Meanwhile the US budget balance as a % of GDP has been plunging downwards in recent years.
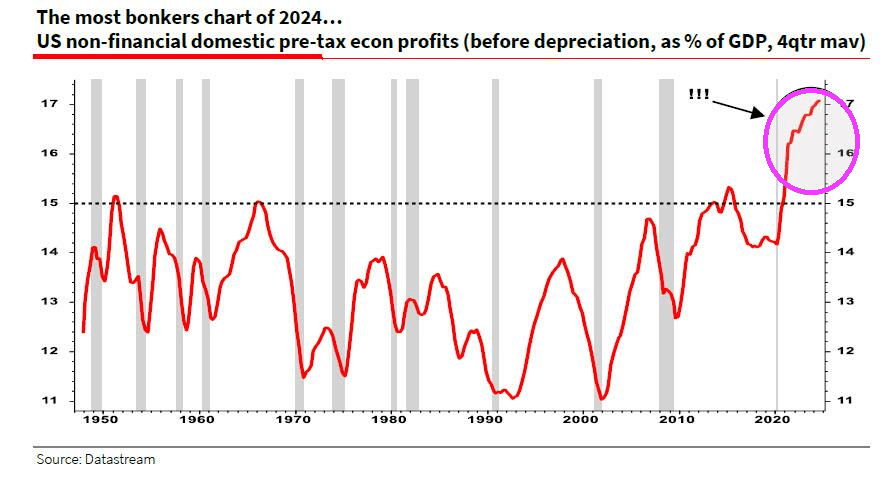
Despite the slowing economy, pre-tax profits post Covid have SOARED!
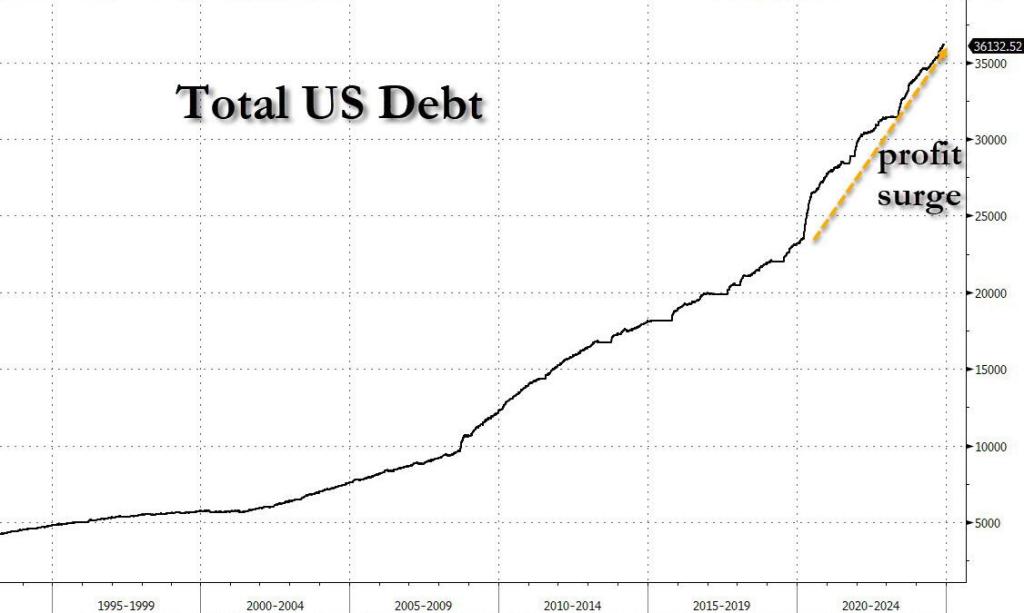
Primarily due to reckless/wasteful Federal spending and FEDERAL DEBT that soared.
There you have it! The Biden/Harris economic “miracle” was simply Federal government malspending that benefitted large corporations and few people.
Joe Biden and his woefully corrupt son Hunter of laptop fame.
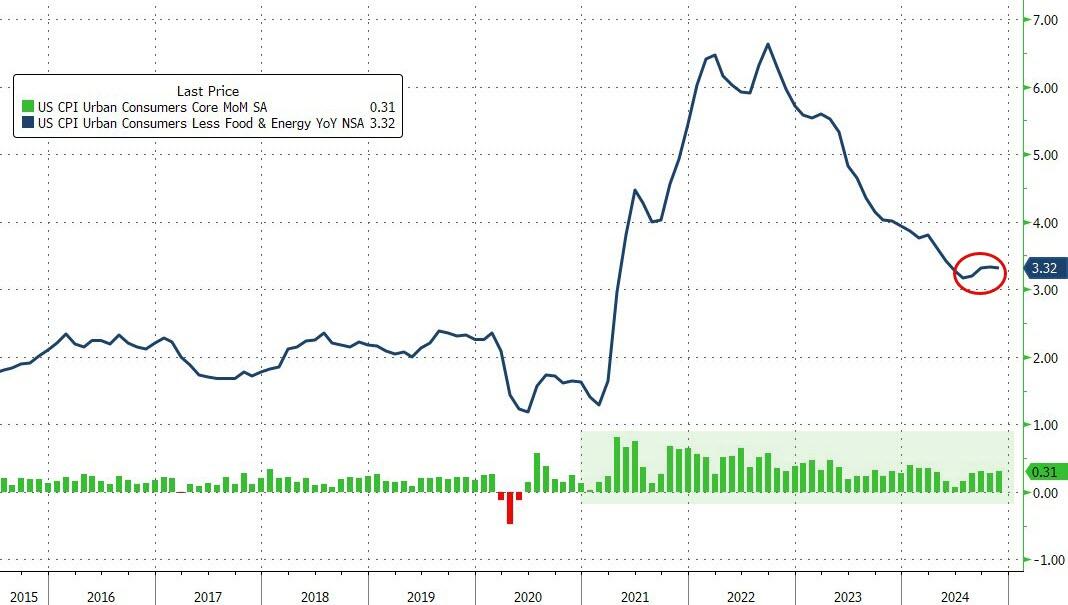
October STICKY core inflation is still up 4% YoY (year-over-year)
Core CPI rose 0.3% MoM (as expected) which pushed it up 3.3% YoY (not even close to the 2% mandate)…
Source: Bloomberg
There has not been a single monthly decrease in core consumer prices since Biden too office.
dddd
Between The Fed’s insane monetary policy and Biden/Harris insane fiscal policies, we are living in a world where Ray Bradbury’s novel Fahrenheit 451 becomes a reality. Instead of books burning, it is the US Dollar burning.
The delinquency rate for commercial mortgage-backed securities (CMBS) tied to office properties reached 10.4 percent in November 2024, approaching the 10.7 percent peak reached during the 2008 financial crisis. The ascent is the fastest two-year increase on record, with rates climbing 8.8 percentage points since late 2022, significantly outrunning the 6.3-point rise seen during the financial crisis nearly 15 years ago.
The office real estate sector has been grappling with a severe downturn for several years now, but are accelerating recently as they are driven by persistently high vacancy rates and declining rents. Property values, particularly for older office buildings, have plummeted, with many losing 50 to 70 percent of their market value and in some cases becoming effectively worthless. Those conditions have left real estate portfolio managers and building owners unable to borrow, refinance or sell properties, contributing to rising delinquencies and foreclosures. (Mortgages become effectively delinquent when payments are missed beyond a standard 30-day grace period.)
On the CMBS front, there have been no upgrades in 2023 and 2024.
Efforts to convert office buildings into residential spaces are increasing but remain limited by structural and economic constraints. Many office towers are unsuitable for conversion due to their large floor plates or prohibitively high retrofitting costs which often exceed the cost of demolition and rebuilding. In 2024, 73 office-to-residential conversions were completed, with an additional 30 underway. Despite plans to increase the pace in 2025, the cumulative impact remains minimal, addressing just 7.9 percent of the 902 million square feet of vacant office space nationwide.
Like a Great White Shark, Bitcoin has breached $100k!
Gold, a competitor to the US Dollar, is down a bit today, but has been rising with the prospect of Trump deregulating the hamstrung US economy. Gold rose under Biden/Harris (and McConnel/Schumer’s) gross fiscal mismanagemment.
Here is a picture of Bitcoin breaching the surface. And why it pays not to surf near seals or sea lions.
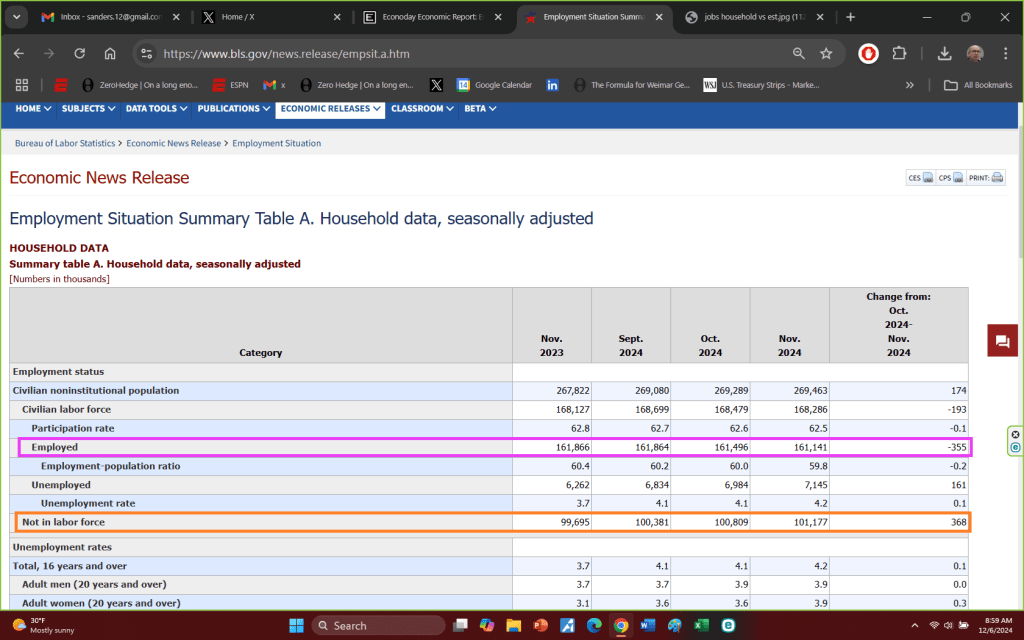
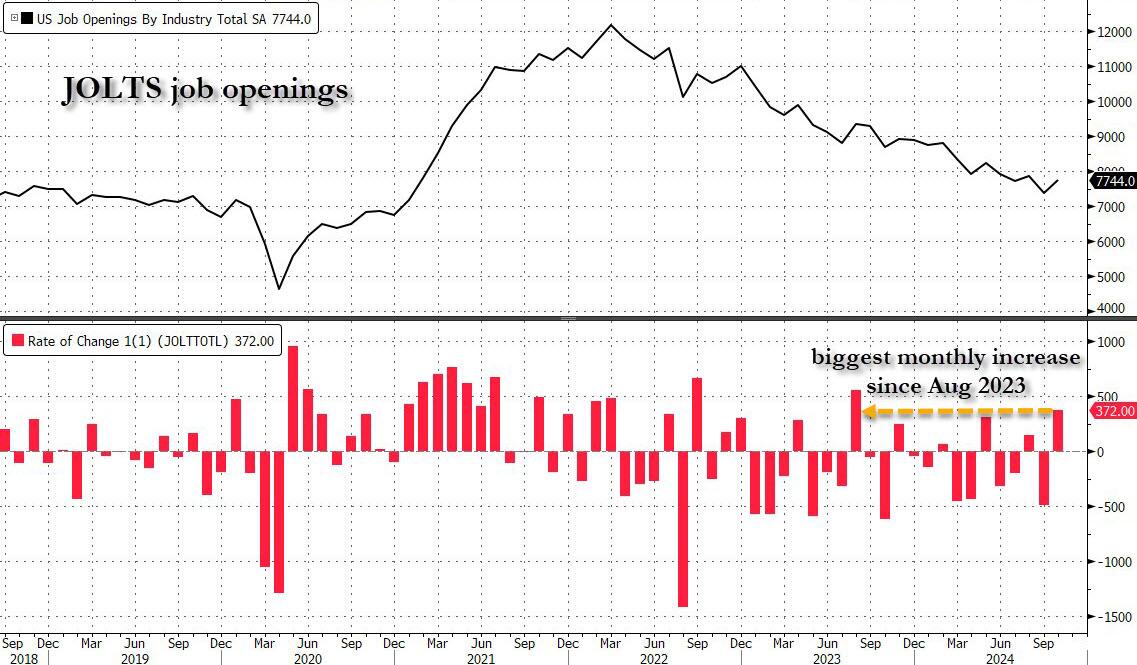
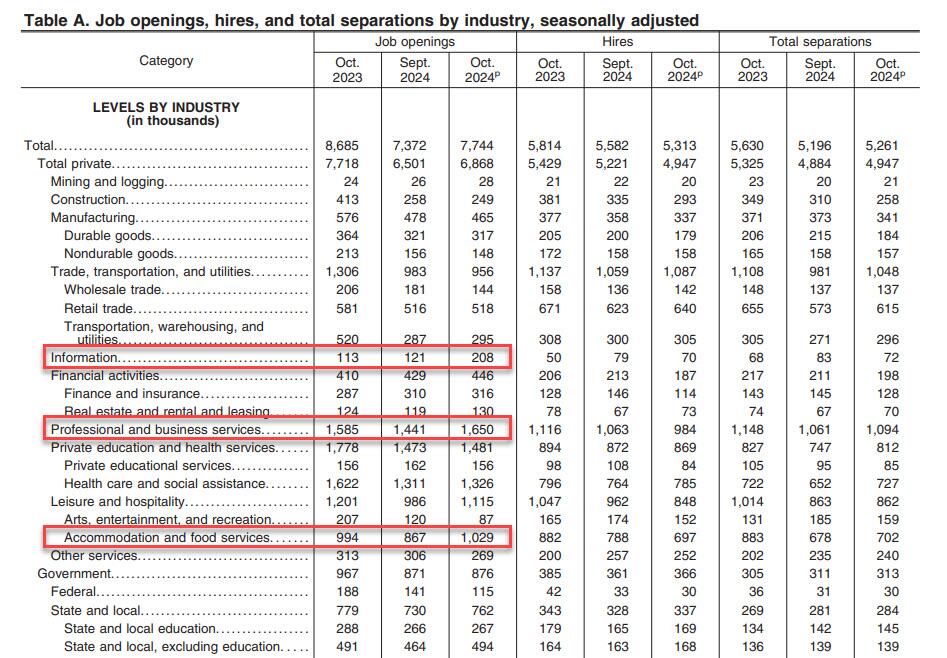
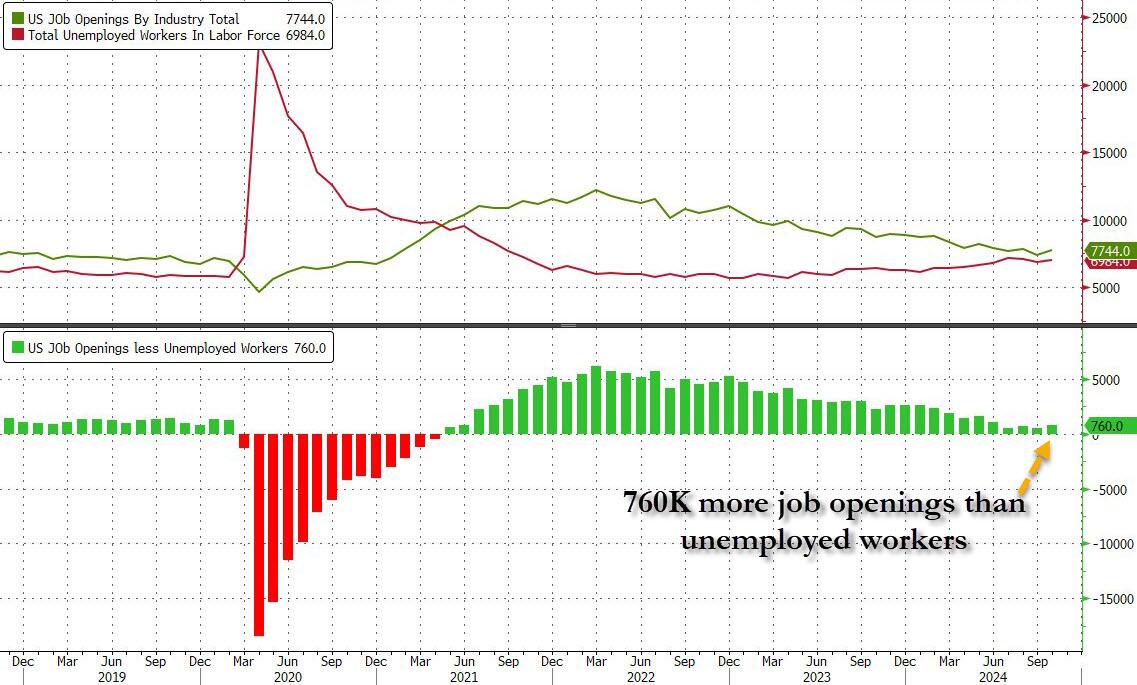
After last month’s catastrophic JOLTS report, which was a disaster across the board, and which was meant to give the Fed a green light to cut rates more after Biden won the election (which he didn’t, but the Fed still had to cut even if Trump is now in control), some speculated that Biden’s Department of Labor will do everything in its power to sabotage further rate cuts by the Fed, most notably the upcoming December decision in two weeks time, by pushing out much stronger than expected economic data. That’s precisely what happened moments ago when the DOL reported that in October, the number of job openings in the US soared by a whopping 372K, the biggest monthly increase since August 2023, to 7.744 million from 7.372 million.
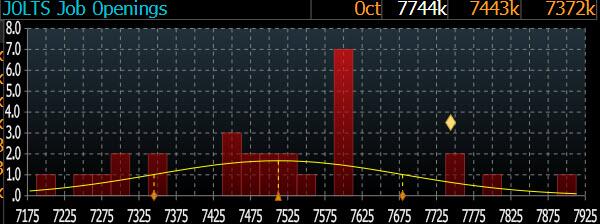
The JOLTS print smashed the median estimate of 7.519 million by 225K…
… with just 4 analysts (out of 28) predicting a higher job openings number.
According to the DOL, the job openings rate, at 4.6 percent, changed little over the month. The number of job openings increased in professional and business services (+209,000), accommodation and food services (+162,000), and information (+87,000) but decreased in federal government (-26,000).
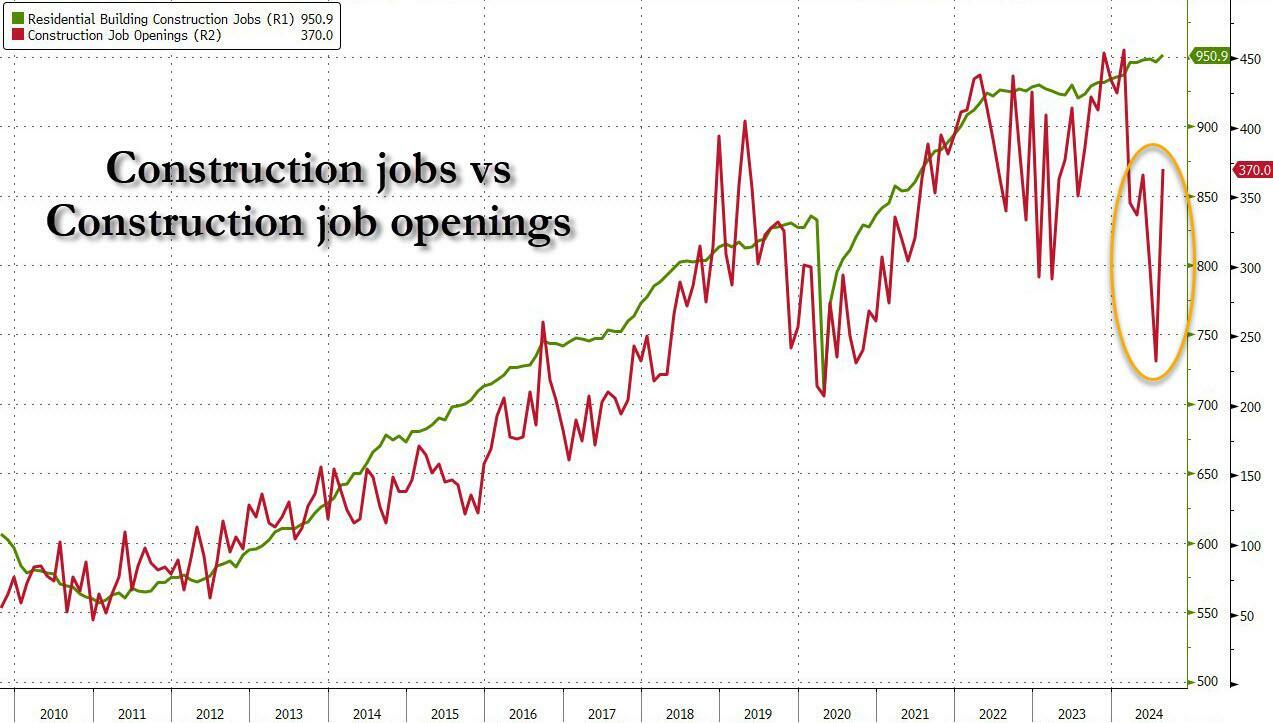
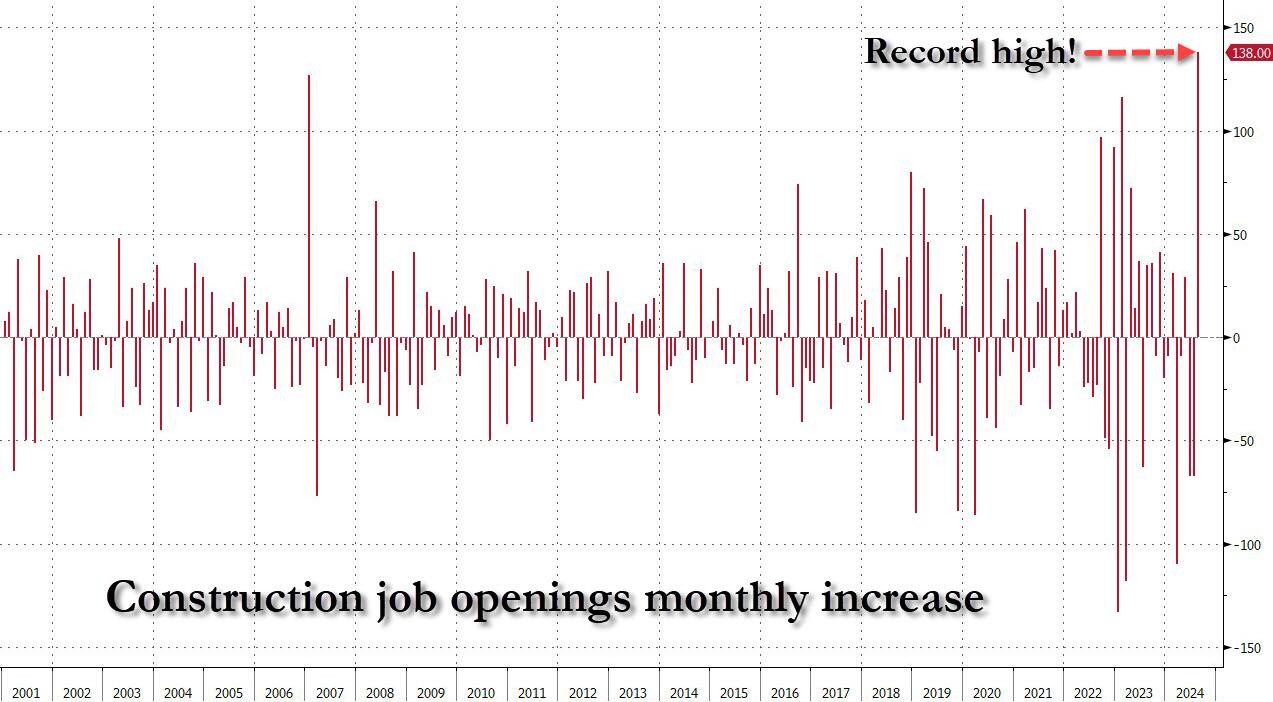
Amusingly, after we mocked two months ago the stunning surge in construction job openings just as a record chasm had opened between the manipulated number of construction jobs and openings…
… which meant the biggest monthly surge in construction job openings on record at a time when the housing market has effectively frozen thanks to sky high interest rates, a simply glorious paradox of manipulated bullshit data…
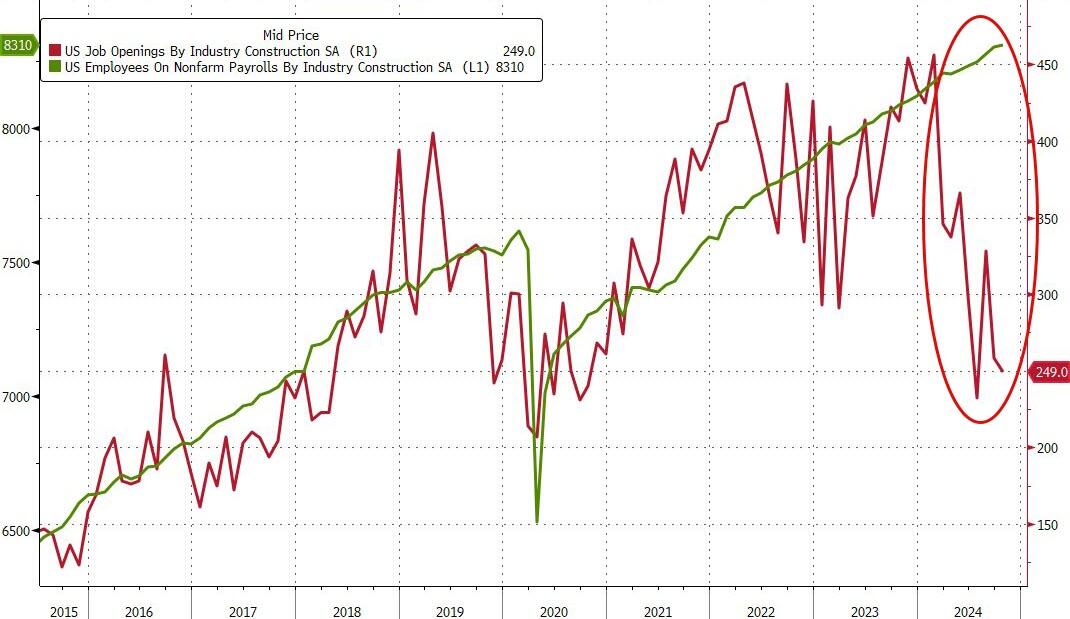
… the BLS realized that it had to make an adjustment after getting called out, and Construction Job openings dropped by another 9K to 249K and back to post-covid lows. Oh, and yes, the number of “construction jobs” is about to fall off a cliff just as soon as Orange Man Bad enters the White House.
Setting the glaring data manipulation aside, in the context of the broader jobs report, in October the number of job openings was 770K more than the number of unemployed workers, an increase from the previous month and not too far from inverting once again, similar to what happened during the covid crash.
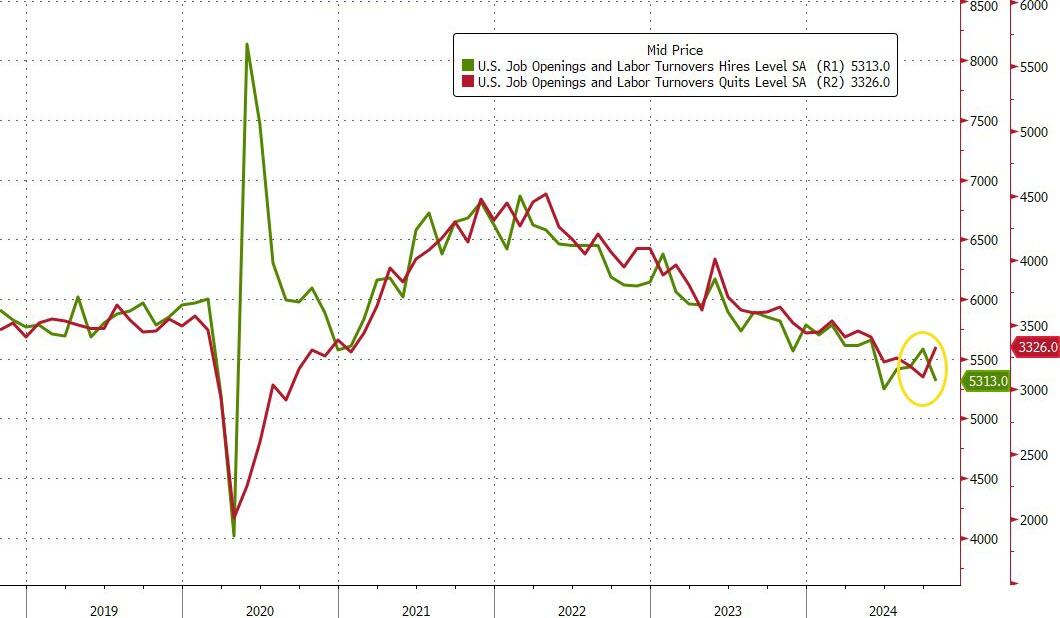
But while the job openings surge was a surprising reversal of the deteriorating trend observed for much of 2024, where even the DOL was stumped was the number of hires, which tumbled from 5.582 million to 5.313 million, a new post-covid low.
Commenting on the plunge, SouthBay Research notes that “hiring was weak in October and the last time hiring was this low was June and NFP slowed to 118K. But remember that this data aligns with the October Payroll data – not November’s. Both October NFP and the latest October JOLTS Hiring data cover the same period (through mid-October).” Furthermore, there were an additional 4 weeks since this JOLTS survey and hurricane recovery (aka hiring) rebounded. In addition, as the Job Openings indicate, employer intent to hire was already underway when this survey was completed.
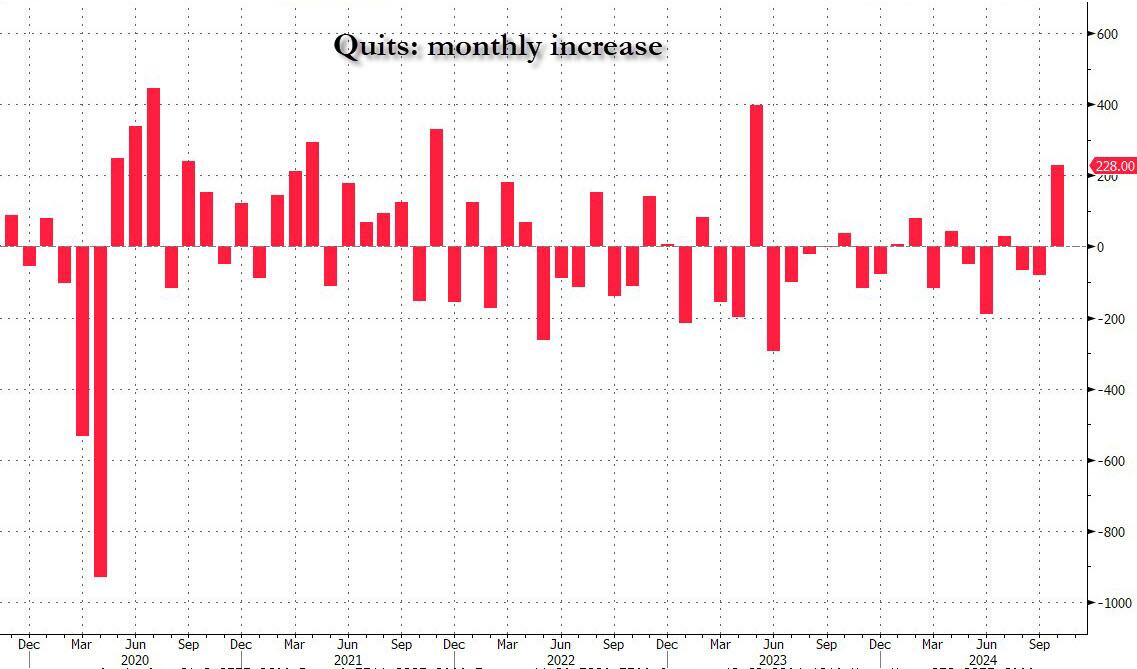
Meanwhile, the drop in hiring was offset by a surprise spike in the number of Quits, which rose by 228K from 3.098MM to 3.326MM, the biggest increase since May 2023, with quits increasing in accommodation and food services (+90,000).
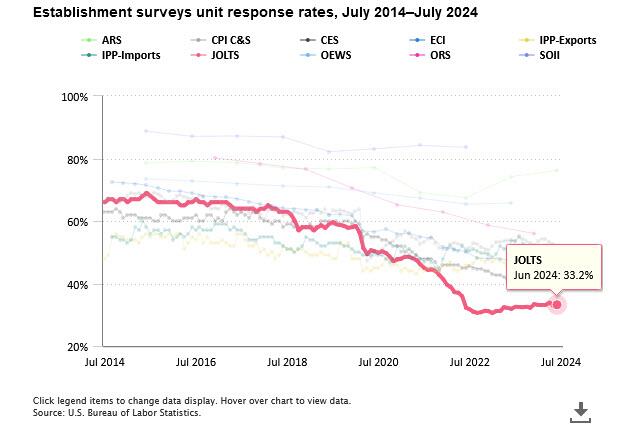
Finally, no matter what the “data” shows, let’s not forget that it is all just estimated, and it is safe to say that the real number of job openings remains still far lower since half of it – or some 70% to be specific – is guesswork. As the BLS itself admits, while the response rate to most of its various labor (and other) surveys has collapsed in recent years, nothing is as bad as the JOLTS report where the actual response rate remains near a record low 33%
In other words, more than two thirds, or 67% of the final number of job openings, is made up!
Looking ahead to Friday’s November Nonfarm Payrolls, the report will be driven by hurricane recovery, with the JOLTS data pointing to a lot of weakness in exactly the areas October Payrolls slipped. As for organic hiring, there have been no anecdotal signs of hiring pullback heading into November. On the contrary: businesses seem to be inclined to ramp up a bit, now that Trump is president and promises a dramatic easing of regulations.
The last gasp of the Biden/Harris reign of (economic) error!
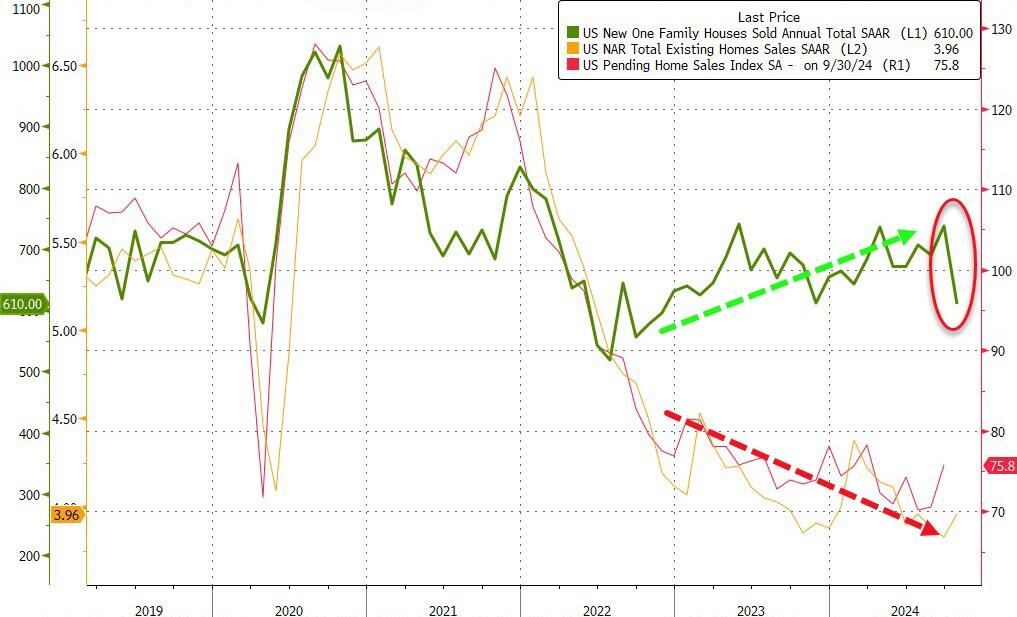
After existing home sales unexpectedly ticked up in October, analysts expected new home sales to slow after their recent resurgence (-1.8% MoM). They were right… BUT… the magnitude is mind-boggling!
New Home Sales collapsed 17.3% MoM in October. That is the largest MoM drop since July 2013.
Source: Bloomberg
That MoM plunge dragged sales down 9.4% YoY to 610k SAAR – the lowest since Nov 2022
Source: Bloomberg
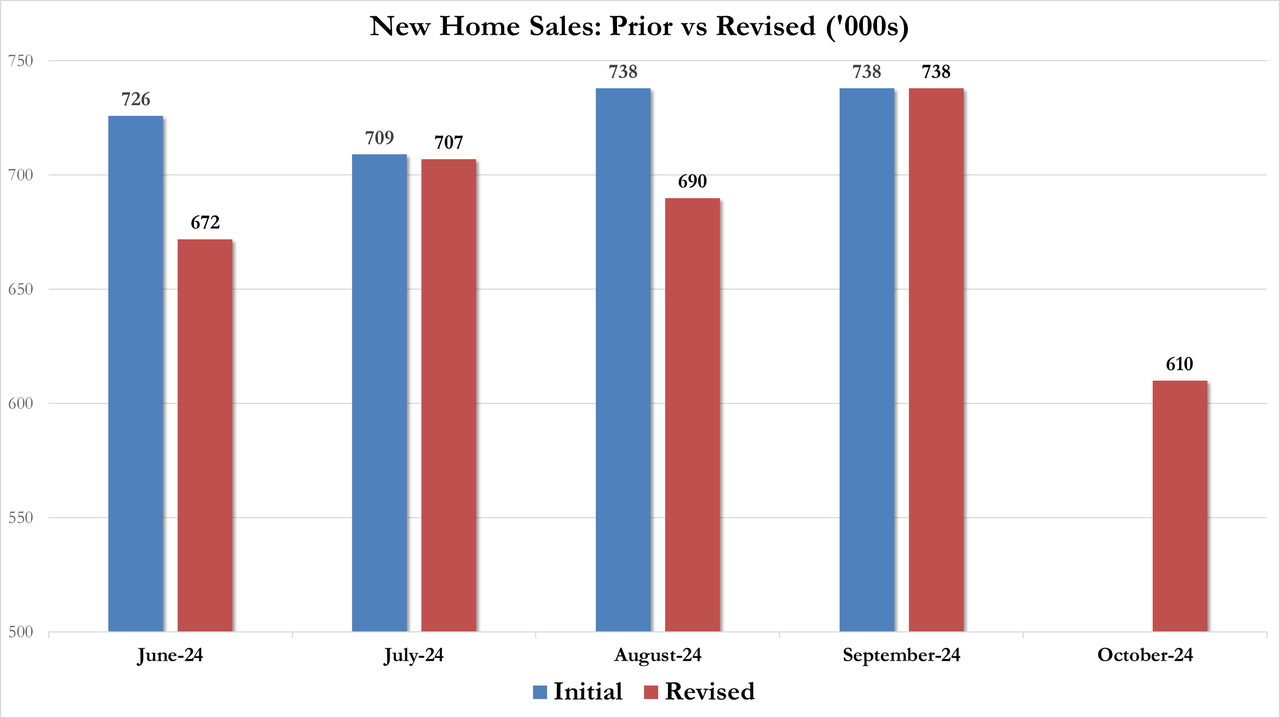
Of course, all the revisions are lower…
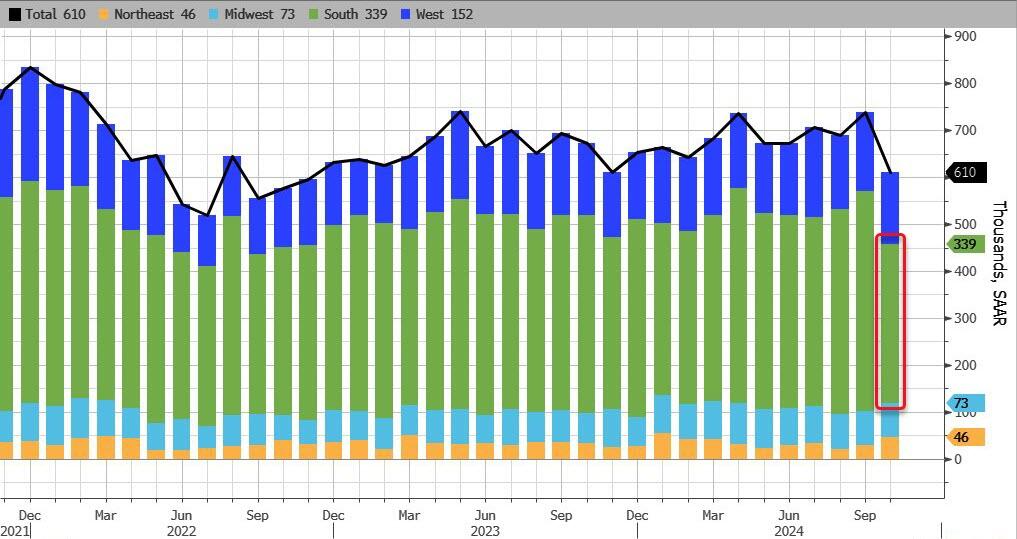
Hurricanes Helene and Milton, which tore through parts of the Southeast, delayed sales in the nation’s biggest housing region and dragged down sales overall.
Sales in the South decreased 28% to 339,000, the slowest pace since April 2020. Sales also fell in the West, but rose in the Northeast and the Midwest.
Source: Bloomberg
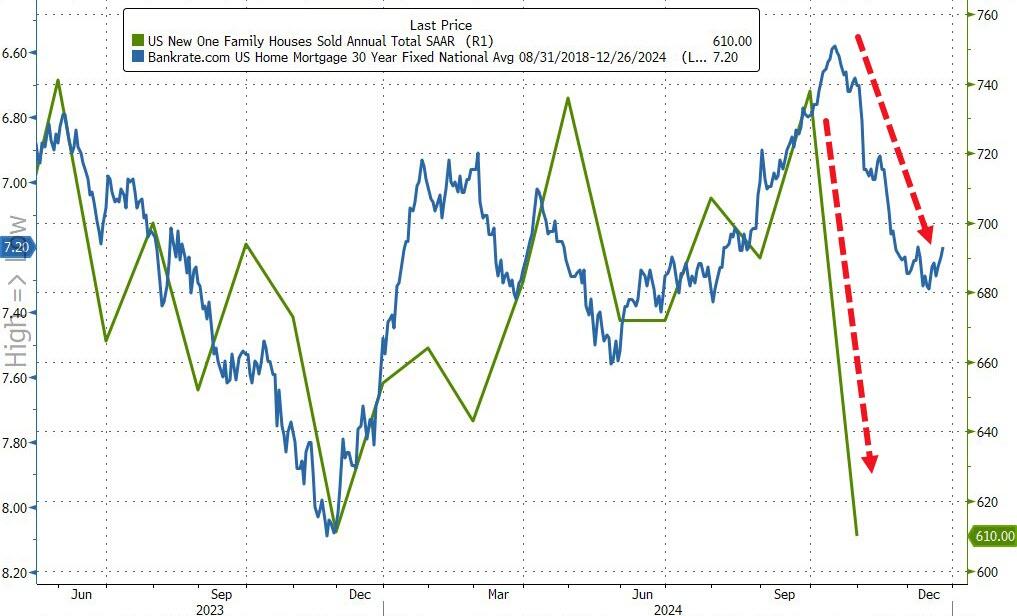
Finally, we note that the median sale price of a new home increased to $437,300 in October, the highest in 14 months.
Does this mean November’s data will see a massive surge in new home sales? …even as rates have increased significantly?


You must be logged in to post a comment.