Shocker! October Payrolls Huge Miss As Private Jobs Go Negative For First Time Since 2020 (-28k Private Jobs Added)

October jobs report was a real shocker!!

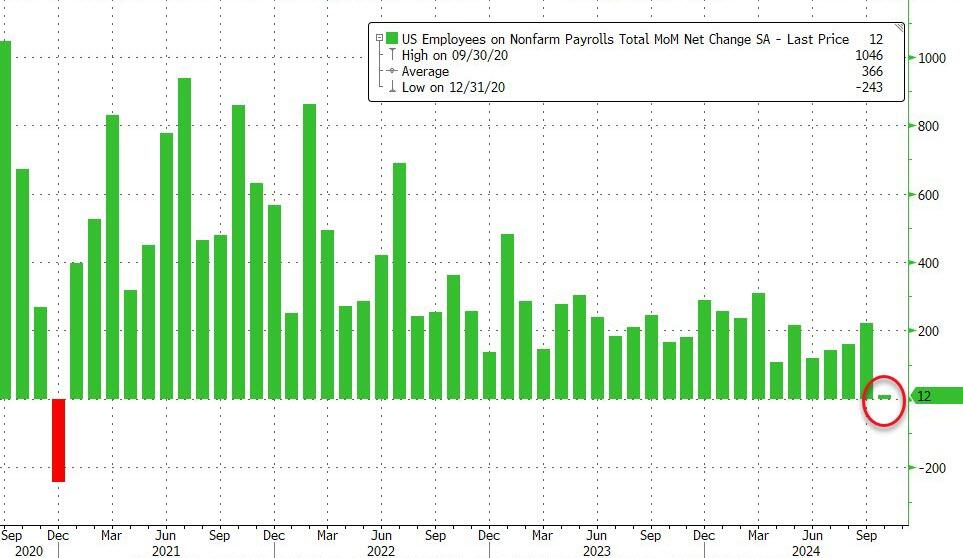
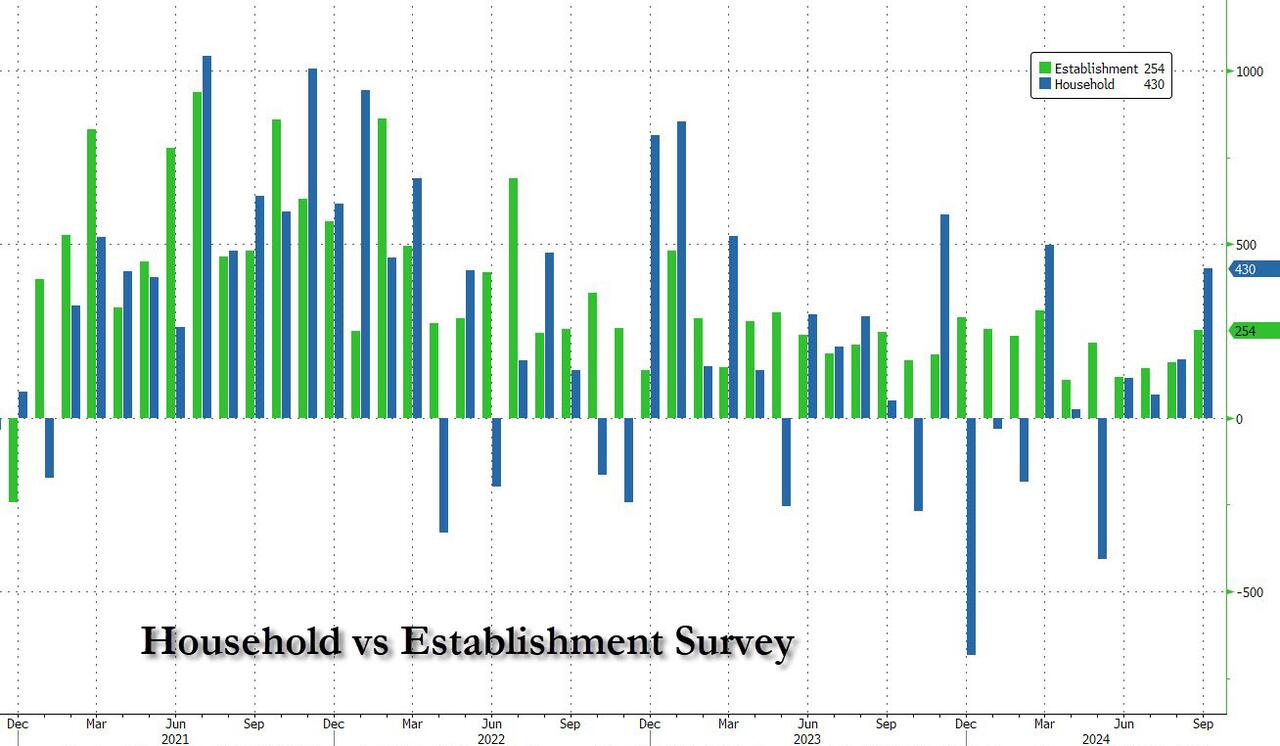
Moments ago the BLS reported the highly anticipated number and… it was close: the monthly print was only 12K, a huge drop from the pre-revision 254K in October (revised naturally lower to 223K), and just 13K away from a negative print. Only 12k total jobs added! And -28k private jobs added!

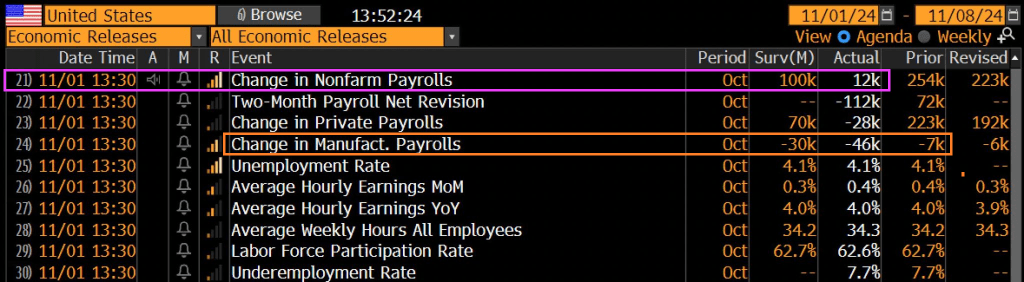
Total jobs including government rose by a measly 12k.

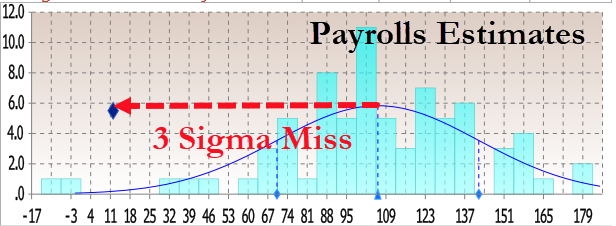
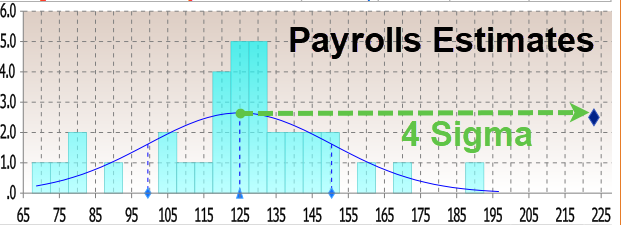
The print was so low it was only above the two lowest estimates (those of Bloomberg Econ for -10K and ABN Amr0 for a 0 print). That means it was a 3 sigma miss to estimates.

And of course, as has been the case for the entire Biden admin, previous months were revised sharply lower once again: August was revised down by 81,000, from +159,000 to +78,000, and September was revised down by 31,000, from +254,000 to +223,000. With these revisions, employment in August and September combined is 112,000 lower than previously reported. This means that even after the monster September revision when 818K jobs were removed, 7 of the past 9 months were again revised lower!

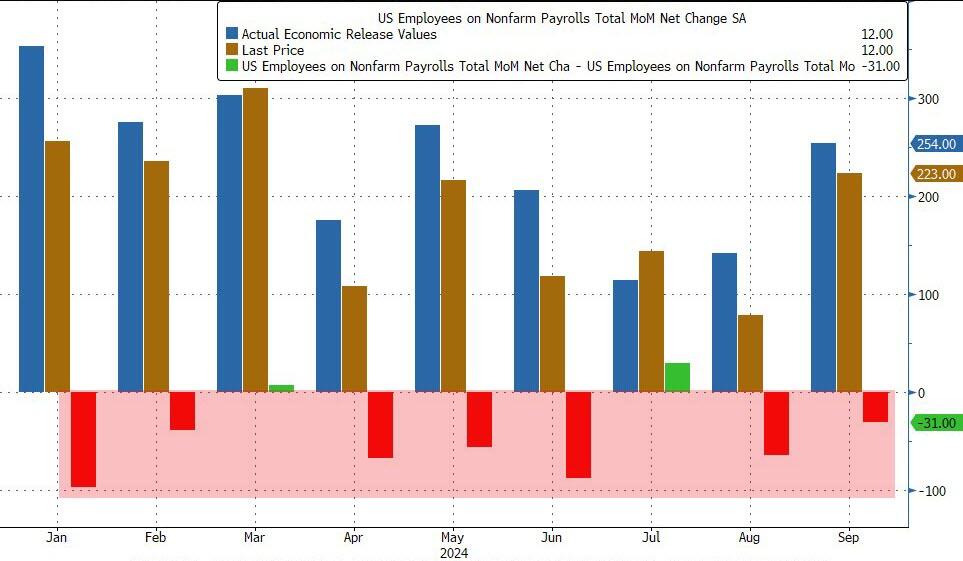
This means that once the November jobs are released, we can be virtually certain that October will be revised to negative.

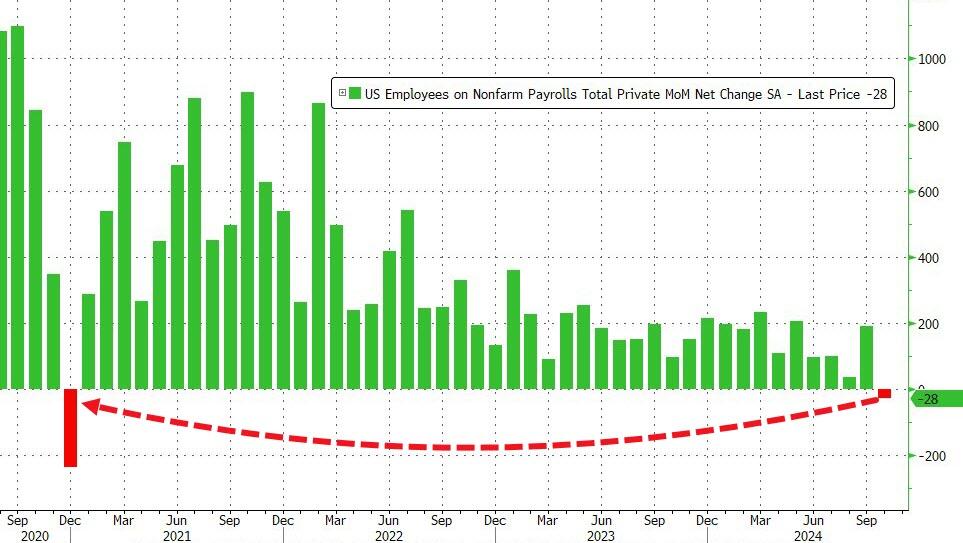
But wait, there’s more because while the total payroll number was just barely positive, if one excludes the 40K government jobs, private payrolls was in fact negative to the tune of -28K, down from 223K pre-revision last month, and the first negative print since December 2020. In other words, we were right… when it comes to actual, non-parasite “government” jobs.

To be sure, a big part of the drop was due to the one-time event discussed, including the Boeing strike and Hurricanes Helene and Milton. This is what the BLS said on the topic: “In October, the household survey was conducted largely according to standard procedures, and response rates were within normal ranges” however, “the initial establishment survey collection rate for October was well below average. However, collection rates were similar in storm-affected areas and unaffected areas. A larger influence on the October collection rate for establishment data was the timing and length of the collection period. This period, which can range from 10 to 16 days, lasted 10 days in October and was completed several days before the end of the month.”

More importantly, the BLS said that “it is likely that payroll employment estimates in some industries were affected by the hurricanes; however, it is not possible to quantify the net effect on the over-the-month change in national employment, hours, or earnings estimates because the establishment survey is not designed to isolate effects from extreme weather events. There was no discernible effect on the national unemployment rate from the household survey.”

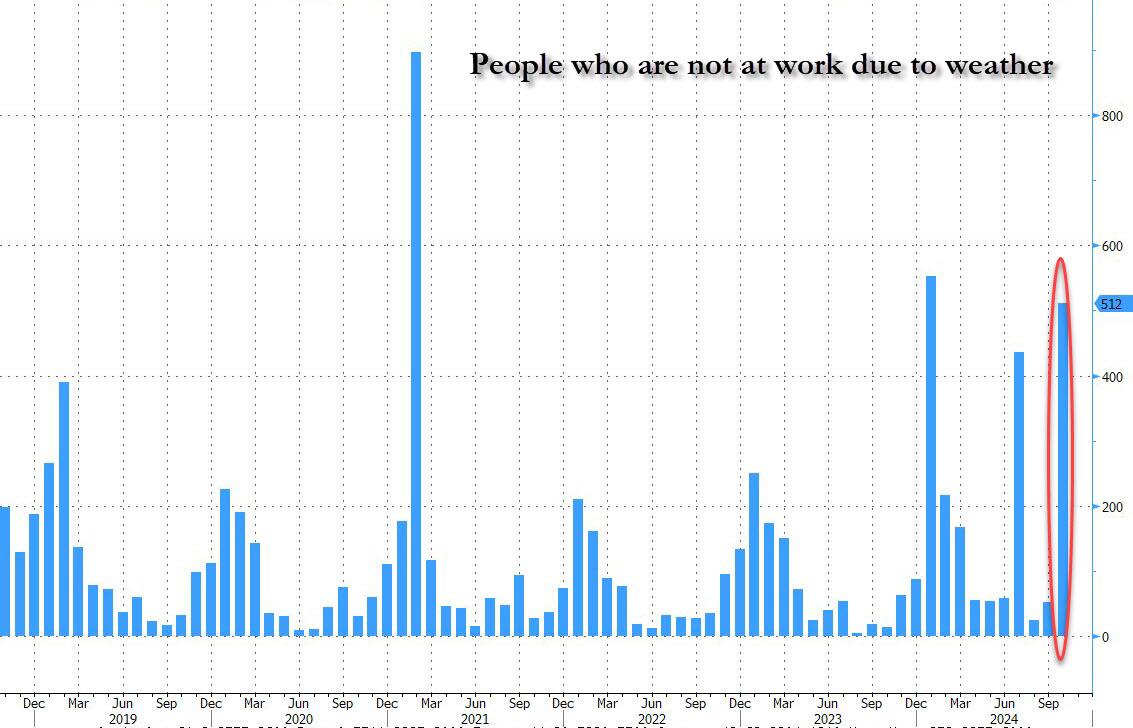
Ironically, while the BLS was unable to “quantify the net effect” from the hurricanes, it was able to calculate that the number of people not at work due to weather surged to the third highest in recent history, up 512K!

In other words, the BLS now has an excuse to blame the plunge on, it just doesn’t know how to quantify it. Translation: if Trump is president next month, expect the downtrend to continue with little to no mention of hurricane as the BLS prepares to admit the true state of the labor market; if however Kamala wins, the November jobs will magically rebound (even as downward revisions accelerate) and all shall be back to fake normal.

Oh, and of course, today’s catastrophic jobs print gives the Fed a full carte blanche to again cut 25bps next week, even if the plunge was all hurricanes…

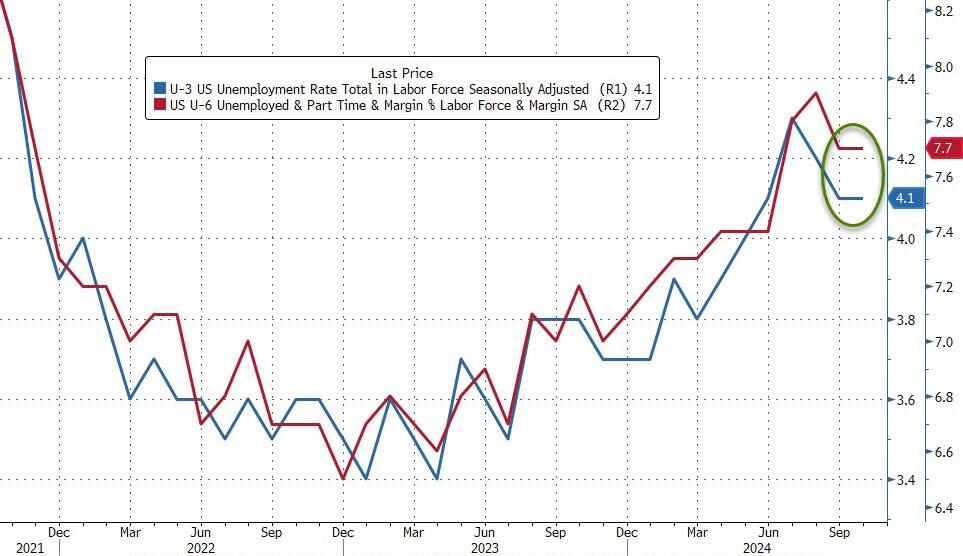
The rest of the jobs report was not that exciting: the unemployment rate printed at 4.1%, unchanged from last month and in line with expectations. The number of unemployed people was little changed at 7.0 million.

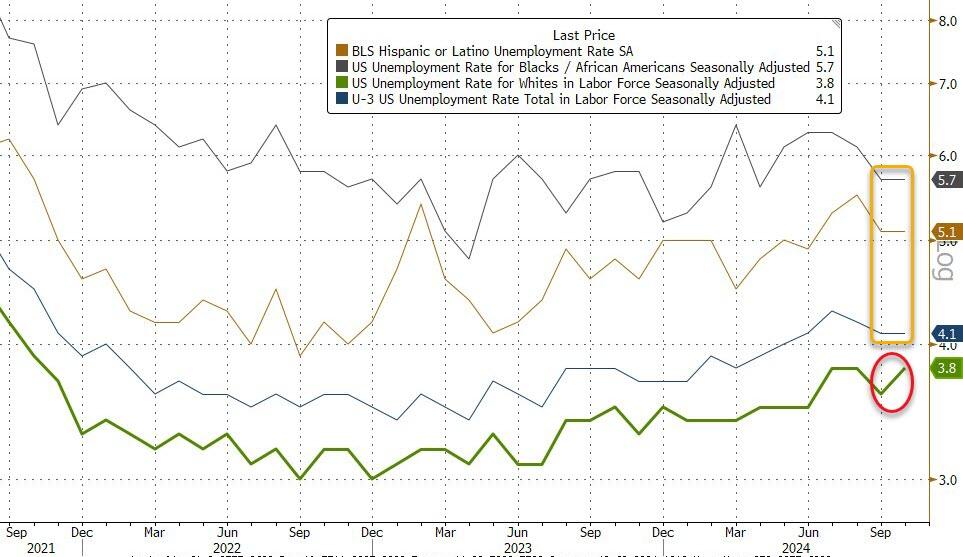
Among the major worker groups, the unemployment rates for adult men (3.9 percent), adult women (3.6 percent), teenagers (13.8 percent), Whites (3.8 percent), Blacks (5.7 percent), Asians (3.9 percent), and Hispanics (5.1 percent) showed little or no change over the month.

It’s worth noting that the unemployment rate actually rose almost 0.1% despite being reported as flat because in September it was 4.05% and in October it was 4.145%, and rose due to a surge in layoffs (+166K) as well as re-entrants (+108K). Additionally, as Southbay research notes, the average duration of unemployment rose from 22.6 weeks to 22.9 weeks

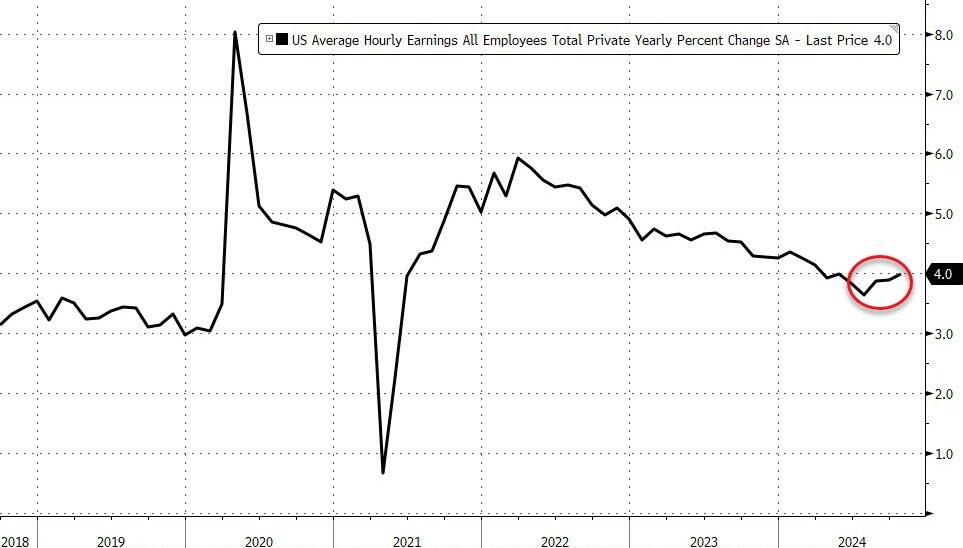
Wage growth came in slightly higher than expected, with average hourly earnings rising 0.4% in October, higher than the 0.3% expected, and up from the downward revised 0.3% in September (was 0.4%). On an annual basis, earnings rose 4.0%, in line with expectations, and above the downward revised 3.9% (was 4.0%).

Some more stats from the latest monthly report:

  • Among the unemployed, the number of permanent job losers edged up to 1.8 million in October. The number of people on temporary layoff changed little at 846,000.
  • The number of long-term unemployed (those jobless for 27 weeks or more) was little changed at 1.6 million in October. This measure is up from 1.3 million a year earlier. In October, the long-term unemployed accounted for 22.9 percent of all unemployed people.
  • Both the labor force participation rate, at 62.6 percent, and the employment-population ratio, at 60.0 percent, changed little in October.
  • The number of people employed part time for economic reasons was little changed at 4.6 million in October.
  • The number of people not in the labor force who currently want a job, at 5.7 million, was essentially unchanged in October. These individuals were not counted as unemployed because they were not actively looking for work during the 4 weeks preceding the survey or were unavailable to take a job.
  • Among those not in the labor force who wanted a job, the number of people marginally attached to the labor force, at 1.6 million, was little changed in October. These individuals wanted and were available for work and had looked for a job sometime in the prior 12 months but had not looked for work in the 4 weeks preceding the survey. The number of discouraged workers, a subset of the marginally attached who believed that no jobs were available for them, changed little at 379,000 in October.

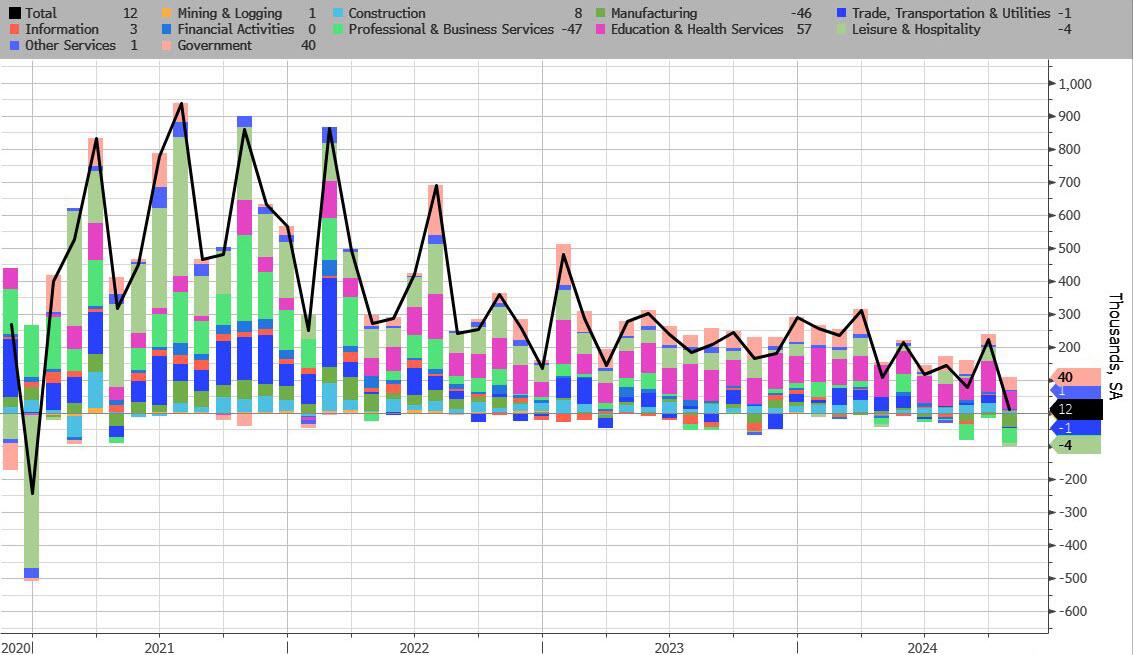
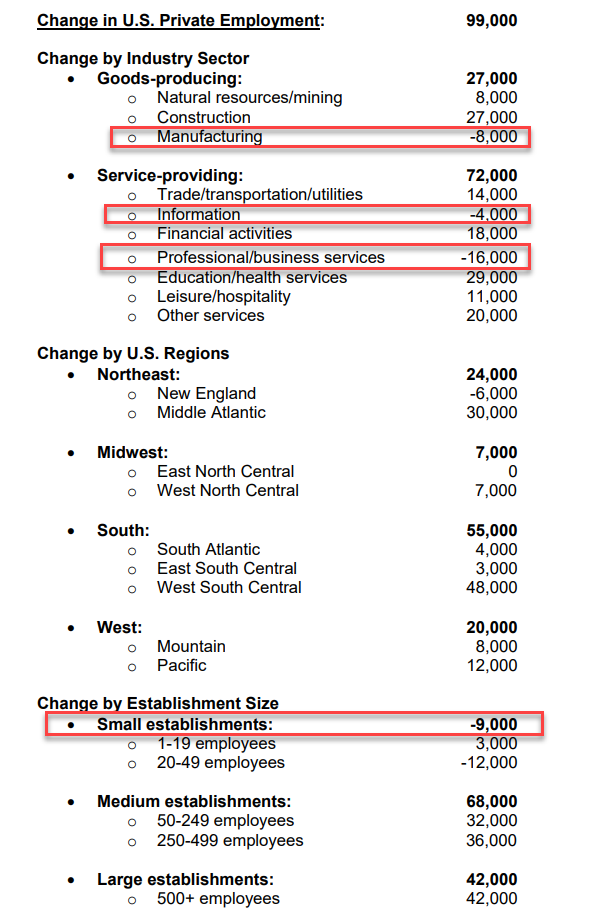
Turning to the establishment survey, we find the following breakdown in jobs:

  • Health care added 52,000 jobs in October, in line with the average monthly gain of 58,000 over the prior 12 months. Over the month, employment rose in ambulatory health care services (+36,000) and nursing and residential care facilities (+9,000).
  • Employment in government continued its upward trend in October (+40,000), similar to the average monthly gain of 43,000 over the prior 12 months. Over the month, employment continued to trend up in state government (+18,000).
  • Within professional and business services, employment in temporary help services declined by 49,000 in October. Temporary help services employment has decreased by 577,000 since reaching a peak in March 2022.
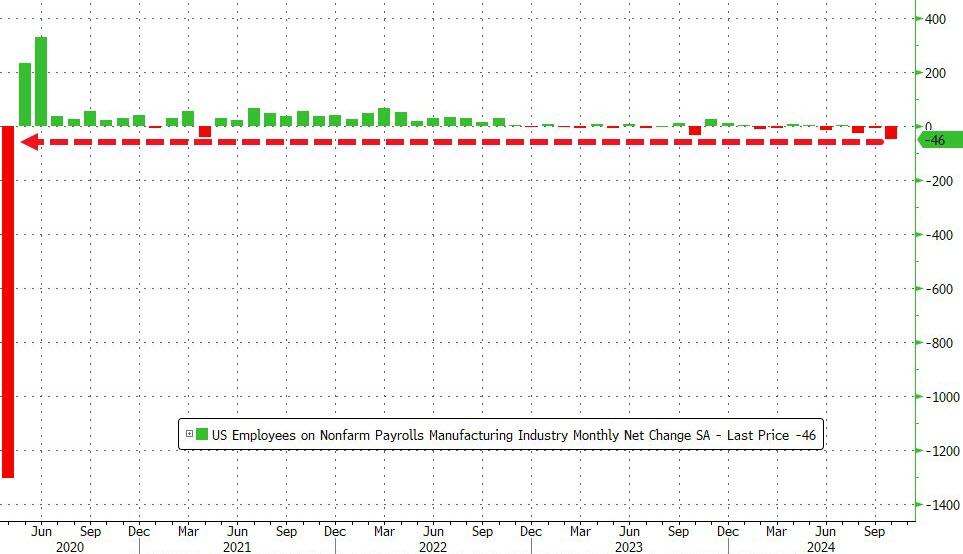
  • Manufacturing employment decreased by 46,000 in October, reflecting a decline of 44,000 in transportation equipment manufacturing that was largely due to strike activity.
  • Employment in construction changed little in October (+8,000). The industry had added an average of 20,000 jobs per month over the prior 12 months. Over the month, nonresidential specialty trade contractors added 14,000 jobs.
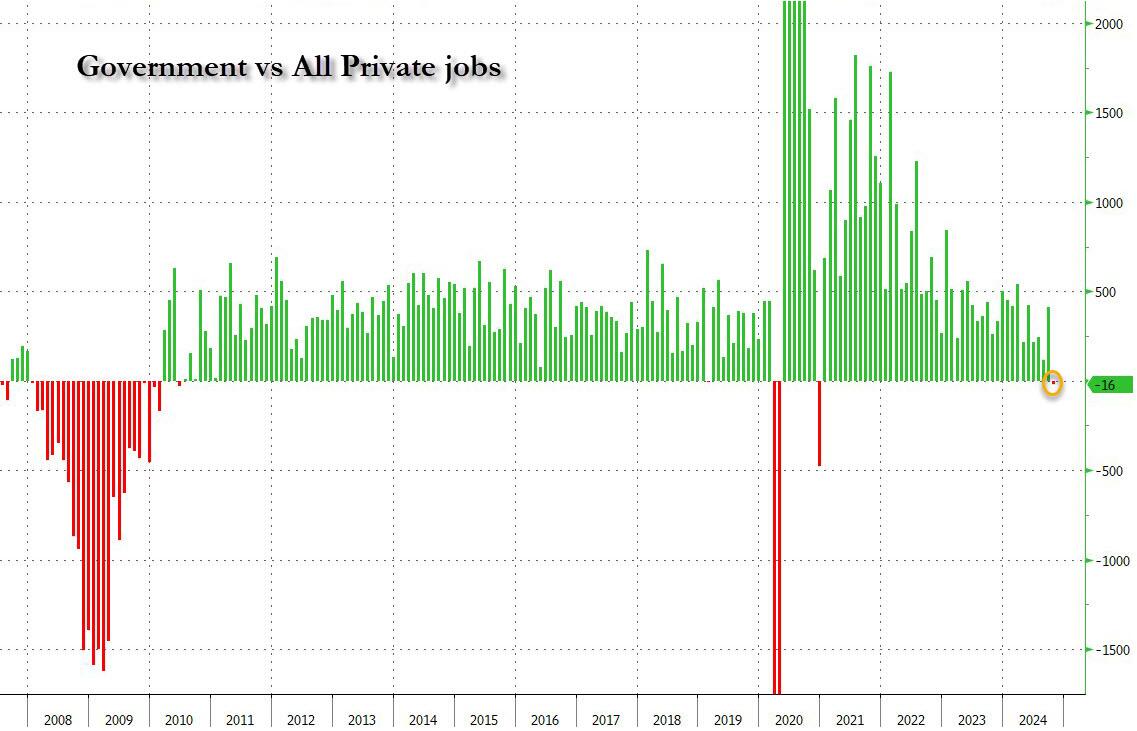
And visually:

Three things stick out here:

  • First, manufacturing is a disaster, with the US losing manufacturing jobs for 3 months in a row, and 4 of the last 5. Can’t blame that on hurricanes.

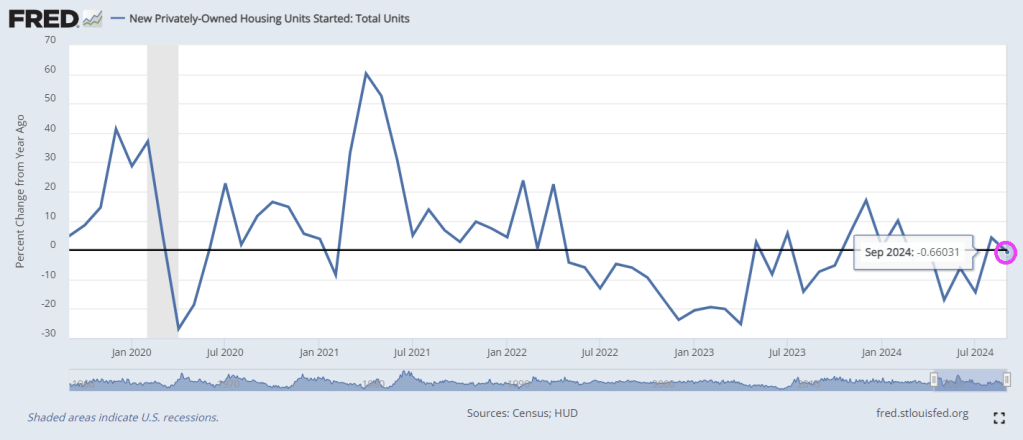
  • Second, the number of construction jobs is becoming absolutely ridiculous, especially when contrasted with the plunge in actual housing starts, completions and last but not least, actual job openings.

  • Finally, delta between government jobs and private jobs was a whopping 12K, the biggest since covid. This means that more government jobs were added in October than all private jobs lost in the month! Just in case you needed to know how the Biden admin avoided a negative total headline print.

Mortgage Purchase Index Decreased 5 Percent From Previous Week (I’ll Feel A Whole Lot Better If Harris Loses)

I’ll feel a whole lot better … when Kamala Harris is gone.

Mortgage applications decreased 6.7 percent from one week earlier, according to data from the Mortgage Bankers Association’s (MBA) Weekly Applications Survey for the week ending October 18, 2024.

The Market Composite Index, a measure of mortgage loan application volume, decreased 6.7 percent on a seasonally adjusted basis from one week earlier. On an unadjusted basis, the Index decreased 7 percent compared with the previous week. The seasonally adjusted Purchase Index decreased 5 percent from one week earlier. The unadjusted Purchase Index decreased 5 percent compared with the previous week and was 3 percent higher than the same week one year ago.

The Refinance Index decreased 8 percent from the previous week and was 90 percent higher than the same week one year ago.

Implied volatility in Treasury yields has risen to the highest since December.

US Housing Starts & Building Permits Plunge In September (Down -0.7% YoY)

September! Or Get Down!

Housing starts dropped -0.7% YoY in September.

After surprising top the upside in August, Housing Starts and Building Permits disappointed in September, declining more than expected (-0.5% MoM and -2.9% MoM respectively)…

Source: Bloomberg

Under the hood, multi-family permits plunged 10.8% MoM (and multi-family starts dropped for the second straight month). Single-family starts rose 2.7% MoM and permiots inchjed higher by 0.3% MoM…

Source: Bloomberg

Rate-cut expectations appear to have taken the excitement out of the building market…

Source: Bloomberg

Housing Completions also dropped (but the BLS thinks construction jobs continue to rise non-stop)…

Source: Bloomberg

So, The Fed cuts short-term rates… mortgage-rates rise… and builders slow their building plans… that’s not how it’s supposed to work!

Economy Breaker! Small Business Optimism Under Biden/Harris Remains Depressed

Communications breakdown! As Harris wordsalads her vision of the economy saying small businesses are the backbone of the US economy, but small businesses aren’t feeling it.

Small business optimism remains below 100 at 91.5.

Perhaps the themesong of Harris/Walz should be “economy breaker.” Or former San Francisco Mayor Willie Brown’s livin’, lovin’ maid.

Thunderstruck! US Unemployment Rate Is 8.7%, More Than Double BLS Estimate Of 4.1% (Mortgage Rates Rising With Declining BLS Estimates)

Thunderstruck! Interest rates should be thunderstruck when realization dawns that the recend BLS jobs reporr was grossly mismeasured.

National unemployment was 8.7% in this month’s Rasmussen Reports Real Unemployment and significantly more than double the 4.1% rate officially reported by the Bureau of Labor Statistics today. 

Mortgage rates are rising again with Friday’s surprising jobs report. But as it just a false election report. If Rasmussen is correct, mortgage rates should FALL again.

US Jobs Surge! BIG Fed Policy Error Or Gov’t Election Manipiulation? (785,000 Gov’t Workers Added In September)

It turns out that Powell’s “emergency” 50bps rate cut was – drumroll – another major policy mistake by the Fed. Or it is Presidential election interference by The Biden/Harris Administration giving Cacklin’ Kamala as talking point?

Moments ago, the BLS reported that at a time when prevailing consensus was for jobs to continue their recent downward slide sparked by the near-record annual jobs revision and several months of downbeat jobs reports, in September the US unexpectedly added a whopping 254K jobs, the biggest monthly increase since March…

… and above the highest estimate (which as noted last night was from Jefferies at 220K). In fact, the number was a 4-sigma beat to the median estimate!

There’s more: unlike previous months where we saw repeat downward job revisions, the BLS said that both prior months were revised up, to wit: the change in total nonfarm payroll employment for July was revised up by 55,000, from +89,000 to +144,000, and the change for August was revised up by 17,000, from +142,000 to +159,000. With these revisions, employment in July and August combined is 72,000 higher than previously reported.

Some context: as UBS notes, the moving six-month average on nonfarm payrolls is 167k. The estimate is that 150k is about consistent with a return of the economy to trend growth. Which means that inflation is about to come back with a vengeance, just as the Fed launches its easing cycle.

Remarkably, while payrolls jumped by the most in half a year, the number of employed people also surged, rising by a whopping 430K, also the biggest one-month jump since March.

It wasn’t just the payrolls, however, which came in far stronger than estimates: the unemployment rate also came in stronger than expected, and thanks to the jump in employed workers coupled with the decline in unemployed workers (from 7.115MM to 6.834MM), it dropped from 4.2% to 4.1% (and down from 4.3% two months ago which spared the entire recession panic).

Among the major worker groups, the unemployment rate for adult men (3.7 percent) decreased in September. The jobless rates for adult women (3.6 percent), teenagers (14.3 percent), Whites (3.6 percent), Blacks (5.7 percent), Asians (4.1 percent), and Hispanics (5.1 percent) showed little or no change over the month.

And here is the rub, because in a vacuum the super strong jobs numbers would have been fantastic, the only issue is that the September blowout comes as the Fed launches an easing cycle and as wages are once again rising as we have warned for the past 3 months. Indeed, in September, the average hourly earnings rose 0.4% sequentially, beating the estimate of 0.3%, while on an annual basis, wage growth was 4.0%, up from an upward revised 3.9% and beating the 3.8% estimate.

One note here: the average workweek for all employees edged down by 0.1 hour to 34.2 hours in September, which means the hourly earnings increase is not “pure” but rather a function of denominator adjustments. In manufacturing, the average workweek was unchanged at 40.0 hours, and overtime edged down by 0.1 hour to 2.9 hours. The average workweek for production and nonsupervisory employees on private nonfarm payrolls remained at 33.7 hours.

What sector had the biggest growth? UNPRODUCTIVE government workers! A record 785,000 government workers were added in September, pushing total govt workers also to a new record high.

The Biden/Harris Administration has given away billions of dollars to foreign nations (like Ukraine) and illegal immigrants so far this year,

– $24,400,000,000 to Ukraine.

– $11,300,000,000 to Israel.

– $1,950,000,000 to Ethiopia.

– $1,600,000,000 to Jordan.

– $1,400,000,000 to Egypt.

– $1,100,000,000 to Afghanistan.

– $1,100,000,000 to Somalia.

– $1,000,000,000 to Yemen.

– $987,000,000 to Congo.

– $896,000,000 to Syria.

– $9,000 per illegal immigrant that has entered the U.S.

And claim that FEMA has no money left for Hurricane Helene victims who have received only $750 per person. So I have plenty of reasons to have no trust or confidence in the Biden/Harris Mal-administration.

On The Harris/Walz Price Control Scam: PPI (Prices Producers Paid) Soared MORE Than CPI (Prices Consumers Paid)

Kamala Harris and Tim Walz have produced a destructive proposal to solve the inflation problem: price controls. Her biggest supporters like Elizabeth Warren and Ohio’s Sherrod Brown love the idea of meddling in the private sector,

But I would be symapatheic to their arguement if consumer prices soared more than producer prices. However, the truth is that prices paid by producers (PPI) SOARED far more than prices paid by consumers (CPI).

The cause? Federal goverment spending (green line) exploded with Covid. Harris/Walz are proposing massive spending under her administration hence there will be MORE inflation under Harris/Walz. So, the have to rely on flawed gimmics like price controls. Which will lead to shortage, food lines, rastioning, etc.

Market participants are expecting a 50 BPS cut tomorrow. From 5.50% to 4.913%.

This painting represents Washington DC where the deep state lingers in darkness.

South Of The Border? Native Born US Workers Lost 1.4 Jobs, Foreign Born Workers Gain 3 Million Jobs

South of the boder, down Mexico way.

Since October 2019, native-born US workers have lost 1.4 million jobs; over the same period foreign-born workers have gained 3 million jobs.

Ay ay ay ay, ay ay ay ay!

The last three monthly jobs reports show aggregate job gains of 340K.  Of that total 172K are accounted for by Health Care and Social Assistance and 60K by Government.  Manufacturing jobs have shrunk by 34K; Professional and Business services, a 16k decline.

Biden/Harris have alliowed the US to be invaded. Under Harris, the new US national anthem will be Jesusita en Chihuahua.

Slowing! Nonfarm Payrolls Up 142k, 2,358 Jobs Added In August (Considerably Below The Average Of 5,254 Jobs Added Since April 2021)

2023 and early 2024 saw numerous months where BLS reported jobs added increasing by 200k or more. but after May 2024, jobs added have been slowing,

In August 2024, US nonfarm payrolls rose by 142K, with job gains in construction and healthcare. The unemployment rate held at 4.2%, and the labor force participation rate remained steady at 62.7%. Average hourly earnings increased by 0.4% to $35.21.

2,358 jobs were added in August. This is considerably below the average jobs added since April 2021 of 5,254 jobs added monthly.

Both previous months were revised sharply lower, so once again expect the August print to suffer the same fate. Specifically, the BLS said that the payroll print for June was revised down by 61,000, from +179,000 to +118,000, and the change for July was revised down by 25,000, from +114,000 to +89,000. With these revisions, employment in June and July combined is 86,000 lower than previously reported It also means that 4 consecutive job prints have been revised lower, and 6 of the past 7.

Weekly hours worked remains below pre-pandemic average; a fraction of an hour per week may not sound like much, but multiply that by over 150 million people and 52 weeks per year, and that’s a significant difference in man-hours worked and aggregate income.

Yes, the US economy is slowing.

ADP Jobs Report: 1.3% YoY Jobs Added As Federal COVID Spending Runs Out of Steam (Grizzly Bear Economy)

We are dancing the Grizzly Bear with jobs reports.

The more truthful ADP report is out and it shows a wimpy 1.3% YoY addition in jobs. So much for a dynamic, growing economy under Biden/Harris. The Covid era Federal spending has run out of steam.

Ahead of tomorrow’s “most important data point in history” payrolls print, this morning we get the ADP employment report and jobless claims (and ISM Services) as an aperitif to tease the day traders and test the reaction functions of the algos.

Against expectations of adding 145k jobs (a slight improvement over July’s 122k), ADP’s Employment report printed a dismal +99k for August – the weakest print since January 2021 (and July’s +122k was revised down to +111k)…

Source: Bloomberg

That is also the fifth straight monthly decline in the ADP employment report’s jobs additions.

The highest-paying jobs segments including Manufacturing and Professional Services saw the largest job declines…

This was the weakest Services job growth since March 2023 as Manufacturing job growth also slowed…

“The job market’s downward drift brought us to slower-than-normal hiring after two years of outsized growth,” said Nela Richardson, chief economist, ADP.

“The next indicator to watch is wage growth, which is stabilizing after a dramatic post-pandemic slowdown.”

Source: Bloomberg

Finally, as a reminder, ADP has underestimated the official BLS data for 10 of the last 12 months…

Source: Bloomberg

So jobs growth weak (great news for the doves) but wage growth has stopped is disinflatinary trend (not a great picture).

Then we had that awful JOLTS report.

Under Biden/Harris inflation, …