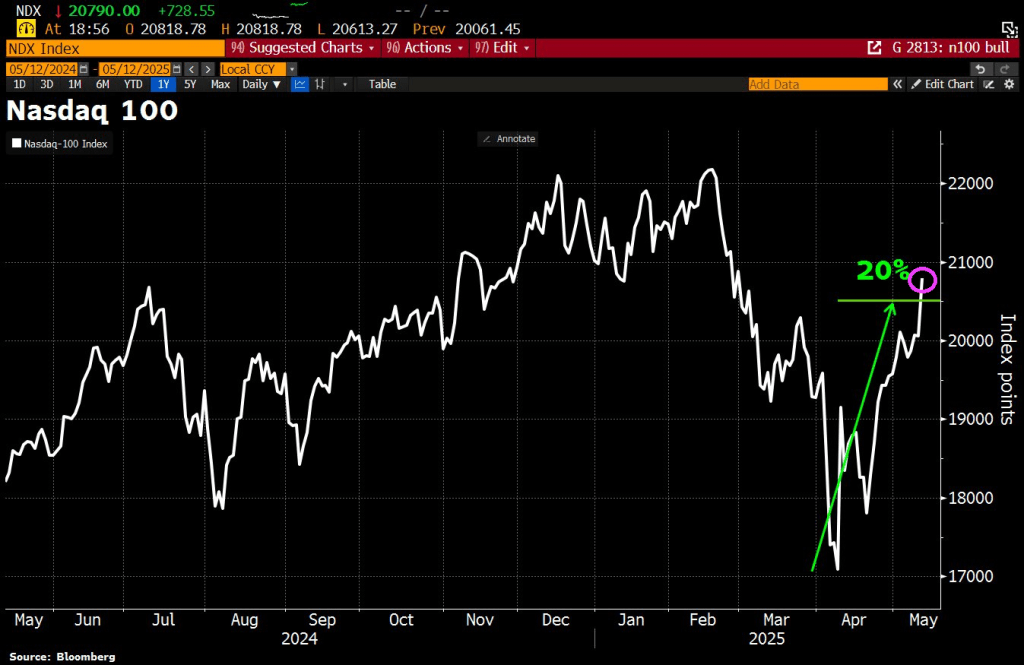
Well, U.S. and China reached an agreement to lower tariffs in a 90-day cool-off period. Despite China claiming they would NEVER agree to tariffs! The result? The NASDAQ 100 rose to its highest level since mid-February.
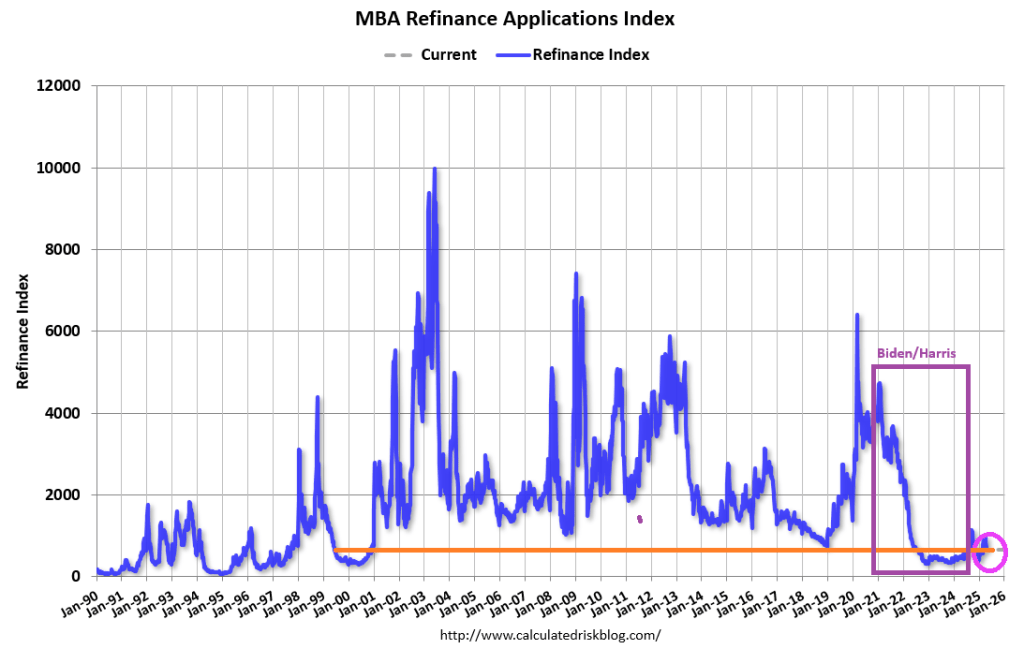
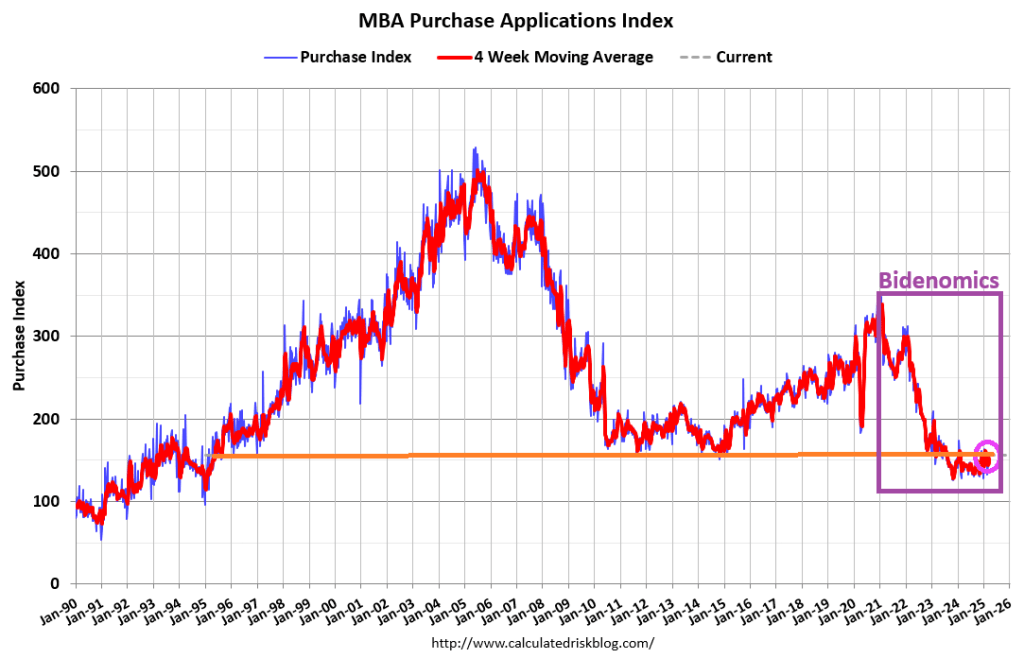
Mortgage applications decreased 4.2 percent from one week earlier, according to data from the Mortgage Bankers Association’s (MBA) Weekly Mortgage Applications Survey for the week ending April 25, 2025.
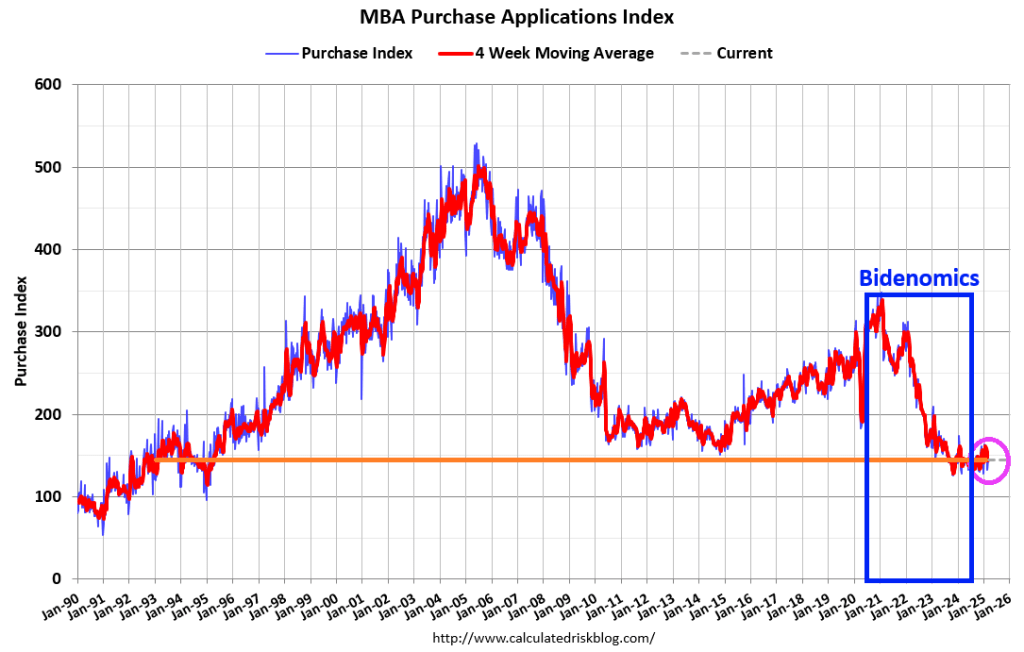
The Market Composite Index, a measure of mortgage loan application volume, decreased 4.2 percent on a seasonally adjusted basis from one week earlier. On an unadjusted basis, the Index decreased 4 percent compared with the previous week. The seasonally adjusted Purchase Index decreased 4 percent from one week earlier. The unadjusted Purchase Index decreased 3 percent compared with the previous week and was 3 percent higher than the same week one year ago.
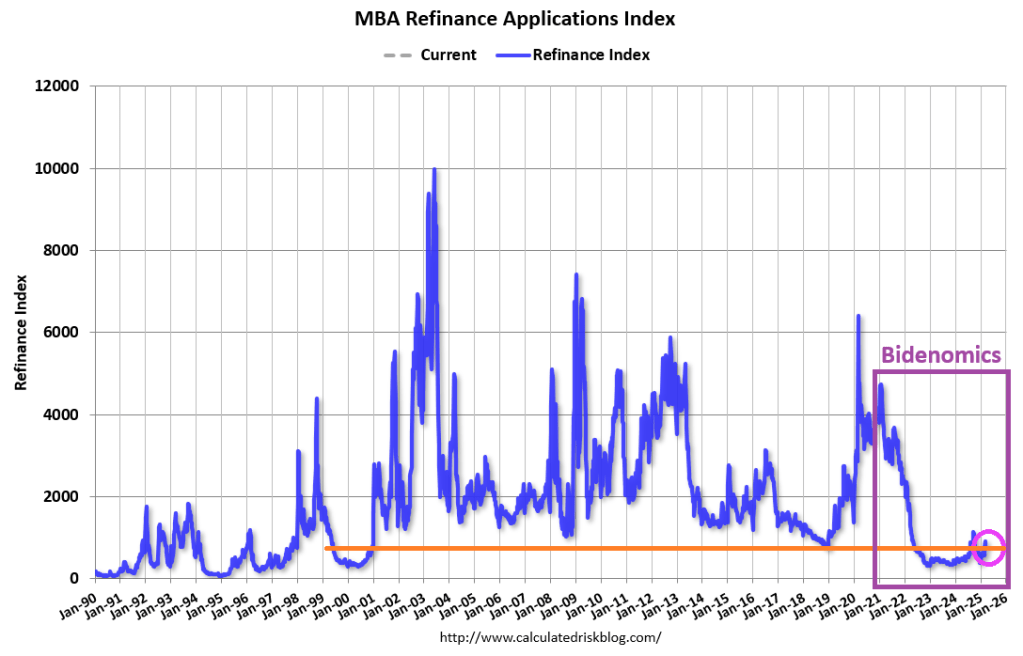
The Refinance Index decreased 4 percent from the previous week and was 42 percent higher than the same week one year ago.
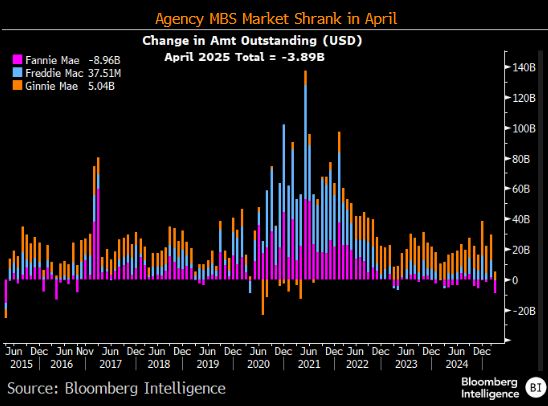
The Agency MBS market shrank in April.
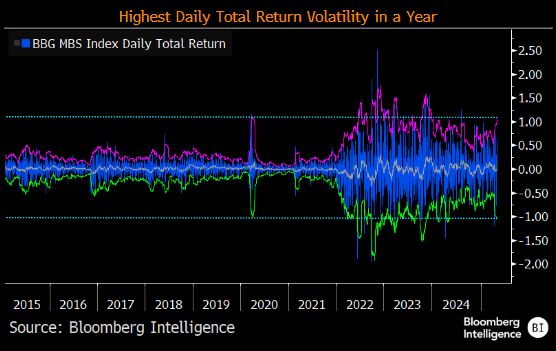
And MBS daily returns have the highest return volatility.
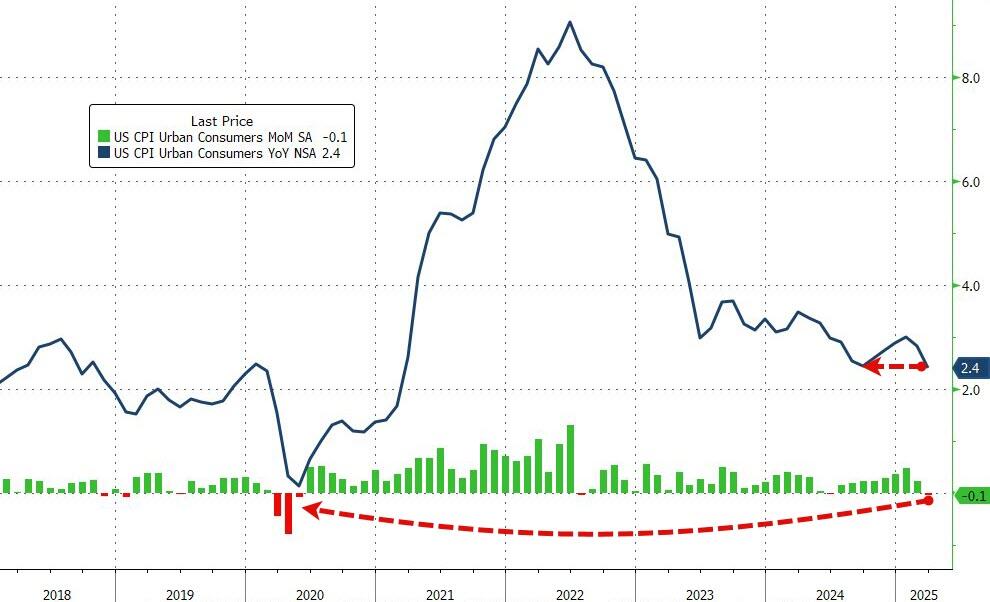
Having dipped lower in the previous month (following a few straight months of re-acceleration), expectations were for both headline and core measures to continue trending lower on a YoY basis… and they were.
Headline CPI FELL 0.1% MoM (vs +0.1% exp), which dragged the YoY CPI to +2.4%, matching the September lows…
Source: Bloomberg
That is the weakest MoM print since May 2020.
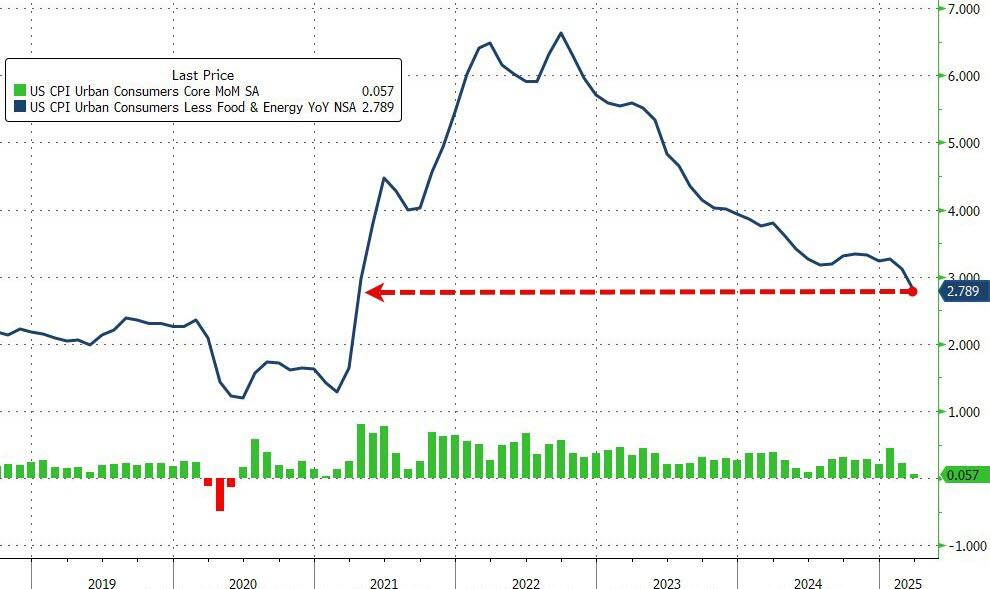
Core CPI also printed cooler than expected (+0.1% MoM vs +0.3% MoM exp), pulling the YoY print down t0 +2.8% YoY – the lowest since March 2021…
Source: Bloomberg
Services inflation tumbled…
Source: Bloomberg
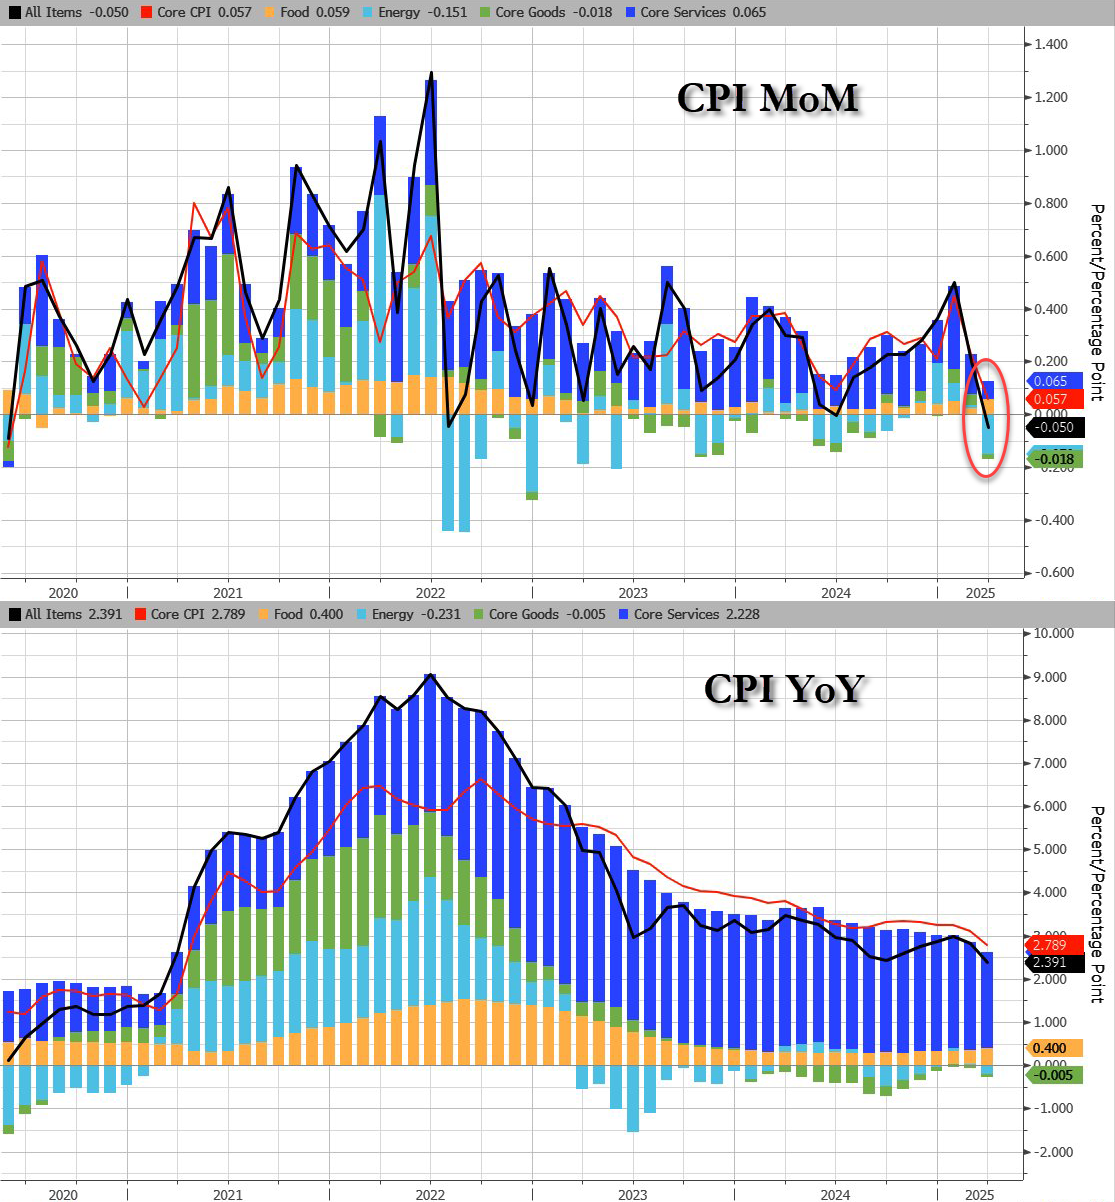
CPI breakdown:
Headline:
CPI decreased 0.1% after rising 0.2% in February, and below the +0.1% estimate. Over the last 12 months, CPI rose 2.4%, below the 2.5% estimate.
Energy CPI fell 2.4% in March, as a 6.3% decline in the index for gasoline more than offset increases in the indexes for electricity and natural gas.
Food CPI rose 0.4% in March as the food at home index increased 0.5% and the food away from home index rose 0.4 percent over the month.
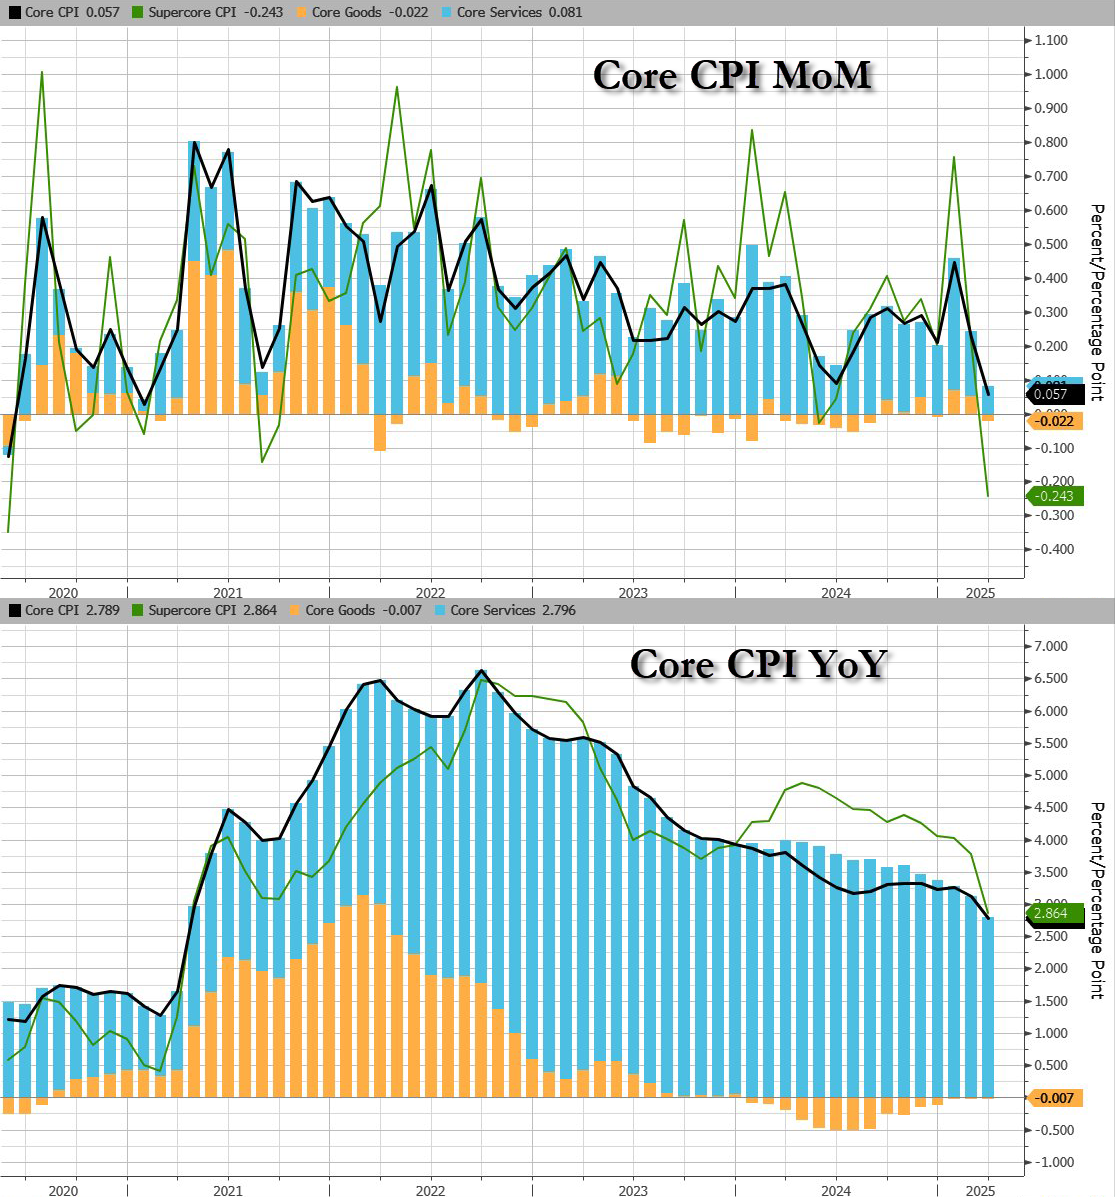
Core CPI:
The index for all items less food and energy rose 0.1% in March, following a 0.2% increase in February.
Indexes that increased over the month include personal care, medical care, education, apparel, and new vehicles.
The indexes for airline fares, motor vehicle insurance, used cars and trucks, and recreation were among the major indexes that decreased in March.
Core CPI details (MoM increase):
The shelter index increased 0.2% over the month.
The index for owners’ equivalent rent rose 0.% in March and the index for rent increased 0.3%.
The lodging away from home index fell 3.5 percent in March.
The personal care index rose 1.0%in March.
The index for education rose 0.4% over the month, as did the index for apparel.
The new vehicles index also increased over the month, rising 0.1%.
The index for airline fares fell 5.3% in March, after declining 4.0% in February.
The indexes for motor vehicle insurance, used cars and trucks, and recreation also fell over the month.
The household furnishings and operations index was unchanged in March.
The medical care index increased 0.2% over the month.
The index for hospital services increased 1.1% in March and the index for physicians’ services rose 0.3% over the month. In contrast, the prescription drugs index fell 2.0% in March.
Core CPI details (YoY increase):
The index for all items less food and energy rose 2.8 percent over the past 12 months.
The shelter index increased 4.0 percent over the last year, the smallest 12-month increase since November 2021.
Other indexes with notable increases over the last year include motor vehicle insurance (+7.5 percent), medical care (+2.6 percent), recreation (+1.9 percent), and education (+3.9 percent).
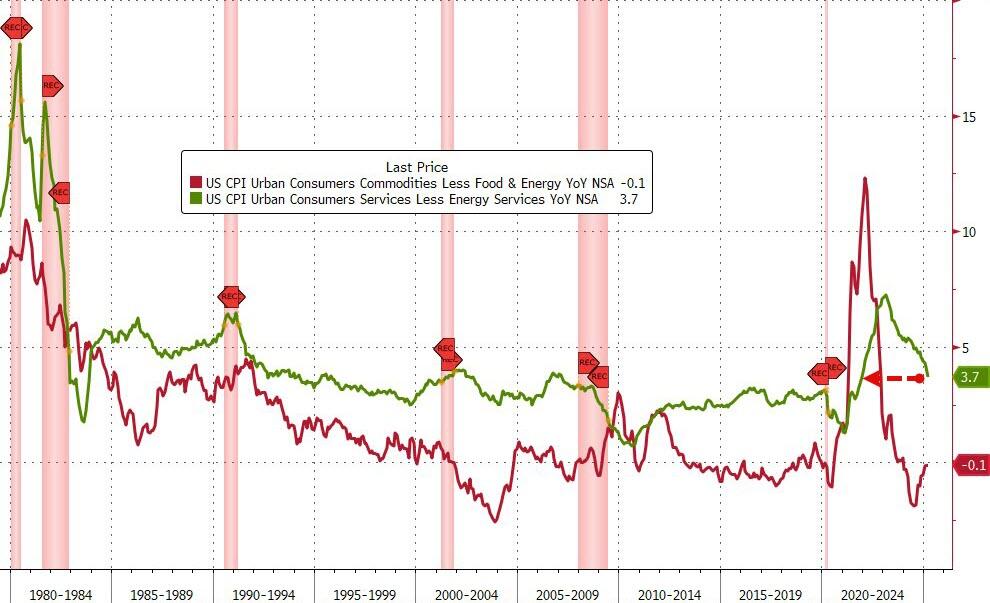
While goods inflation is flat (zero-ish), services cost inflation is fading fast…
Source: Bloomberg
Shelter and Rent inflation is slowing fast:
Shelter inflation +0.3% MoM, +3.99% YoY, down from 4.25% in February (lowest since Nov 2021)
Rent inflation +0.3% MoM, +3.99% YoY, down from 4.09% in February (lowest since Jan 2022)
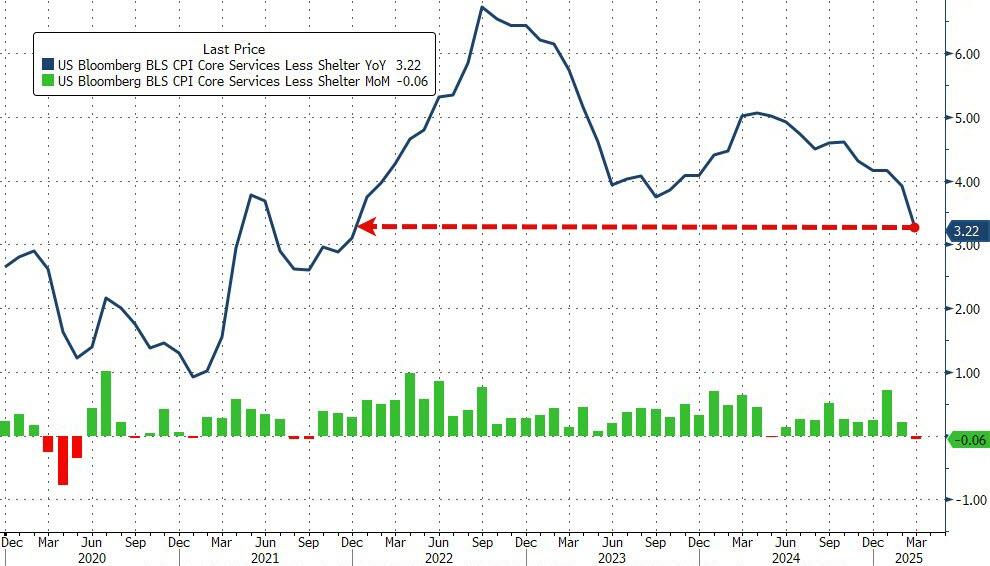
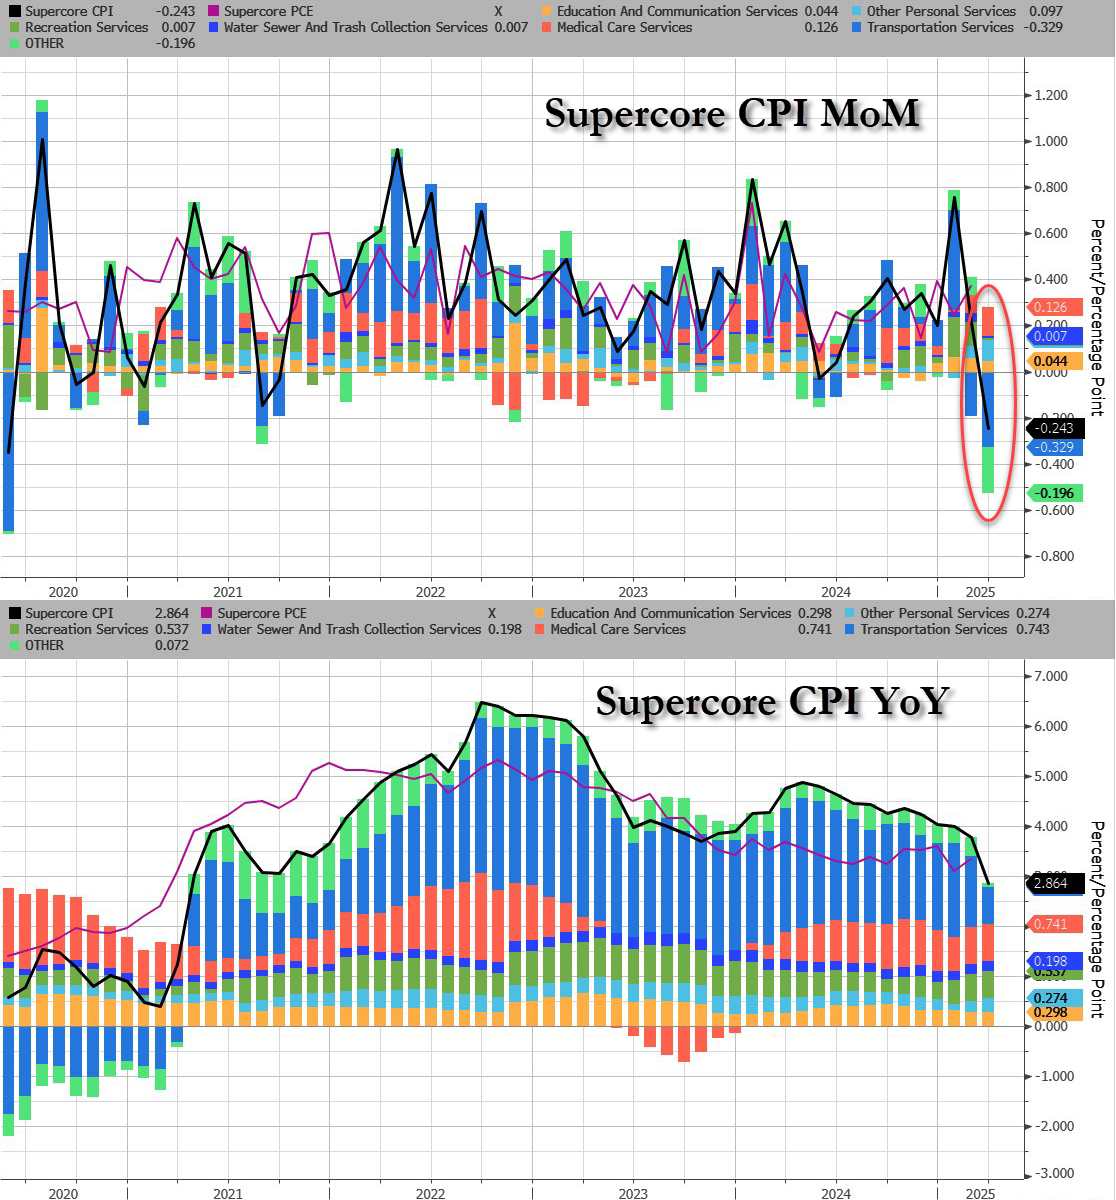
The so-called SuperCore CPI – Services Ex-Shelter – dropped 0.1% MoM dragging it down to +3.22% YoY – the lowest since Dec 2021…
Source: Bloomberg
Source: Bloomberg
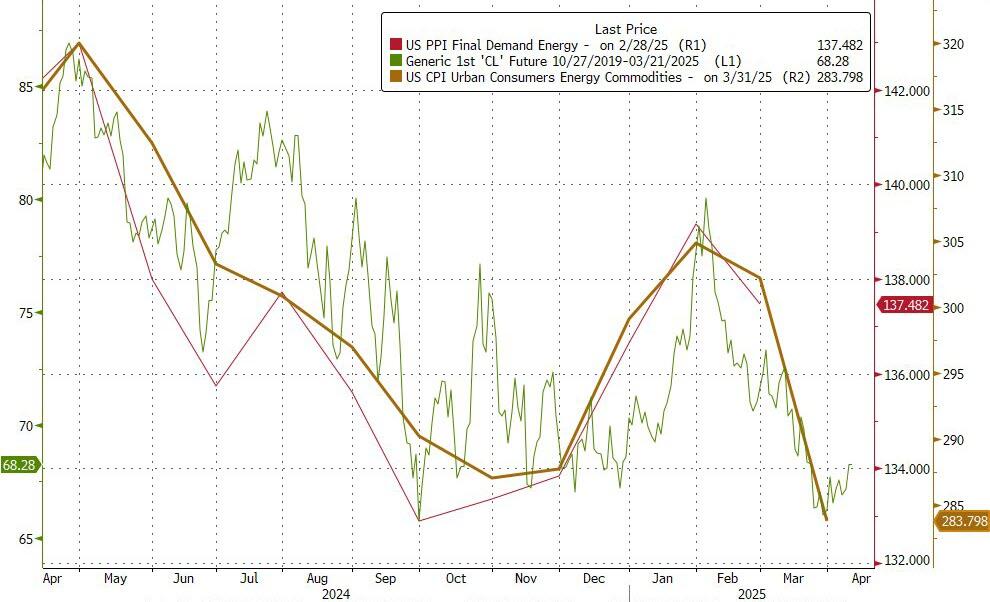
Drill Baby Drill (and tariffs recession fears) have dragged energy prices lower and pulled CPI lower with it…
The mortgage market got its mind set on a recovery, but Biden’s mindless economic policies have jammed up the mortgage market. Example? Mortgage applications are down in a season where they typically increase.
Mortgage applications decreased 1.6 percent from one week earlier, according to data from the Mortgage Bankers Association’s (MBA) Weekly Mortgage Applications Survey for the week ending March 28, 2025.
The Market Composite Index, a measure of mortgage loan application volume, decreased 1.6 percent on a seasonally adjusted basis from one week earlier. On an unadjusted basis, the Index decreased 1 percent compared with the previous week. The seasonally adjusted Purchase Index increased 2 percent from one week earlier. The unadjusted Purchase Index increased 2 percent compared with the previous week and was 9 percent higher than the same week one year ago.
The Refinance Index decreased 6 percent from the previous week and was 57 percent higher than the same week one year ago.
Treasury yields continue to be volatile as economic uncertainty dominates markets. Most mortgage rates finished last week lower, with the 30-year fixed essentially unchanged at 6.70 percent. Last week’s level of purchase applications was its highest since the end of January, driven by a 3 percent increase in conventional purchases, while government purchase applications were down 2 percent.
The average contract interest rate for 30-year fixed-rate mortgages with conforming loan balances ($806,500 or less) decreased to 6.70 percent from 6.71 percent, with points increasing to 0.62 from 0.60 (including the origination fee) for 80 percent loan-to-value ratio (LTV) loans.
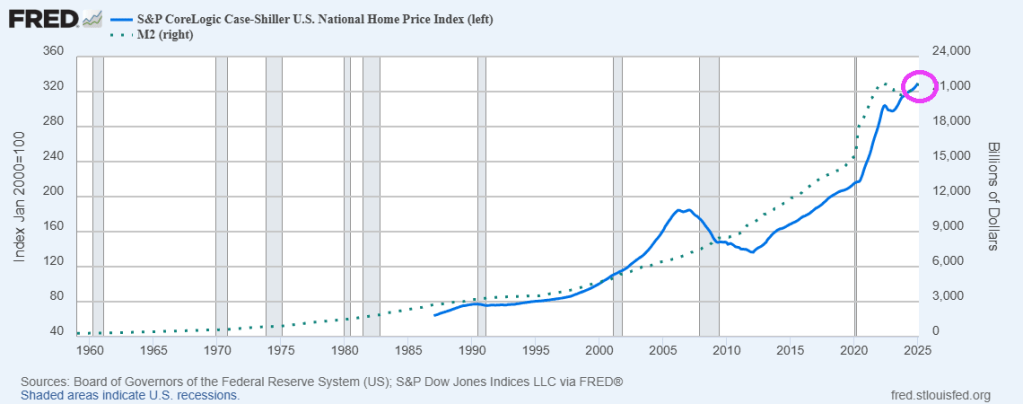
Conforming 30Y mortgage rates are up 137% since Biden was elected President.
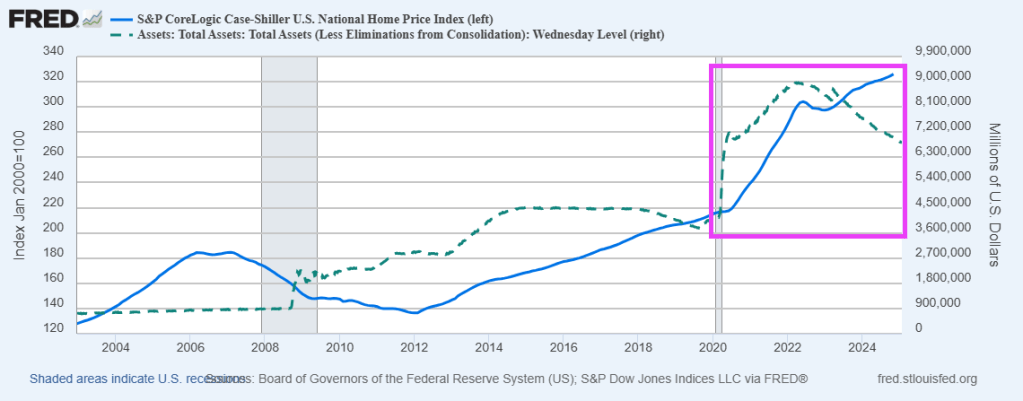
The Fed keeps on printing money M2! The Case-Shiller National home price index is up 4.1% since last year YoY as The Fed continues to print money.
Mortgage applications decreased 2.0 percent from one week earlier, according to data from the Mortgage Bankers Association’s (MBA) Weekly Mortgage Applications Survey for the week ending March 21, 2025.
The Market Composite Index, a measure of mortgage loan application volume, decreased 2.0 percent on a seasonally adjusted basis from one week earlier. On an unadjusted basis, the Index decreased 2 percent compared with the previous week. The seasonally adjusted Purchase Index increased 1 percent from one week earlier. The unadjusted Purchase Index increased 1 percent compared with the previous week and was 7 percent higher than the same week one year ago.
The Refinance Index decreased 5 percent from the previous week and was 63 percent higher than the same week one year ago.
Mortgage applications increased 20.4 percent from one week earlier, according to data from the Mortgage Bankers Association’s (MBA) Weekly Mortgage Applications Survey for the week ending February 28, 2025.
The Market Composite Index, a measure of mortgage loan application volume, increased 20.4 percent on a seasonally adjusted basis from one week earlier. On an unadjusted basis, the Index increased 22 percent compared with the previous week. The seasonally adjusted Purchase Index increased 9 percent from one week earlier. The unadjusted Purchase Index increased 12 percent compared with the previous week and was 2 percent higher than the same week one year ago.
The Refinance Index increased 37 percent from the previous week and was 83 percent higher than the same week one year ago.
Thank God the adults are in charge in DC instead of the children we saw at Trump’s speech last night.
I call this the house latitudes. Horse latitudes is a belt of calm air and sea occurring in both the northern and southern hemispheres between the trade winds and the westerlies. And when the ships motion stalled, the crews would jetison their cargo of horses to the delight of sharks! So, we are in state of HOUSE latitudes where the wind pushing mortgage refis and purchase apps. So we are all riders on the storm.
Mortgage applications decreased 6.6 percent from one week earlier, according to data from the Mortgage Bankers Association’s (MBA) Weekly Mortgage Applications Survey for the week ending February 14, 2025.
The Market Composite Index, a measure of mortgage loan application volume, decreased 6.6 percent on a seasonally adjusted basis from one week earlier. On an unadjusted basis, the Index decreased 4 percent compared with the previous week. The seasonally adjusted Purchase Index decreased 6 percent from one week earlier. The unadjusted Purchase Index decreased 1 percent compared with the previous week and was 7 percent higher than the same week one year ago.
The Refinance Index decreased 7 percent from the previous week and was 39 percent higher than the same week one year ago.
Privately-owned housing starts in January were at a seasonally adjusted annual rate of 1,366,000. This is 9.8 percent below the revised December estimate of 1,515,000 and is 0.7 percent below the January 2024 rate of 1,376,000. Single-family housing starts in January were at a rate of 993,000; this is 8.4 percent below the revised December figure of 1,084,000. The January rate for units in buildings with five units or more was 355,000.
Biden is out and so are the crazy job preferences of his administration (e.g., green energy). There is a new sheriff in town (Donald Trump).
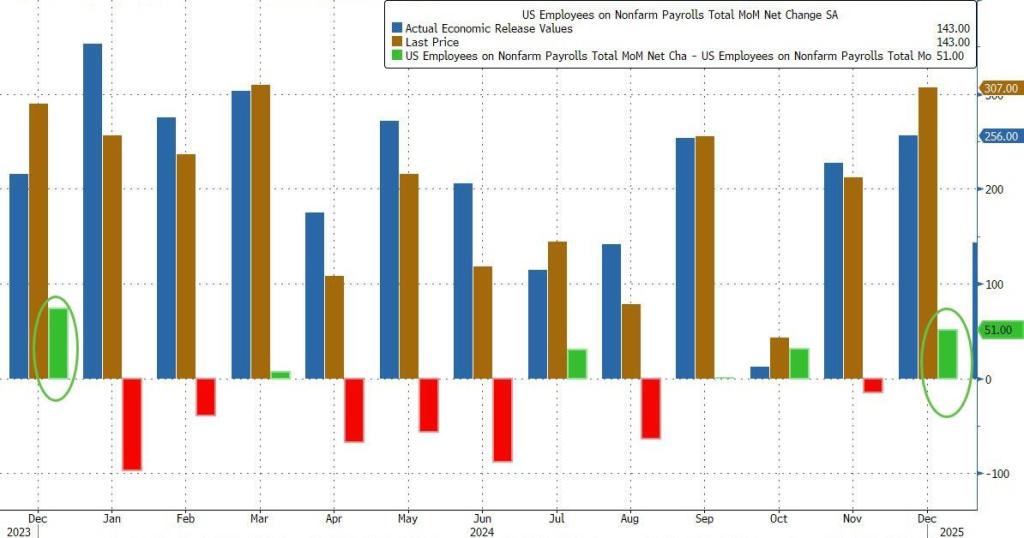
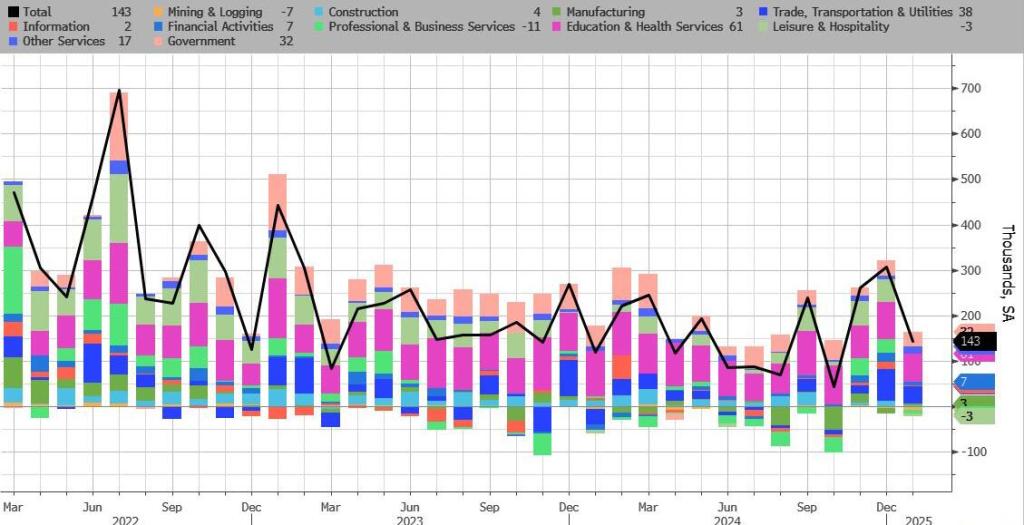
Here’s what the BLS reported in Trump’s first official jobs report since he returned to the White House: total payrolls printed at 143K.
down sharply from an upward revised 307K (256K originally) and missing estimates of 175K.
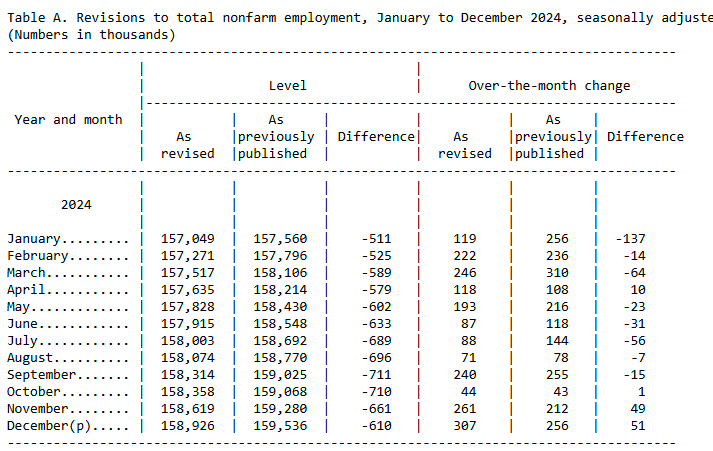
Looking further back, the change in total nonfarm payroll employment for November was revised up by 49,000, from +212,000 to +261,000, and when adding the +51,000 revision to December employment in November and December combined is 100,000 higher than previously reported
But while the sequential change in the Establishment survey was notable, what was far more remarkable was the Household survey where we saw massive population related revisions (discussed last night), which pushed the civilian labor force higher by 2.2 million to 170.744 million, while the number of employed workers also increased by over 2.2 million to 163.895 million. As a result, the Household survey has finally caught up to Establishment survey.
One reason that US home prices remain high (and unaffordable for many) is The Federal Reserve (aka, The Green Slime). Former Fed Chair (and Biden’s Treasury Secretary is no Luciana Paluzzi, the Italian beauty from the James Bond film Thunderball. Yellen is just a far-left economic hack.
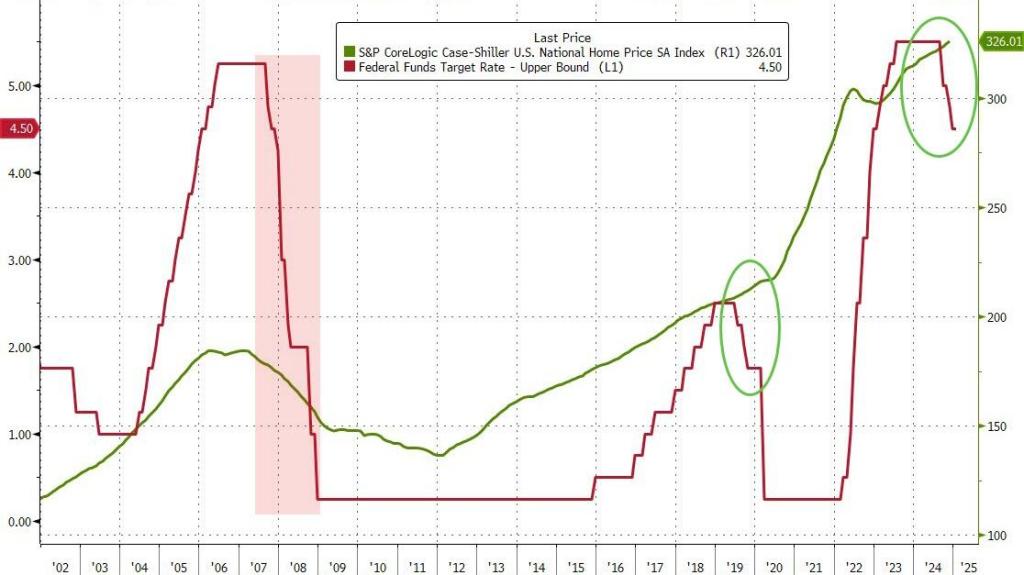
Look at the Case-Shiller national home price index compared with The Fed funds target rate.
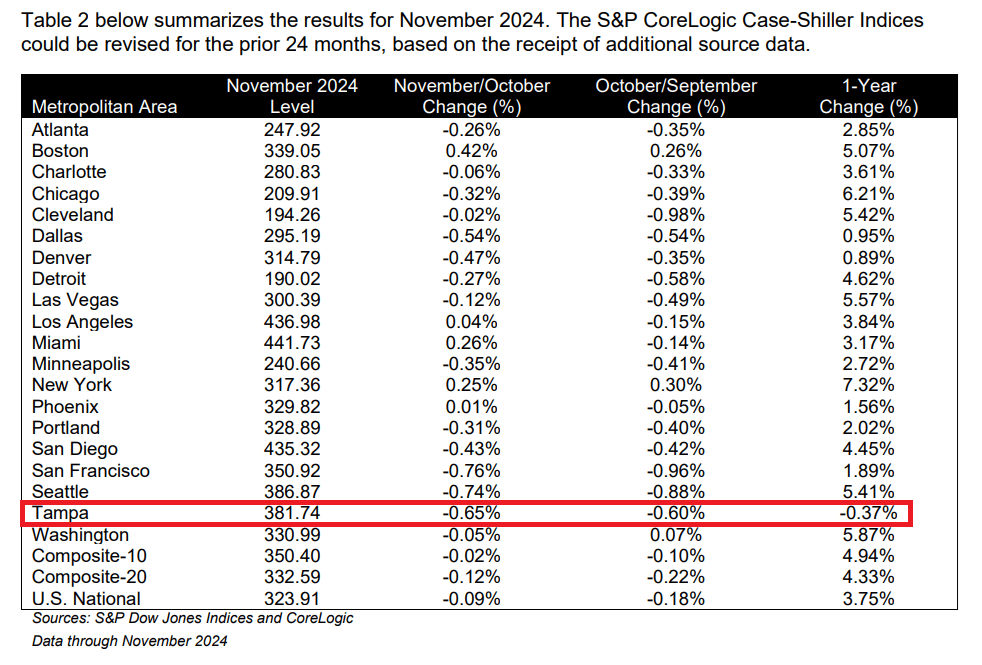
The S&P CoreLogic Case-Shiller U.S. National Home Price NSA Index, covering all nine U.S. census divisions, reported a 3.8% annual return for November, up from a 3.6% annual gain in the previous month. The 10-City Composite saw an annual increase of 4.9%, recording the same annual increase in the previous month. The 20-City Composite posted a year-over-year increase of 4.3%, up from a 4.2% increase in the previous month. New York again reported the highest annual gain among the 20 cities with a 7.3% increase in November, followed by Chicago and Washington with annual increases of 6.2% and 5.9%, respectively. Tampa posted the lowest return, falling 0.4%.
The pre-seasonally adjusted U.S. National, 20-City, and 10-City Composite Indices’ upward trends continued to reverse in November, with a -0.1% drop for the national index, while the 20-City Composite saw a -0.1% decline and the 10-City Composite was unchanged.
While the Fed Funds target rate gyrates, The Fed’s balance sheet remains high.


You must be logged in to post a comment.