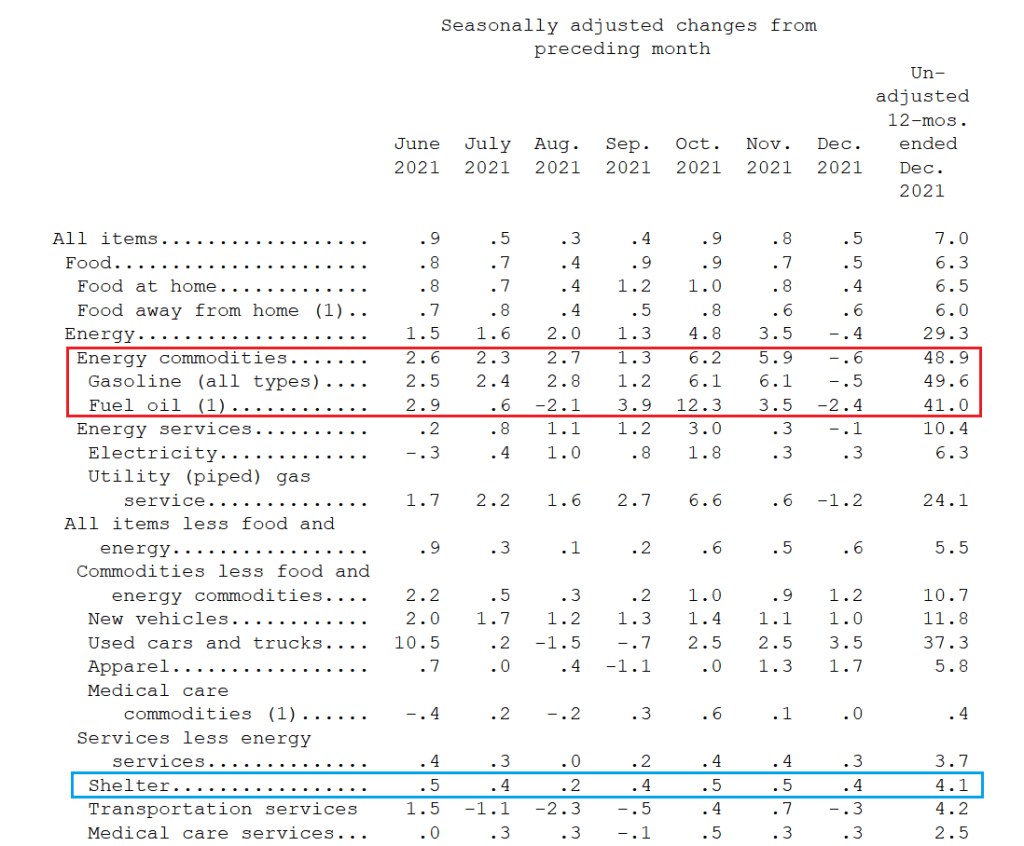
Ever wonder why prices are rising so fast? One reason is that with rapidly rising energy prices under the Biden Administration, the costs are getting passed-through to consumers in the form of higher prices.
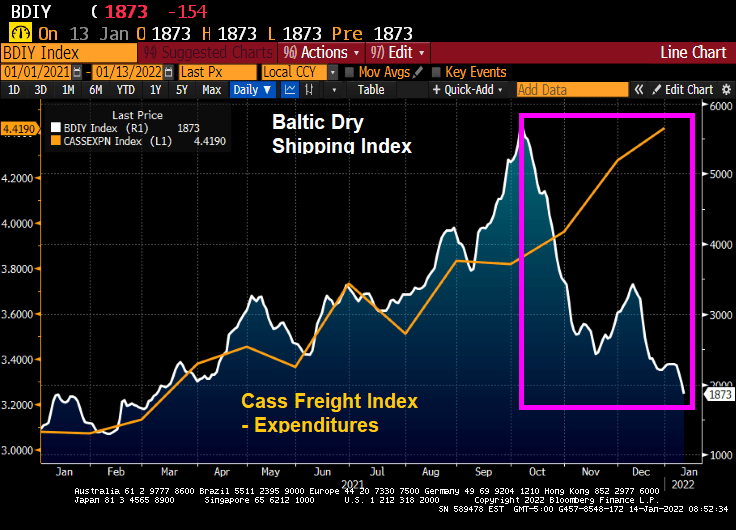
According to the Cass Corp Freight Index, the total spent in December on shipping goods to their customers in the US spiked by 43.6% from December 2020 to December 2021. Not surprising since energy prices over the past year have soared by almost 50%.
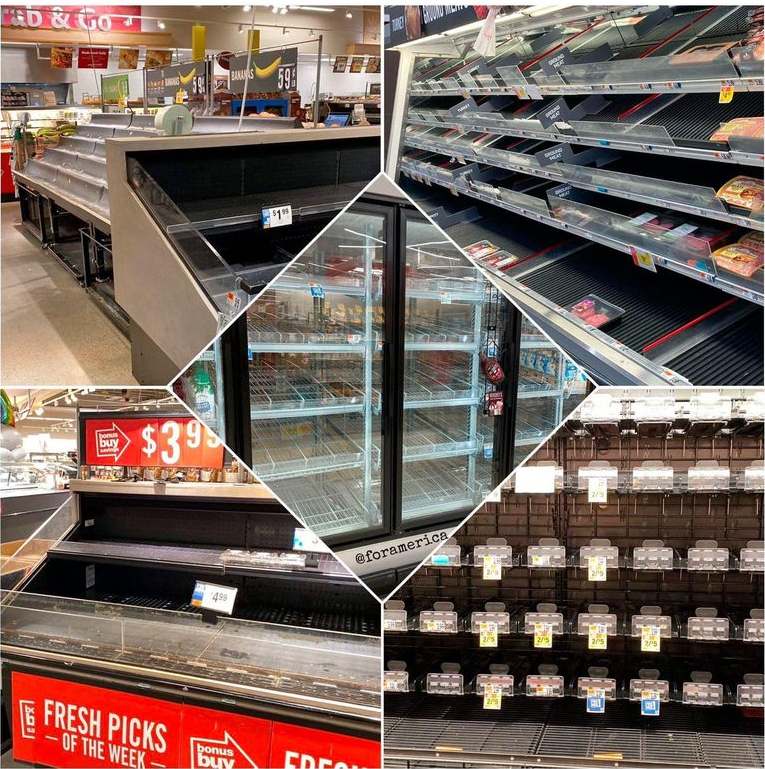
But at the same time, the Baltic Dry index (The Baltic Dry Index (BDI) is a shipping and trade index created by the London-based Baltic Exchange. It measures changes in the cost of transporting various raw materials, such as coal and steel) is crashing thanks to FEAR created by Omicron.
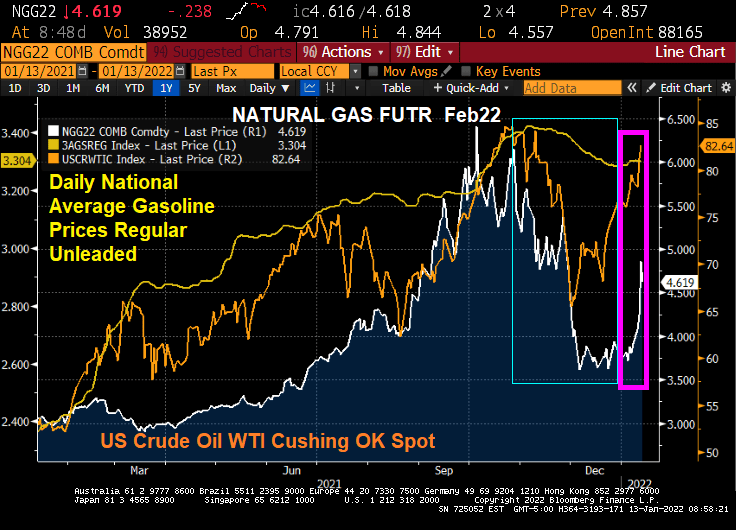
And yes, energy prices are surging again in 2022 after cooling off in Q4 2021.
Mortgage rates in the U.S. rose for a third straight week, reaching the highest point in almost two years.
The average for a 30-year loan was 3.45%, up from 3.22% last week and the highest since March 2020, Freddie Mac said in a statement Thursday.
Rates tracked a jump in yields for 10-year Treasuries, which climbed to levels not seen since early 2020, before the pandemic roiled financial markets. Signs point to borrowing costs rising further as the job market improves and the Federal Reserve steps up its efforts to tame inflation.
That would increase the burden on homebuyers who are already stretching to afford a purchase. Rates for 30-year mortgages tumbled to a record low of 2.65% a little more than a year ago.
Cheap loans have helped fuel a housing rally that’s still running hot even as home prices soar out of reach for many Americans.
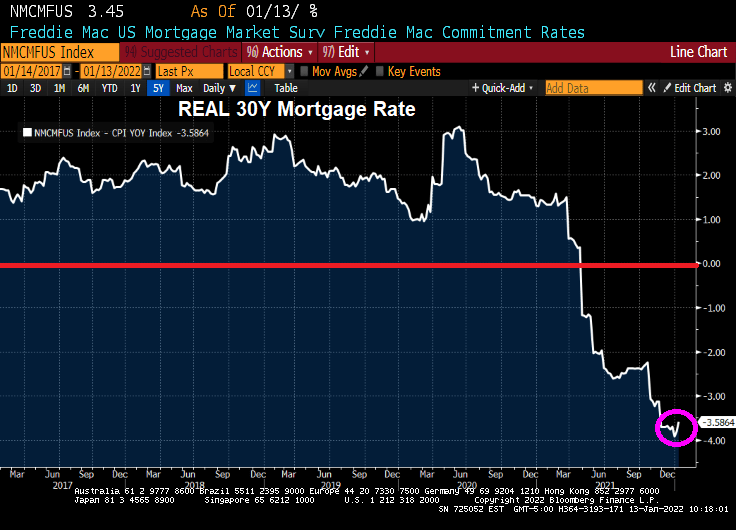
But wait! The REAL 30-year mortgage rate (nominal 30-year rate – CPI YoY) is -3.59%.
Lael Brainard, Biden’s nominee to be Vice Chairman of The Federal Reserve, has been one of the “inflation is transitory” crowd. US Senator Toomey is questioning Brainard in today’s hearing. From Toomey’s opening statement:
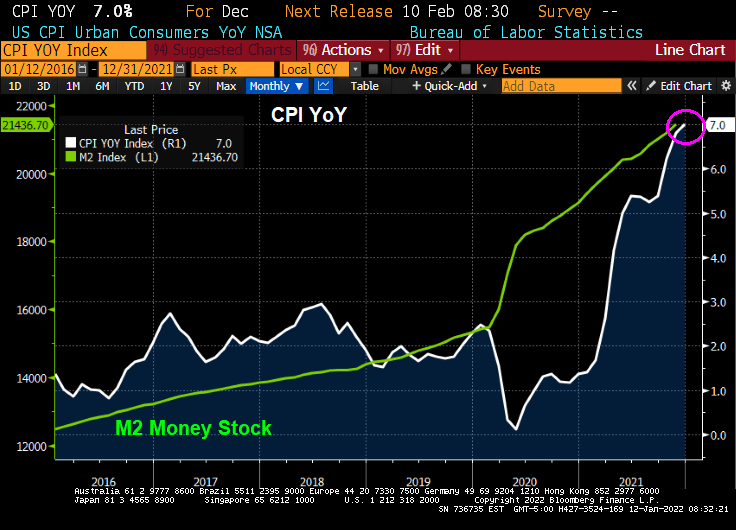
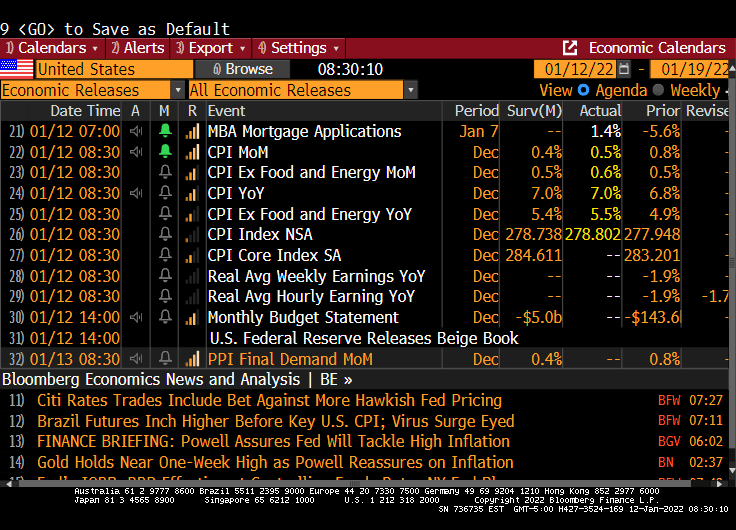
Last year, Governor Brainard repeatedly insisted that inflation was transitory. We have now had nine consecutive months where inflation has been more than two times the Fed’s 2% target. That makes it pretty clear that inflation is not transitory. Yesterday’s CPI release of 7.0%—the highest in 40 years—confirms that.
Inflation is a tax that is eroding Americans’ paychecks every day. Even though wages are growing, inflation is growing faster and causing workers to fall further and further behind.
At least the REAL mortgage rate is negative!
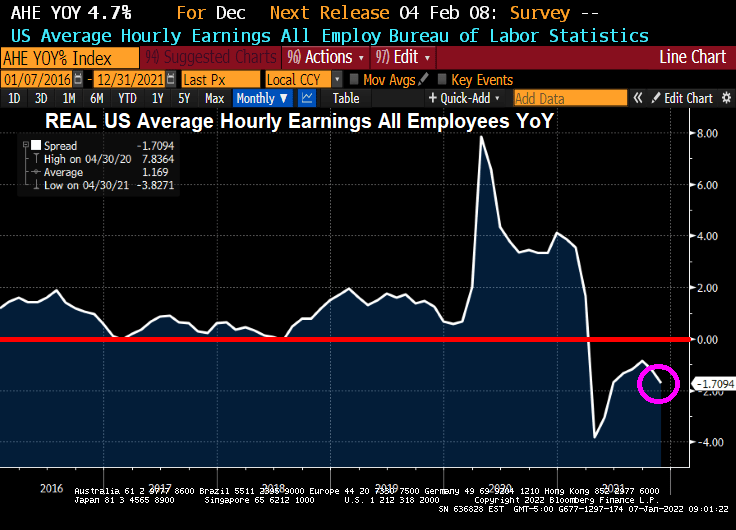
I hope Senator Toomey shows Brainard this chart of “transitory” negative wage growth.
Negative wage growth and negative REAL mortgage rates. What a total mess!
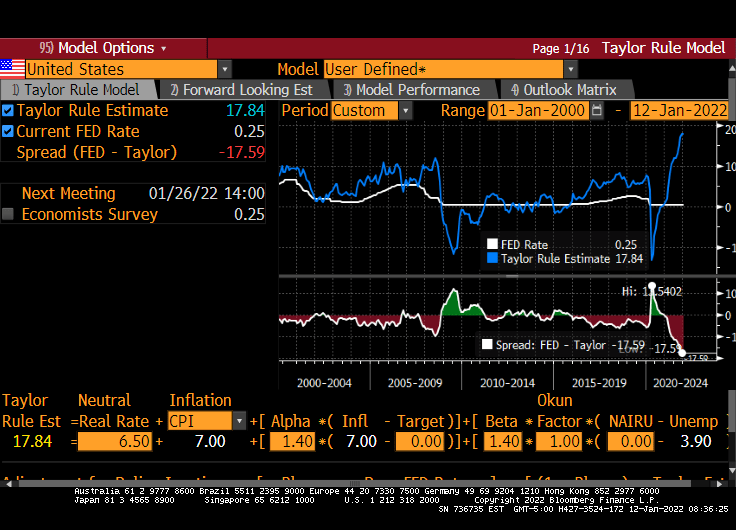
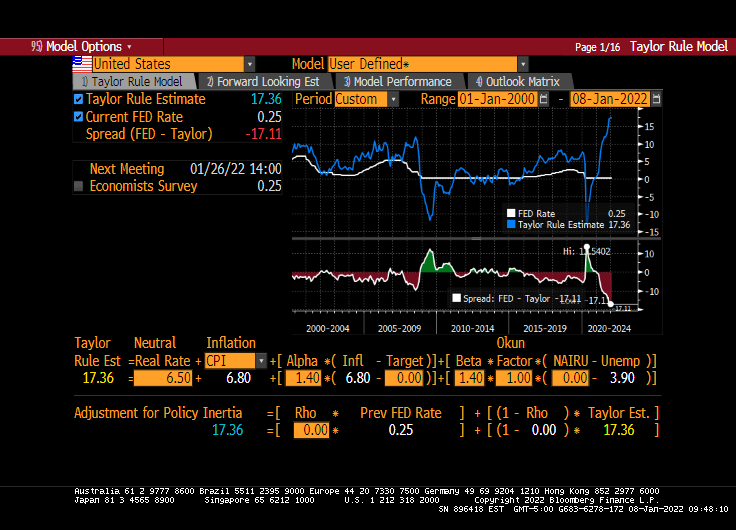
It is somewhat mystifying that markets would be soooooo sensitive to 3 rate increases from The Fed, particularly since the Taylor Rule suggests that The Fed’s target rate should be 17.36%. Even if you don’t like the Taylor Rule or disagree with its inputs, you must admit that the gap between where The Fed is (0.25%) and where they should be (17.36%) is … k-razy.
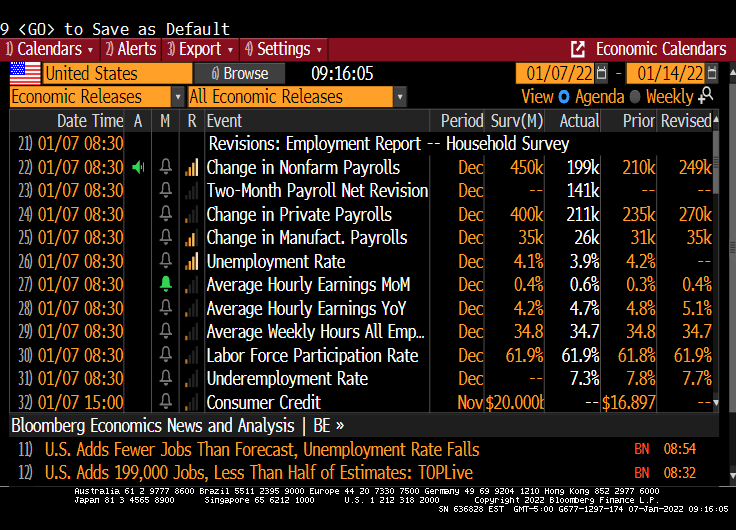
The November jobs report is out and the highlight is that US Average Hourly Earnings GREW at a rate of 4.7% YoY. Unfortunately, inflation is still raging resulting in REAL US Average Hourly Earnings DECLINING at a rate of -1.71% YoY.
REAL US home price growth is slowing and is at 12.856% YoY as REAL average hourly earnings slowed to -1.7094% YoY.
The lowlight of the November jobs report is that only 199K jobs were added versus the 450K jobs expected to be added. At least the unemployment rate fell to 3.9%.
WHERE we the jobs added? Leisure and hospitality led the way! Hey bartender.
Yes, REAL wage growth and REAL home price growth are slowing.
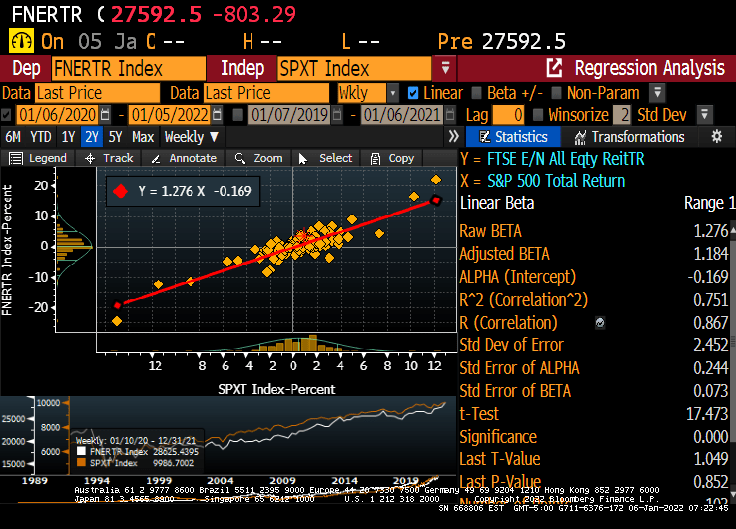
How about real estate investment trusts? The NAREIT all-equity index rose by 35.6% YoY while inflation rose at 6.8%. The S&P 500 index rose 28.9% YoY.
Of course, the NAREIT all-equity index has a beta of 1.276.
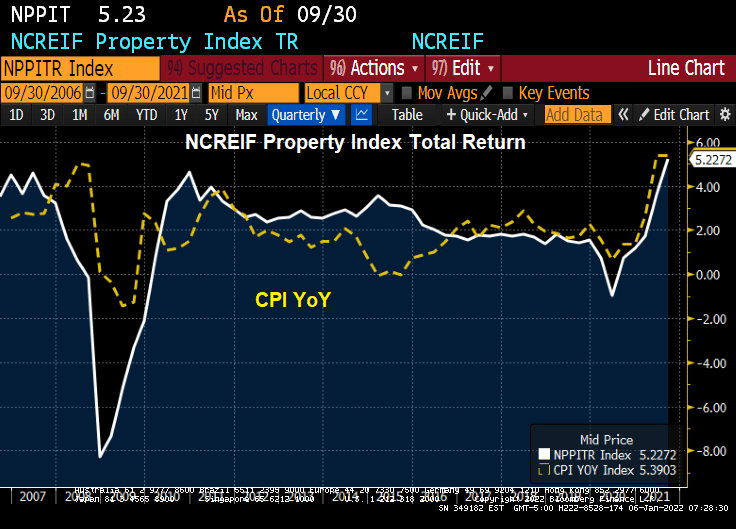
How about the NCREIF All-property commercial real estate index? For Q3, the NCREIF property index rose by 5.22%, less than the most recent inflation reading of 6.8%.
So for the past year, housing has beaten the pants-off inflation, REITs have earned a higher return than inflation, and the NCREIF index seems to be rising slower than inflation (but with its lag problems, I anxiously await the Q4 numbers which should be higher.
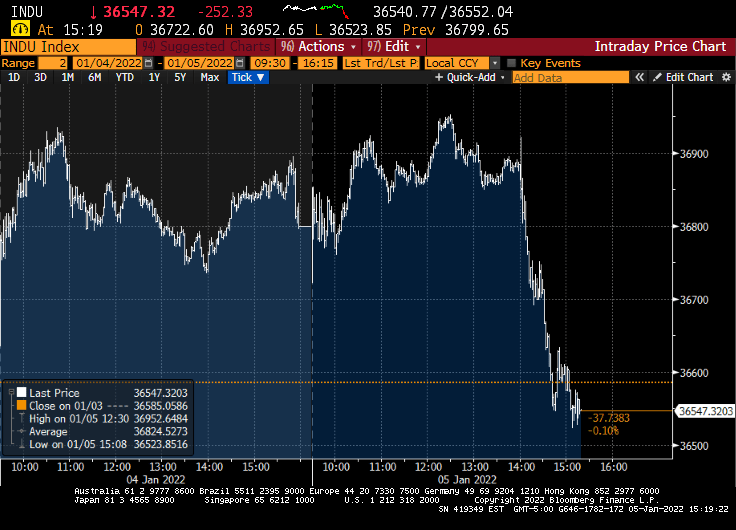
“Some participants also noted that it could be appropriate to begin to reduce the size of the Federal Reserve’s balance sheet relatively soon after beginning to raise the federal funds rate,” the minutes said.
The S&P 500 stock index extended declines following the release and was on track for its biggest loss in more than a month. Treasuries also extended losses and the dollar pared its decline.
At the conclusion of the December meeting, the FOMC announced it would wind down the Fed’s bond-buying program at a faster pace than first outlined at the previous meeting in early November, citing rising risks from inflation. The new schedule puts the central bank on track to conclude purchases in March.
And with the minutes released, the Down dumped.
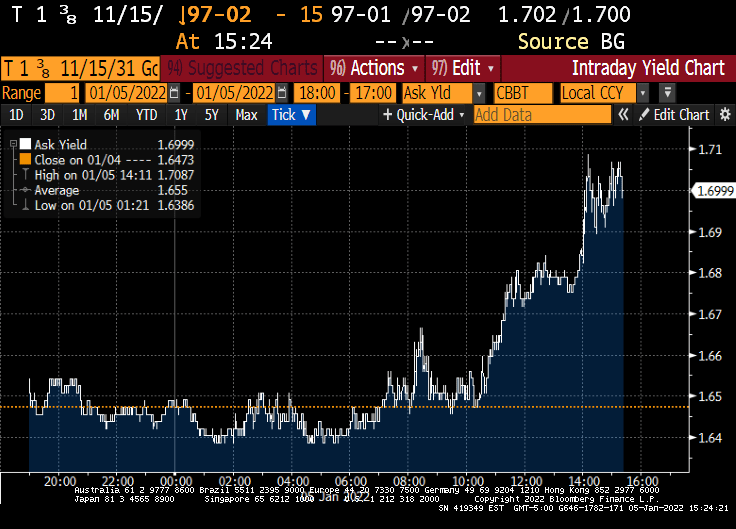
And the 10-year Treasury yield jumped 5.3 bps on the release.
The inventory of existing homes for sale in the US is extremely low. The lack of available inventory to buy is helping drive home prices through the roof.
Available inventory for purchase peaked back in the 2007-2008 period during the dreaded housing bubble in the US. But inventory for sale has declined ever since. Why?
I think it has something to do with the aging of the US population. Look at this chart of Existing Home Sales Inventory against the growth 65+ years old.
Perhaps households 65+ are resisting moving to states like Florida and Arizona as they had in the past, leaving them stationary in their dwelling.
Another reason for the bewildering lack of inventory is the growth of the HECM (Home Equity Conversion Mortgage) that allows elderly households to drain the equity in their home rather than have to sell to utilize it. But HECMs have not taken-off sufficiently to explain the mystery of the missing inventory.
So we know that housing inventory is very low and we know that the number of Americans 65 and over is increasing. But we do not know the reason for the decline in inventory.
Treasury yields rose a second day, with five-year rates hitting the highest since before the pandemic took hold in the U.S., amid increasing conviction that the Federal Reserve will raise rates at least three times beginning in May.
The five-year Treasury note’s yield climbed as much as 3.8 basis points to 1.392%, the highest since Feb. 20, 2020, while 30-year yields bumped up toward their 200-day moving average.
Yields across the curve are rising for a second straight day, after Monday’s selloff lifted the 10-year note’s yield by nearly 12 basis points in its worst start to a year since 2009. The two-year yield topped 0.80% for the first time since March 2020.
At the 10-year mark, we see Canada’s sovereign notes rising 18.7 basis points.
Also at the 10 year mark, we see the US 1-year breakeven inflation rate (red line) surging.
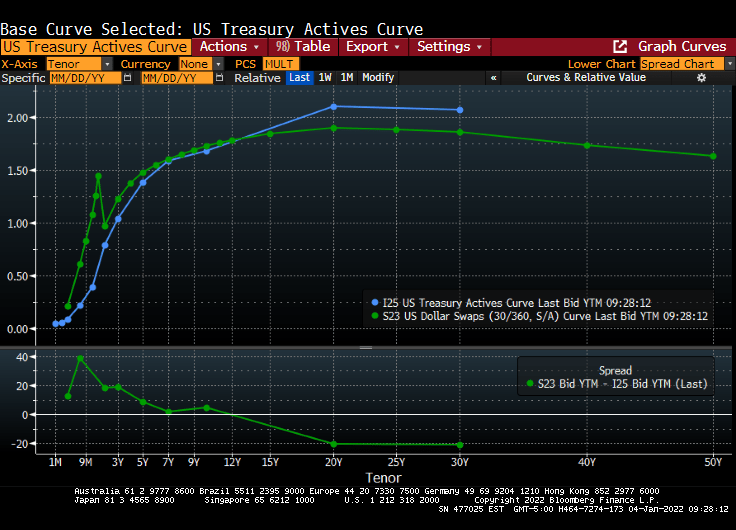
The US Treasury actives curve and Dollar Swaps curve remain steeply upward sloping.
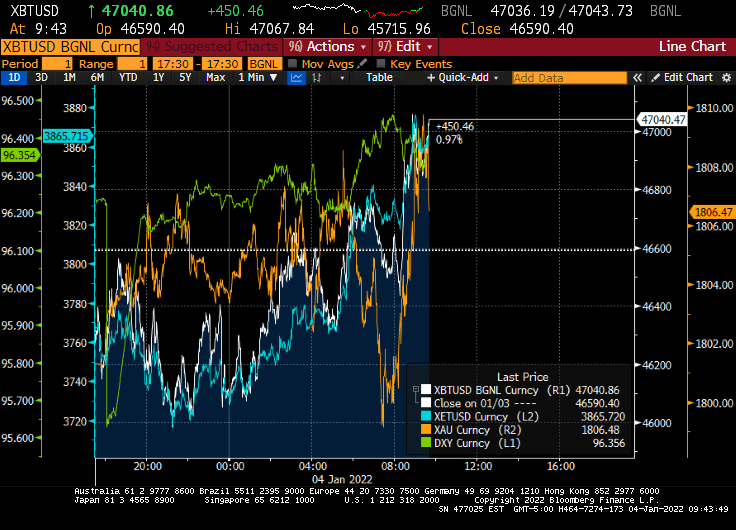
And on the crypto and gold front, gold surged this morning after tanking in the evening, while Ethereum (blue) is doing quite well along with Bitcoin.
My favorite non-bond, non-alt investment chart. The S&P 500 index charted against The Fed’s M2 Money Stock.
Following my friend Jesse’s habit of posting great French food dishes, here is one from my favorite Parisian eatery, Le Duc de Richelieu. Mmmmmmm.


You must be logged in to post a comment.