Longer-term inflation jumped to their highest since June 2008, according to the latest UMich Sentiment survey, while short-term inflation expectations dropped to four year lows…
Housing sentiment (buying conditions for housing) remains depressed under Biden/Harris “Reign of (economic) error.”
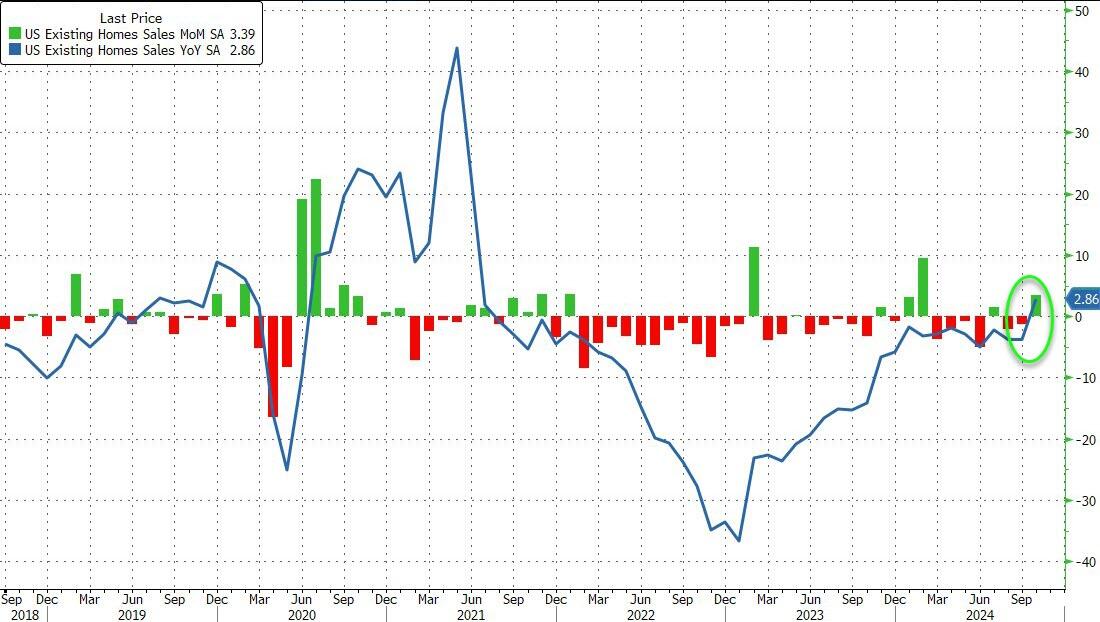
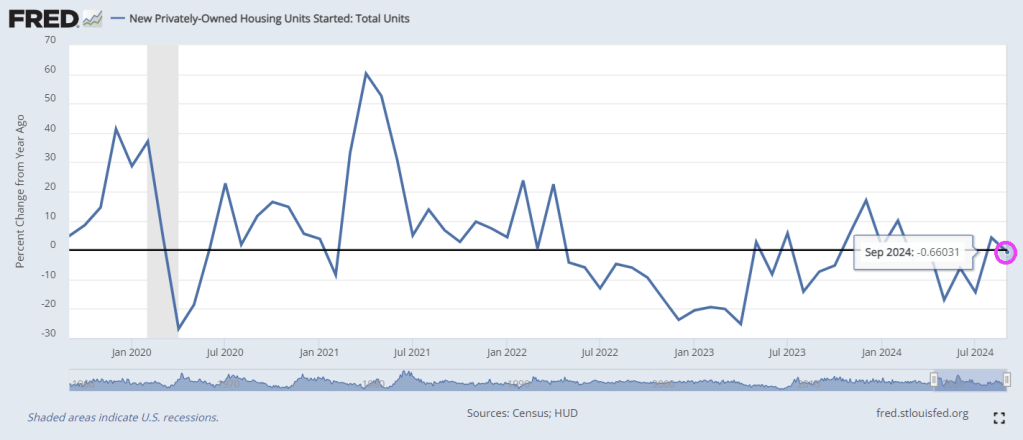
Here is a picture depicting the assassination of the US housing market.
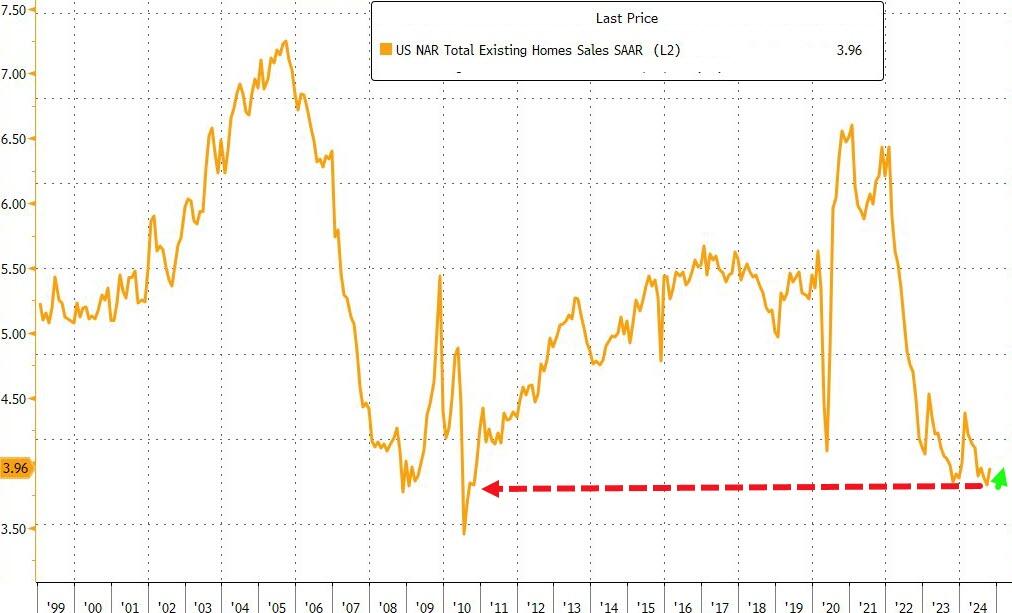
…but in context, that shift up to 3.96mm SAAR homes sold is nothing…
Source: Bloomberg
High borrowing costs have led to a shortage of previously owned homes on the market, discouraging many would-be home sellers from listing their properties for sale and having to part with their current low financing costs.
“Additional job gains and continued economic growth appear assured, resulting in growing housing demand,” NAR Chief Economist Lawrence Yun said in a prepared statement.
“While mortgage rates remain elevated, they are expected to stabilize.”
Last month, the inventory of available homes edged up 0.7% to 1.37 million, continuing to trend higher although well below pre-pandemic levels.
Despite the weakness in sales, tight inventory is keeping prices elevated, yielding one of the least affordable housing markets on record. The median sale price last month increased 4% from a year earlier to $407,200, the highest ever for any October, the NAR figures show.
Contract signings rose in all four US regions, led by a 6.7% jump in the Midwest.
Sales of single-family homes increased 3.5% in October; purchases of condominiums and co-ops were up 2.7%
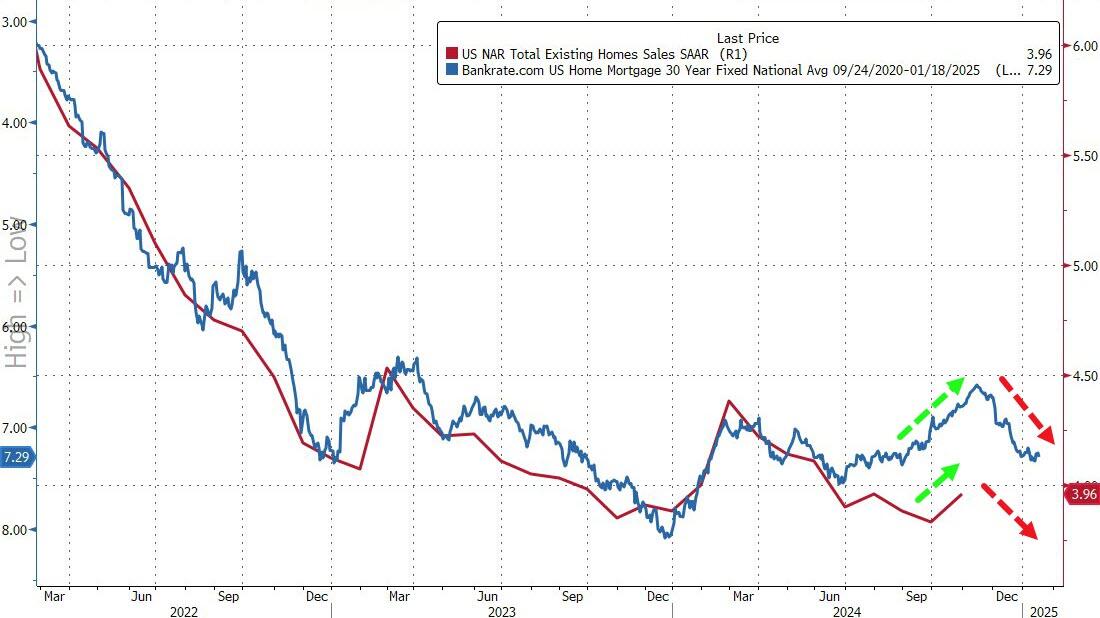
Finally, while that’s all very exciting – a scintilla of growth off almost record lows – the fecal matter is about to strike the rotating object as rising mortgage rates lagged impact threatens…
Source: Bloomberg
In October, 59% of homes sold were on the market for less than a month, compared with 57% in September, and 19% sold above the list price. Properties remained on the market for 29 days on average, compared with 28 days in the previous month. First-time buyers made up 27% of purchases, still historically low.
There is one way out of the inflation trap. And it’s drill, baby, drill!
For the 53rd straight month, core consumer prices rose on a MoM basis in October with the YoY pace re-accelerating to +3.33%.
The shelter index increased 4.9 percent over the last year, accounting for over 65 percent of the total 12-month increase in the all items less food and energy index.
Thank goodness Harris can’t try to impliment her ridiculous plans to boost housing!
Glad to see Vivek Ramaswamy and Elon Musk (the NEW Two Bobs from Office Space) cleaning up the mess in Washington DC.
The US Treasury yield curve (10Y-2Y CMT) went negative on April 1, 2024. And remains positive.
The US Treasury 10Y-2Y CMT (constant maturity Treasury) peaked locally on March 29, 2024 and then fell, eventually turning negative on April 1, 2024. And remained negative until August 30, 2024 just prior to the election. It looks like the yield curve accurately predicted the election of Trump.
The 10-year Treasury yield is rising with a positive economic outlook under Trump. And with that optimism we see mortgage rates rising too.
The office sector of commercial real estate has been in a depression for about two years, with prices of older office towers plunging by 50%, 60%, or 70% from their last transaction, and sometimes even more, with some office towers selling for land value, with the building by itself being worth next to nothing even in Manhattan.
Landlords of office buildings are having trouble collecting enough in rent to even pay the interest on their loans, and they’re having trouble or are finding it impossible to refinance a maturing loan, and so many of them have stopped making interest payments on their mortgages, and delinquencies continue to spike.
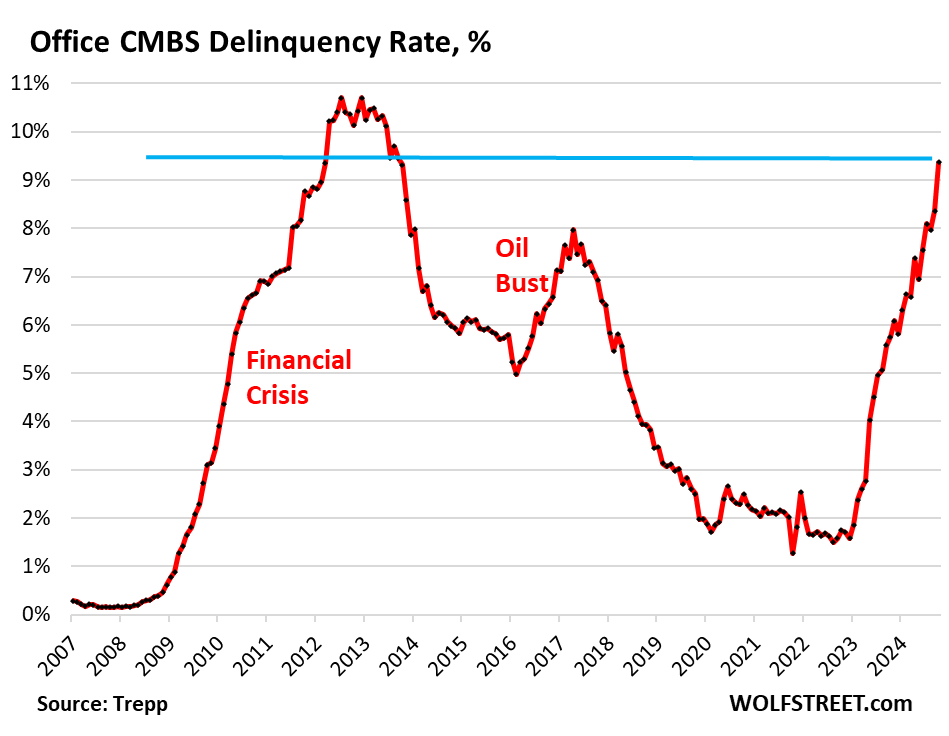
The delinquency rate of office mortgages backing commercial mortgage-backed securities (CMBS) spiked to 9.4% in October, up a full percentage point from September, and the highest since the worst months of the meltdown that followed the Financial Crisis. The delinquency rate has doubled since June 2023 (4.5%), according to data by Trepp, which tracks and analyzes CMBS.
Office CRE fund managers have spread the rumor that office CRE has bottomed out, but the CMBS delinquency rate doesn’t agree with this bottomed-out scenario; it’s aggressively spiking.
Three months ago, the delinquency rate surpassed the surge in delinquencies that followed the American Oil Bust from 2014 through 2016, when hundreds of companies in the US oil-and-gas sector filed for bankruptcy as the price of oil had collapsed due to overproduction, which devastated the Houston office market in 2016.
But now there’s a structural problem that won’t easily go away with the price of oil: A huge office glut has emerged after years of overbuilding and industry hype about the “office shortage” that led big companies to hog office space as soon as it came on the market with the hope they’d grow into it. However, during the pandemic, companies realized that they don’t need all this office space, and vast portions of it sits there vacant and for lease, with vacancy rates in the 25% to 36% range in the biggest markets.
Mortgages are considered delinquent by Trepp when the borrower fails to make the interest payment after the 30-day grace period. A mortgage is not considered delinquent here if the borrower continues to make the interest payment but fails to pay off the mortgage when it matures. This kind of repayment default, while the borrower is current on interest, would be on top of the delinquency rate here.
Loans are pulled off the delinquency list if the interest gets paid, or if the loan is resolved through a foreclosure sale, generally involving big losses for the CMBS holders, or if a deal gets worked out between landlord and the special servicer that represents the CMBS holders, such as the mortgage being restructured or modified and extended.
Survive till 2025 has been the motto. But that might not work either. The Fed has cut its policy rate by 50 basis points in September and is likely to cut more but in smaller increments. Many CRE loans are floating-rate loans that adjust to a short-term rate (SOFR), and short-term rates move largely with the Fed’s policy rates. And floating-rate loans will have lower interest rates as the Fed cuts.
Long-term rates, including fixed-rate mortgage rates have risen sharply since the Fed started cutting rates, so that option isn’t appealing.
So the hope in the CRE industry is that rate cuts will be steep and many, thereby reducing floating-rate interest payments, making it easier for landlords to meet them. And so the prescription was: Survive till 2025, when interest rates would be, they hope, far lower than they were.
But rate cuts will do nothing to address the structural issues that office CRE faces. The landlord of a nearly empty older office tower isn’t going to be able to make the interest payment even at a lower rate when the tower is largely vacant.
And these older office towers face the brunt of the vacancy rates, amid a flight to quality now feasible because of vacancies even at the latest and greatest properties. And there are a lot of these older office towers around that have been refinanced at very high valuations in the years before the pandemic, but whose valuations have now plunged by 50%, 60%, or 70%, and they have become a nightmare for lenders and CMBS holders.
After surprising top the upside in August, Housing Starts and Building Permits disappointed in September, declining more than expected (-0.5% MoM and -2.9% MoM respectively)…
Source: Bloomberg
Under the hood, multi-family permits plunged 10.8% MoM (and multi-family starts dropped for the second straight month). Single-family starts rose 2.7% MoM and permiots inchjed higher by 0.3% MoM…
Source: Bloomberg
Rate-cut expectations appear to have taken the excitement out of the building market…
Source: Bloomberg
Housing Completions also dropped (but the BLS thinks construction jobs continue to rise non-stop)…
Source: Bloomberg
So, The Fed cuts short-term rates… mortgage-rates rise… and builders slow their building plans… that’s not how it’s supposed to work!
Perhaps Harris/Walz should adopt the Imperial March from Star Wars as their theme song. Between Biden/Harris uncontrolled immigration disaster helping to destroy New York City, Harris’ statement that she won’t do anything differntly from Biden/Harris is alarming.
The NY Empire survey crashed from +11.5 to -11.9 – the lowest since May. That is the biggest MoM drop since January…
A measure of current new orders plunged nearly 20 points to -10.2 after climbing a month earlier to the highest since April 2023.
The index of shipments decreased almost 21 points to minus 2.7.
The employment index, however, rebounded to 4.1 – the first expansion in a year – while a measure of hours worked also climbed.
Meanwhile, the New York Fed’s gauge of prices paid for materials increased to a six-month high of 29, while an index of prices received by state manufacturers also accelerated.
And with this awful news, the US Treasury yield curve remains downward/upward sloping. I call this the schizophenic yield curve.
Biden/Harris will be remembered for many things, mostly BAD. Uncontrolled immigration, crime out of control, endless wars, grossly incompetent government administrators, 200k+ missing immigrant children, etc. But wreckless inflation coming from insane government spending takes the cake. And it is heating up again, with the help of The Feral Reserve. Yes, The FERAL Reserve.
Under Biden/Harris, prices are WAY up, real weekly earnings are WAY down.
For the 52nd straight month, core consumer prices rose on a MoM basis in September (+0.3% MoM – hotter than the 0.2% expected) – the strongest since March. That left Core CPI YoY up 3.3%, hotter than the 3.2% expected…
Source: Bloomberg
The headline CPI also printed hotter than expected (+0.2% MoM vs +0.1% MoM exp), with the YoY CPI up 2.4% (hotter than the 2.3% expected but lowest since Feb 2021)…
Source: Bloomberg
Core Services and Food costs surged in September…
Source: Bloomberg
Overall, headline consumer prices are up over 20% (5.1% p.a.) since the Biden-Harris admin took over, which compares to around 8% (1.97% p.a) during Trump’s first term…
Source: Bloomberg
The so-called SuperCore CPI also increased on a YoY basis to +4.6%…
Source: Bloomberg
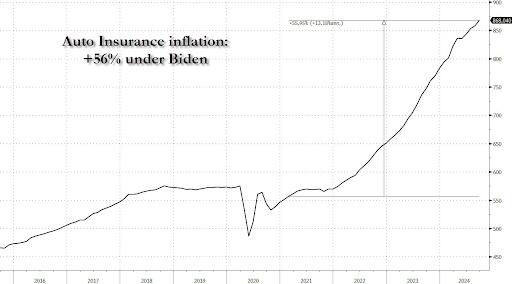
A surge in Transportation Services costs (record high auto insurance) and Medical Care Supplies lifted Super Core…
Source: Bloomberg
Why is the cost of auto insurance up 56% since Biden and Harris took over?
Source: Bloomberg
Real wages are down since the start of the Biden-Harris administration…
Source: Bloomberg
Finally, we note that money supply is resurgent once again, suggesting The Fed’s confidence in CPI’s decline may be misplaced…
Source: Bloomberg
Could we really replay the ’70s once again?
Source: Bloomberg
Will that really be Powell’s legacy? Or will the timing of this resurgence in inflation be perfectly timed to coincide with Trump’s election victory… and offer a perfect patsy for who is to blame?
It turns out that Powell’s “emergency” 50bps rate cut was – drumroll – another major policy mistake by the Fed. Or it is Presidential election interference by The Biden/Harris Administration giving Cacklin’ Kamala as talking point?
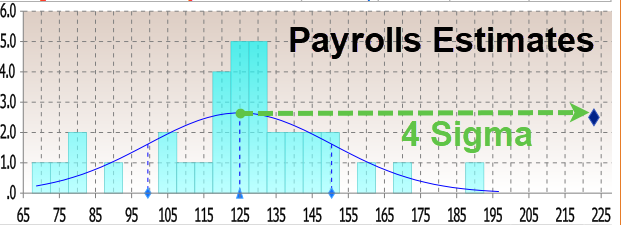
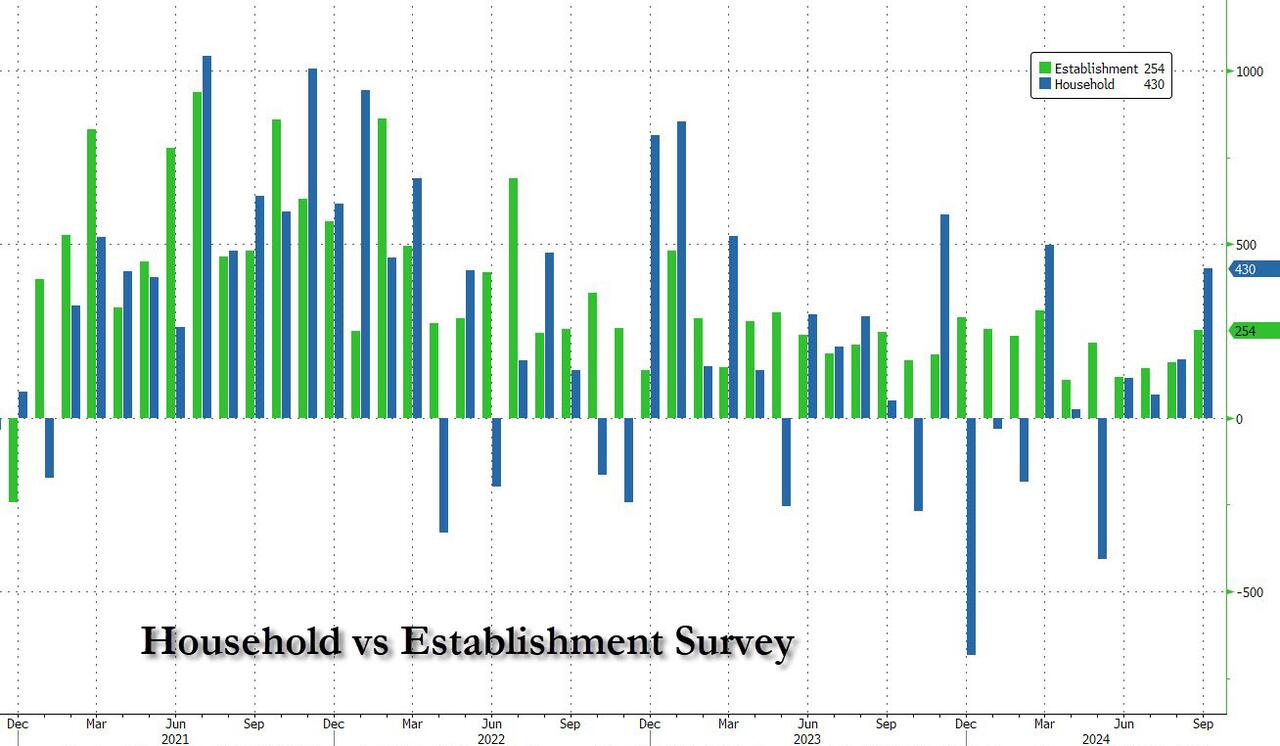
Moments ago, the BLS reported that at a time when prevailing consensus was for jobs to continue their recent downward slide sparked by the near-record annual jobs revision and several months of downbeat jobs reports, in September the US unexpectedly added a whopping 254K jobs, the biggest monthly increase since March…
There’s more: unlike previous months where we saw repeat downward job revisions, the BLS said that both prior months were revised up, to wit: the change in total nonfarm payroll employment for July was revised up by 55,000, from +89,000 to +144,000, and the change for August was revised up by 17,000, from +142,000 to +159,000. With these revisions, employment in July and August combined is 72,000 higher than previously reported.
Some context: as UBS notes, the moving six-month average on nonfarm payrolls is 167k. The estimate is that 150k is about consistent with a return of the economy to trend growth. Which means that inflation is about to come back with a vengeance, just as the Fed launches its easing cycle.
Remarkably, while payrolls jumped by the most in half a year, the number of employed people also surged, rising by a whopping 430K, also the biggest one-month jump since March.
It wasn’t just the payrolls, however, which came in far stronger than estimates: the unemployment rate also came in stronger than expected, and thanks to the jump in employed workers coupled with the decline in unemployed workers (from 7.115MM to 6.834MM), it dropped from 4.2% to 4.1% (and down from 4.3% two months ago which spared the entire recession panic).
Among the major worker groups, the unemployment rate for adult men (3.7 percent) decreased in September. The jobless rates for adult women (3.6 percent), teenagers (14.3 percent), Whites (3.6 percent), Blacks (5.7 percent), Asians (4.1 percent), and Hispanics (5.1 percent) showed little or no change over the month.
And here is the rub, because in a vacuum the super strong jobs numbers would have been fantastic, the only issue is that the September blowout comes as the Fed launches an easing cycle and as wages are once again rising as we have warned for the past 3 months. Indeed, in September, the average hourly earnings rose 0.4% sequentially, beating the estimate of 0.3%, while on an annual basis, wage growth was 4.0%, up from an upward revised 3.9% and beating the 3.8% estimate.
One note here: the average workweek for all employees edged down by 0.1 hour to 34.2 hours in September, which means the hourly earnings increase is not “pure” but rather a function of denominator adjustments. In manufacturing, the average workweek was unchanged at 40.0 hours, and overtime edged down by 0.1 hour to 2.9 hours. The average workweek for production and nonsupervisory employees on private nonfarm payrolls remained at 33.7 hours.
What sector had the biggest growth? UNPRODUCTIVE government workers! A record 785,000 government workers were added in September, pushing total govt workers also to a new record high.
The Biden/Harris Administration has given away billions of dollars to foreign nations (like Ukraine) and illegal immigrants so far this year,
– $24,400,000,000 to Ukraine.
– $11,300,000,000 to Israel.
– $1,950,000,000 to Ethiopia.
– $1,600,000,000 to Jordan.
– $1,400,000,000 to Egypt.
– $1,100,000,000 to Afghanistan.
– $1,100,000,000 to Somalia.
– $1,000,000,000 to Yemen.
– $987,000,000 to Congo.
– $896,000,000 to Syria.
– $9,000 per illegal immigrant that has entered the U.S.
And claim that FEMA has no money left for Hurricane Helene victims who have received only $750 per person. So I have plenty of reasons to have no trust or confidence in the Biden/Harris Mal-administration.


You must be logged in to post a comment.