Not a great sign for the mighty US economy.
This morning, the flash PMI for manufacturing printed at 47.8.

Three straight months of print below 50 means … contraction.

Do I say contraction?

Confounded Interest – Anthony B. Sanders
Financial Markets And Real Estate
Not a great sign for the mighty US economy.
This morning, the flash PMI for manufacturing printed at 47.8.
Three straight months of print below 50 means … contraction.
Do I say contraction?
I’ll feel a whole lot better … when Kamala Harris is gone.
Mortgage applications decreased 6.7 percent from one week earlier, according to data from the Mortgage Bankers Association’s (MBA) Weekly Applications Survey for the week ending October 18, 2024.
The Market Composite Index, a measure of mortgage loan application volume, decreased 6.7 percent on a seasonally adjusted basis from one week earlier. On an unadjusted basis, the Index decreased 7 percent compared with the previous week. The seasonally adjusted Purchase Index decreased 5 percent from one week earlier. The unadjusted Purchase Index decreased 5 percent compared with the previous week and was 3 percent higher than the same week one year ago.

The Refinance Index decreased 8 percent from the previous week and was 90 percent higher than the same week one year ago.

Implied volatility in Treasury yields has risen to the highest since December.

The US economy is crumbing down under Biden/Harris. No, the economy doesn’t hurt so good.
The Citi Economic Surprise Index just rose to its highest level since April.

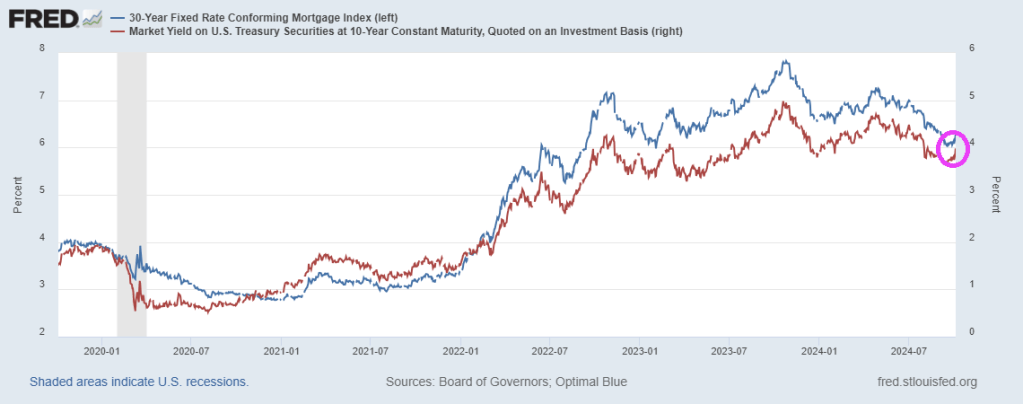
The 10Y Treasury yield just rose to its highest level since August.


SF Woman. That is my name for Kamala Harris, the ultimate political changeling, taking full credit for the economy, then trying to distance herself from Biden. As the US economy continues to contract.
Weakness in factory new orders continued to be a major drag on the US LEI in September as the global manufacturing slump persists. Additionally, the yield curve remained inverted, building permits declined, and consumers’ outlook for future business conditions was tepid. Gains among other LEI components were not significant enough to offset weakness among the four gauges mentioned above. Overall, the LEI continued to signal uncertainty for economic activity ahead.

*Changeling, in European folklore, a deformed or imbecilic offspring of fairies or elves substituted by them surreptitiously for a human infant. According to legend, the abducted human children are given to the devil or used to strengthen fairy stock.
Housing starts dropped -0.7% YoY in September.
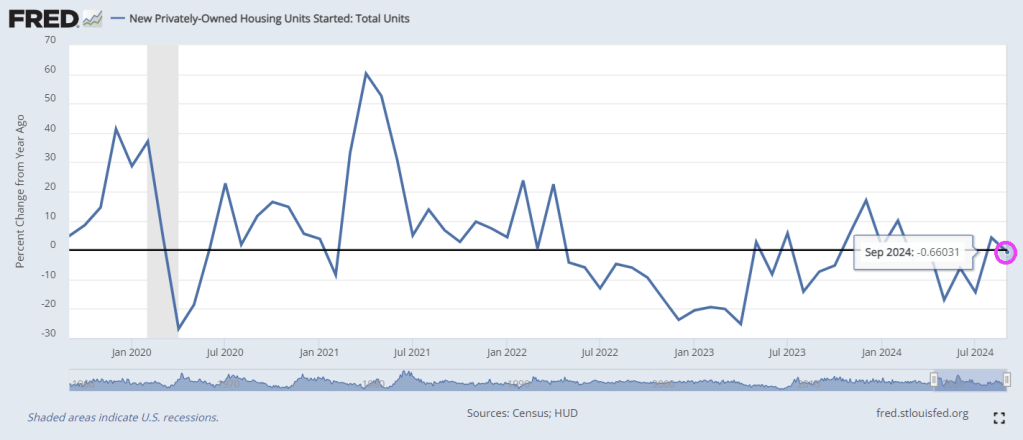
After surprising top the upside in August, Housing Starts and Building Permits disappointed in September, declining more than expected (-0.5% MoM and -2.9% MoM respectively)…
Under the hood, multi-family permits plunged 10.8% MoM (and multi-family starts dropped for the second straight month). Single-family starts rose 2.7% MoM and permiots inchjed higher by 0.3% MoM…
Rate-cut expectations appear to have taken the excitement out of the building market…
Housing Completions also dropped (but the BLS thinks construction jobs continue to rise non-stop)…
So, The Fed cuts short-term rates… mortgage-rates rise… and builders slow their building plans… that’s not how it’s supposed to work!
I would like to see Kamala Harris explain why mortgage purchase applications are down -60% under Biden/Harris Presidency. Other than a word salad answer. Or Cottage Cheese.
Mortgage applications decreased 17.0 percent from one week earlier, according to data from the Mortgage Bankers Association’s (MBA) Weekly Applications Survey for the week ending October 11, 2024.
The Market Composite Index, a measure of mortgage loan application volume, decreased 17.0 percent on a seasonally adjusted basis from one week earlier. On an unadjusted basis, the Index decreased 17 percent compared with the previous week. The seasonally adjusted Purchase Index decreased 7 percent from one week earlier. The unadjusted Purchase Index decreased 7 percent compared with the previous week and was 7 percent higher than the same week one year ago.

The Refinance Index decreased 26 percent from the previous week and was 111 percent higher than the same week one year ago.

Housing prices are up 34.2% under Biden/Harris while mortgage rates are up 138.6%.

Perhaps Harris/Walz should adopt the Imperial March from Star Wars as their theme song. Between Biden/Harris uncontrolled immigration disaster helping to destroy New York City, Harris’ statement that she won’t do anything differntly from Biden/Harris is alarming.
The NY Empire survey crashed from +11.5 to -11.9 – the lowest since May. That is the biggest MoM drop since January…

A measure of current new orders plunged nearly 20 points to -10.2 after climbing a month earlier to the highest since April 2023.
The index of shipments decreased almost 21 points to minus 2.7.
The employment index, however, rebounded to 4.1 – the first expansion in a year – while a measure of hours worked also climbed.
Meanwhile, the New York Fed’s gauge of prices paid for materials increased to a six-month high of 29, while an index of prices received by state manufacturers also accelerated.

And with this awful news, the US Treasury yield curve remains downward/upward sloping. I call this the schizophenic yield curve.

There have been to significant jumps in the Federal Debt. The first coming after the financial crisis of 2008 and election of Obama/Biden in 2008. The second with the outbreak of Covid in 2020 and the election of Biden/Harris in 2021.
The Federal (public) debt was just over $10 million when Obama/Biden were elected and it now stands at a staggering $35.7 trillion. That represents over a tripling of the Federal debt under Obama/Biden/Harris. So when asked what she would do diffeerent than Biden, Harris replied “Nothing comes to mind.” That means MORE spending, MORE debt and MORE unproductive Government jobs.

Here is a chart of public debt and GDP under the triumvirate of Obama, Biden and Harris. No, not Julius Caesar, Pompey, and Crassus). But it is feeling like the Roman Empire prior to its collapse.

Here is a chart of government jobs and government expenditures. Great for government workers, bad for everyone else.

Of course, SOMEBODY has to pay the growing gov’t debt burden. Rest assured it won’t be Obama/Biden/Harris.
Here is Obama holding court.

Biden/Harris will be remembered for many things, mostly BAD. Uncontrolled immigration, crime out of control, endless wars, grossly incompetent government administrators, 200k+ missing immigrant children, etc. But wreckless inflation coming from insane government spending takes the cake. And it is heating up again, with the help of The Feral Reserve. Yes, The FERAL Reserve.
Under Biden/Harris, prices are WAY up, real weekly earnings are WAY down.
Gas: +38.2%
Electricity: +31.3%
Fuel oil: +37.4%
Airfare: +24.5%
Hotels: +42.4%
Groceries: +22.1%
Eggs: +69.2%
Baby food: +31%
K-12 food: +69.7%
Rent: +22.9%
Transportation: +31.1%
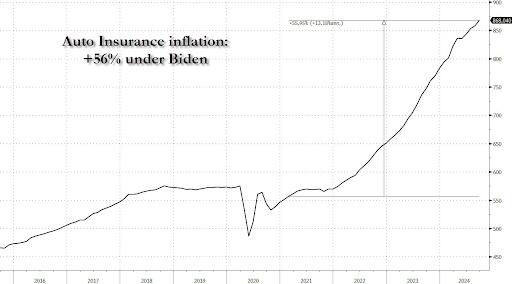
Car insurance: +56.5%
Real average weekly earnings: -3.4%
For the 52nd straight month, core consumer prices rose on a MoM basis in September (+0.3% MoM – hotter than the 0.2% expected) – the strongest since March. That left Core CPI YoY up 3.3%, hotter than the 3.2% expected…
The headline CPI also printed hotter than expected (+0.2% MoM vs +0.1% MoM exp), with the YoY CPI up 2.4% (hotter than the 2.3% expected but lowest since Feb 2021)…
Core Services and Food costs surged in September…
Overall, headline consumer prices are up over 20% (5.1% p.a.) since the Biden-Harris admin took over, which compares to around 8% (1.97% p.a) during Trump’s first term…
The so-called SuperCore CPI also increased on a YoY basis to +4.6%…
A surge in Transportation Services costs (record high auto insurance) and Medical Care Supplies lifted Super Core…
Why is the cost of auto insurance up 56% since Biden and Harris took over?
Real wages are down since the start of the Biden-Harris administration…
Finally, we note that money supply is resurgent once again, suggesting The Fed’s confidence in CPI’s decline may be misplaced…
Could we really replay the ’70s once again?
Will that really be Powell’s legacy? Or will the timing of this resurgence in inflation be perfectly timed to coincide with Trump’s election victory… and offer a perfect patsy for who is to blame?
Thunderstruck! Interest rates should be thunderstruck when realization dawns that the recend BLS jobs reporr was grossly mismeasured.
National unemployment was 8.7% in this month’s Rasmussen Reports Real Unemployment and significantly more than double the 4.1% rate officially reported by the Bureau of Labor Statistics today.
Mortgage rates are rising again with Friday’s surprising jobs report. But as it just a false election report. If Rasmussen is correct, mortgage rates should FALL again.

You must be logged in to post a comment.