S&P/Case-Shiller released the monthly Home Price Indices for August (“August” is a 3-month average of June, July and August closing prices). August closing prices include some contracts signed in April, so there is a significant lag to this data. Here is a graph of the month-over-month (MoM) change in the Case-Shiller National Index Seasonally Adjusted (SA).
The US is the expensive tower of power … but it should be cheap. Getting rid of coal power was idiotic and The Left’s fear of nuclear power is laughable.
Europe’s fertilizer plants, steel mills, and chemical manufacturers were the first to succumb. Massive paper mills, soybean processors, and electronics factories in Asia went dark. Now soaring natural gas and electricity prices are starting to hit the US industrial complex.
On June 22, 600 workers at the second-largest aluminum mill in America, accounting for 20% of US supply, learned they were losing their jobs because the plant can’t afford an electricity tab that’s tripled in a matter of months. Century Aluminum Co. says it’ll idle the Hawesville, Kentucky, mill for as long as a year, taking out the biggest of its three US sites. A shutdown like this can take a month as workers carefully swirl the molten metal into storage so it doesn’t solidify in pipes and vessels and turn the entire facility into a useless brick. Restarting takes another six to nine months. For this reason, owners don’t halt operations unless they’ve exhausted all other options.
At least two steel mills have begun suspending some operations to cut energy costs, according to one industry executive, who asked not to be identified because the information isn’t public. In May, a group of factories across the US Midwest warned federal energy regulators that some were on the verge of closing for the summer or longer because of what they described as “unjust and unreasonable” electricity costs. They asked to be wholly absolved of some power fees—a request that, if granted, would be unprecedented.
Michael Harris, whose firm Unified Energy Services LLC buys fuel for industrial clients, says costs have risen so high that some are having to put millions of dollars of credit on the line to secure power and gas contracts. “That can be devastating for a corporation,’’ he says. “I don’t see any scenario, absent explosions at US LNG facilities’’ that trap supplies at home, in which gas prices are headed lower in the long term.
EIA Average Electricity Cost Cents
EIA cost data chart by Mish
EIA Cost Data January 2021 vs May 2022
Residential: 12.69 to 14.92
Commercial: 10.31 to 12.14
Industrial: 6.39 to 8.35
Transportation: 9.61 to 10.79
All: 10.36 to 12.09
Those prices are through May 2022. Much electrical energy comes from natural gas.
US Natural Gas Futures
US Natural Gas Futures courtesy of Trading Economics
US gas prices fluctuated wildly in June and July. I suspect the average price is 7.33 or so for both months. Things are decidedly worse in Europe.
EU Natural Gas Price
US Natural Gas Futures courtesy of Trading Economics
From 25 or even 50 to 200 is one hell of a leap. It’s somewhere between 300% and 700% depending on your starting point vs 100% or so for the US.
Let’s now check the latest PPI data for a look at where things are and more importantly headed.
PPI Electrical Power Index 2020-Present
PPI data from the BLS, chart by Mish
From pre-pandemic to January of 2021, the PPI electrical power index was flat. It has since surged on a relatively steady pace.
From May to July the index went from 231 to 238. That tacks on another three percentage points since the EIA report.
PPI Electrical Power Index 1991-Present
PPI data from the BLS, chart by Mish
Long Term Trend
The long-term trend does not exactly look pretty.
And as Bloomberg noted, Century Aluminum Co. says it’ll idle the Hawesville, Kentucky, mill for as long as a year, taking out the biggest of its three US sites.
The beer industry uses more than 41 billion aluminum cans annually, according to a Beer Institute letter to the White House dated July 1.
“These tariffs reverberate throughout the supply chain, raising production costs for aluminum end-users and ultimately impacting consumer prices,” according to the letter signed by the CEOs of Anheuser-Busch, Molson Coors, Constellation Brands Inc.’s beer division, and Heineken USA.
This letter to the president comes amid the worst inflation in more than 40 years and just months after aluminum touched a multi-decade high. Prices for the metal have since eased significantly.
Whatever victory beer makers and drinkers may have with aluminum prices may not last with US aluminum plants shutting down.
Then again, the cure for everything is likely to be a huge recession.
Zero Consumer Inflation
I am pleased to report there was no consumer inflation in July.
The CPI report resulted in a nonsensical Twitter debate on the meaning of zero. For the record, assuming you believe the numbers, there was indeed zero inflation month-over-month.
The accurate rebuttal is: One month? So what?
Moreover, zero is not as good as it looks. All of it was due to a 7.7 percent decline in the price of gasoline. And year-over-year inflation was a hot 8.5 percent.
Meanwhile, rent and food keep rising and the price of rent will be sticky. Gasoline is more dependent on recession and global supply chains.
The above reports and this one industrial costs puts a spotlight on the silliness of the Fed’s focus on consumer inflation as if that’s all that matters.
The Fed has blown three consecutive bubbles trying to produce two percent consumer inflation while openly promoting raging bubbles in assets and missing the boat entirely on industrial matters.
I just watched Dennis Quaid in “Reagan”. Excellent film. But it reminded me of how Reagan sank the Soviet Union: by outspending the Soviet Union on the arms race. It worked! The Soviet Union, hamstrung by grossly inefficent central planning, couldn’t keep up and collapsed under President George H.W.Bush.
Fast forward to today. Starting with Barack Obama and Joe Biden in 2009, following the financial crisis in 2008. The Federal government ramped up Federal spending, and Federal debt. While The Federal Reserve, the hand maiden to the Federal government, ramped up M2 Money supply.
“You never want a serious crisis to go to waste. And what I mean by that is an opportunity to do things that you think you could not do before.” – Rahm Emmanuel
Then came Biden/Harris who drove Federal debt and spending to absurb level (orange box). Like the financial crisis, fans of big government and big government spending will utter the word “Covid.” But that is gross misleading. Covid was the excused for wild spending and debt issurance. And MORE Fed money printing. It’s almost as if Obama/Biden/Harris were replicating Reagan’s bankrupcy strategy in reverse! That is, collapsing the US from within.
As we are all painfully aware, the US Debt now stands at $36 TRILLION with $220.3 TRILLION in unfunded liabilities. Too bad total US Assets are only $217 TRILLON.
Do I believe that Obama/Biden/Harris want a “Great Reset”? Absolutley. Just look at our fiscally unsustable open borders and our politiicians blatanly lying to us. :Like Ohio’s Senator Sherrod Brown who brags about his helping write the border bill that would reverse Trump’s deportations and fund the speeding up of immigration.
Mortgage applications decreased 6.7 percent from one week earlier, according to data from the Mortgage Bankers Association’s (MBA) Weekly Applications Survey for the week ending October 18, 2024.
The Market Composite Index, a measure of mortgage loan application volume, decreased 6.7 percent on a seasonally adjusted basis from one week earlier. On an unadjusted basis, the Index decreased 7 percent compared with the previous week. The seasonally adjusted Purchase Index decreased 5 percent from one week earlier. The unadjusted Purchase Index decreased 5 percent compared with the previous week and was 3 percent higher than the same week one year ago.
The Refinance Index decreased 8 percent from the previous week and was 90 percent higher than the same week one year ago.
Implied volatility in Treasury yields has risen to the highest since December.
SF Woman. That is my name for Kamala Harris, the ultimate political changeling, taking full credit for the economy, then trying to distance herself from Biden. As the US economy continues to contract.
Weakness in factory new orders continued to be a major drag on the US LEI in September as the global manufacturing slump persists. Additionally, the yield curve remained inverted, building permits declined, and consumers’ outlook for future business conditions was tepid. Gains among other LEI components were not significant enough to offset weakness among the four gauges mentioned above. Overall, the LEI continued to signal uncertainty for economic activity ahead.
*Changeling, in European folklore, a deformed or imbecilic offspring of fairies or elves substituted by them surreptitiously for a human infant. According to legend, the abducted human children are given to the devil or used to strengthen fairy stock.
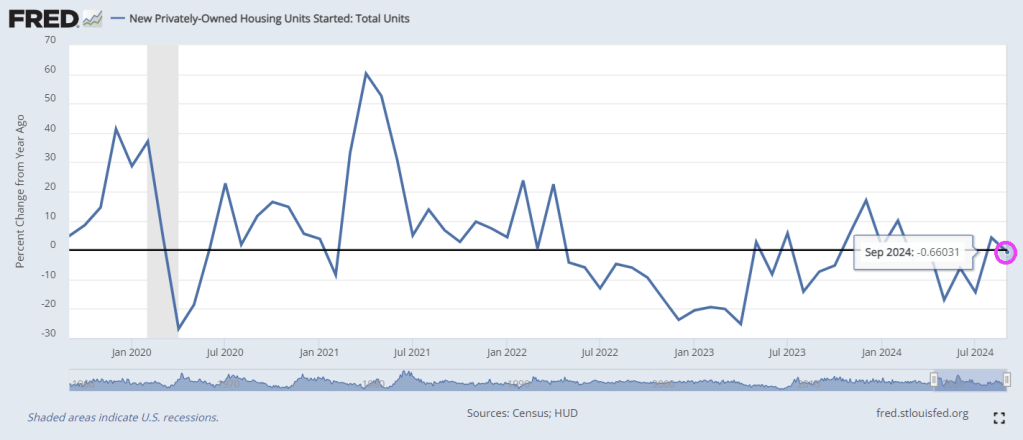
After surprising top the upside in August, Housing Starts and Building Permits disappointed in September, declining more than expected (-0.5% MoM and -2.9% MoM respectively)…
Source: Bloomberg
Under the hood, multi-family permits plunged 10.8% MoM (and multi-family starts dropped for the second straight month). Single-family starts rose 2.7% MoM and permiots inchjed higher by 0.3% MoM…
Source: Bloomberg
Rate-cut expectations appear to have taken the excitement out of the building market…
Source: Bloomberg
Housing Completions also dropped (but the BLS thinks construction jobs continue to rise non-stop)…
Source: Bloomberg
So, The Fed cuts short-term rates… mortgage-rates rise… and builders slow their building plans… that’s not how it’s supposed to work!
I would like to see Kamala Harris explain why mortgage purchase applications are down -60% under Biden/Harris Presidency. Other than a word salad answer. Or Cottage Cheese.
Mortgage applications decreased 17.0 percent from one week earlier, according to data from the Mortgage Bankers Association’s (MBA) Weekly Applications Survey for the week ending October 11, 2024.
The Market Composite Index, a measure of mortgage loan application volume, decreased 17.0 percent on a seasonally adjusted basis from one week earlier. On an unadjusted basis, the Index decreased 17 percent compared with the previous week. The seasonally adjusted Purchase Index decreased 7 percent from one week earlier. The unadjusted Purchase Index decreased 7 percent compared with the previous week and was7 percent higher than the same week one year ago.
The Refinance Index decreased 26 percent from the previous week and was 111 percent higher than the same week one year ago.
Housing prices are up 34.2% under Biden/Harris while mortgage rates are up 138.6%.
Perhaps Harris/Walz should adopt the Imperial March from Star Wars as their theme song. Between Biden/Harris uncontrolled immigration disaster helping to destroy New York City, Harris’ statement that she won’t do anything differntly from Biden/Harris is alarming.
The NY Empire survey crashed from +11.5 to -11.9 – the lowest since May. That is the biggest MoM drop since January…
A measure of current new orders plunged nearly 20 points to -10.2 after climbing a month earlier to the highest since April 2023.
The index of shipments decreased almost 21 points to minus 2.7.
The employment index, however, rebounded to 4.1 – the first expansion in a year – while a measure of hours worked also climbed.
Meanwhile, the New York Fed’s gauge of prices paid for materials increased to a six-month high of 29, while an index of prices received by state manufacturers also accelerated.
And with this awful news, the US Treasury yield curve remains downward/upward sloping. I call this the schizophenic yield curve.


You must be logged in to post a comment.