Joe Biden is leaving the Presidency with an attrocious record. While saying he is leaving Trump with the strongest economy in modern times, the is actually leaving Trump and Republicans with a hollow shell for an economy. It is the final punch in the jaw from an angry, failed President.
The following chart shows that in October and November, the US deficit exploded to a staggering $624.2 billion, and even though this included several calendar adjustments – which explains the freak September surplus which as we said was due to calendar effects – the November deficit of $367 billion was $14 billion more than consensus estimates of $353 billion. Worse, combining October and November we find that not only was the combined number of $624 billion some 64% higher than the corresponding period one year ago, but it was also the highest deficit on record for the first two-months of the year (and that includes the spending insanity during the covid crisis).
Putting the deficit in context, the budget deficit in October and November – the first two months of fiscal 2025 – are now officially the worst start a year for the US Treasury on record.
No wonder even Statist Janet Yellen (Treasury Secretary who failed utterly at her job) apologized that her abysmal performance. “I am concerned about fiscal sustainability and I am sorry that we haven’t made more progress,” she said adding that “I believe that the deficit needs to be brought down especially now that we’re in an environment of higher interest rates.” Meanwhile Biden keeps handing out $$$ to Ukraine, Africa, Syria, illegal immigrants and anything else that asks … unless it it American citizens. Man, does Biden HATE America!
Here is Yellen’s record on debt. A total of $15.2 TRILLION under her leadership.
Under Biden/Yellen (don’t forget Senate fools like Schumer and McConnell!), debt interest has surpassed Social Security and Medicare as the second largest government agency expense.
Biden is a classic progressive Democrat, spending other people’s money like a wild man (sort of like California Governor “Greasy Gavin” Newsom’s father. Or grandfather. And let’s not forget the $222 TRILLION in UNFUNDED liabilities such as Social Security and Medicare.
“See Joe, I can destroy California’s economy just like you destroyed the US economy!”
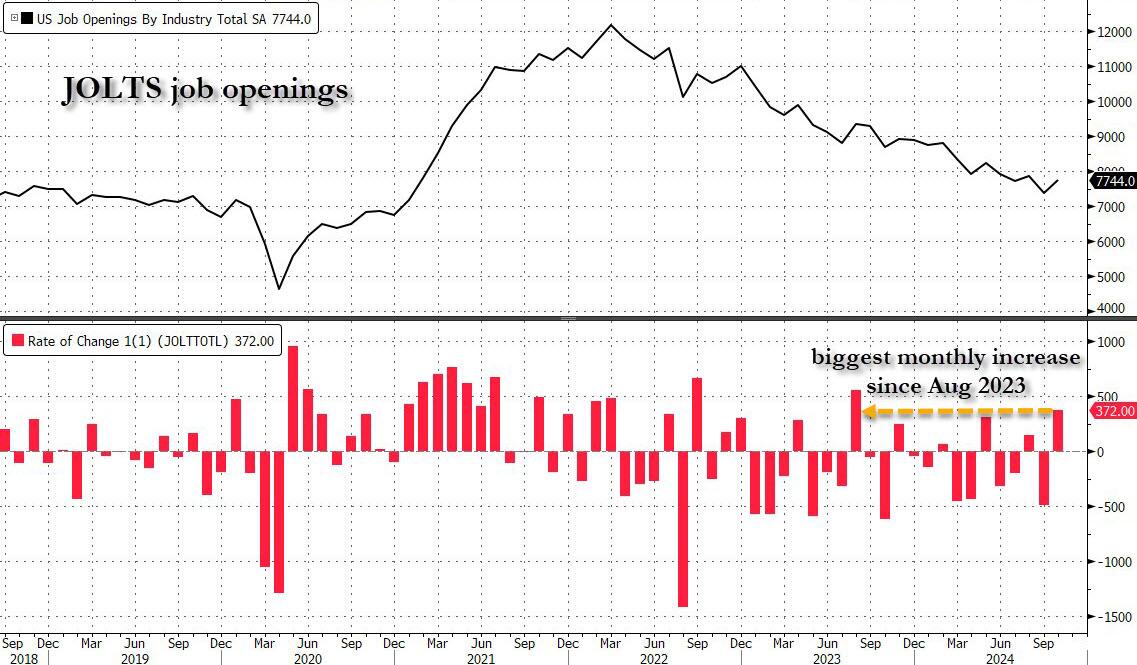
After last month’s catastrophic JOLTS report, which was a disaster across the board, and which was meant to give the Fed a green light to cut rates more after Biden won the election (which he didn’t, but the Fed still had to cut even if Trump is now in control), some speculated that Biden’s Department of Labor will do everything in its power to sabotage further rate cuts by the Fed, most notably the upcoming December decision in two weeks time, by pushing out much stronger than expected economic data. That’s precisely what happened moments ago when the DOL reported that in October, the number of job openings in the US soared by a whopping 372K, the biggest monthly increase since August 2023, to 7.744 million from 7.372 million.
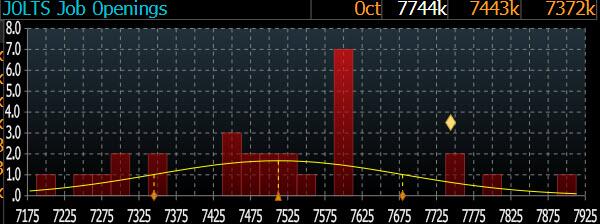
The JOLTS print smashed the median estimate of 7.519 million by 225K…
… with just 4 analysts (out of 28) predicting a higher job openings number.
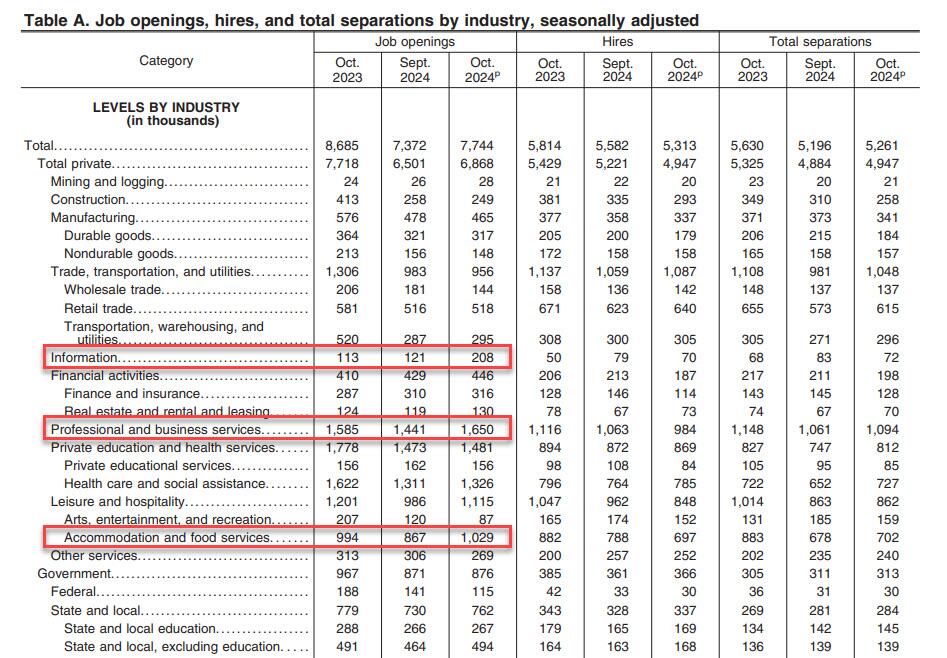
According to the DOL, the job openings rate, at 4.6 percent, changed little over the month. The number of job openings increased in professional and business services (+209,000), accommodation and food services (+162,000), and information (+87,000) but decreased in federal government (-26,000).
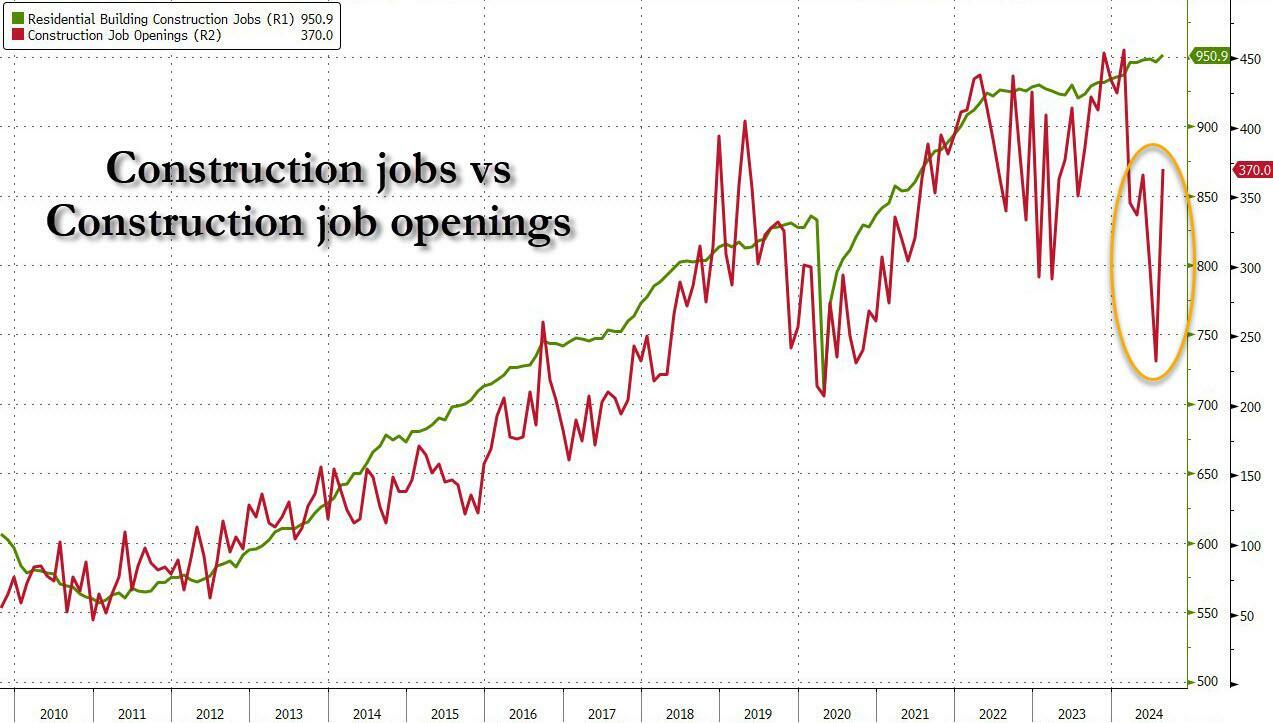
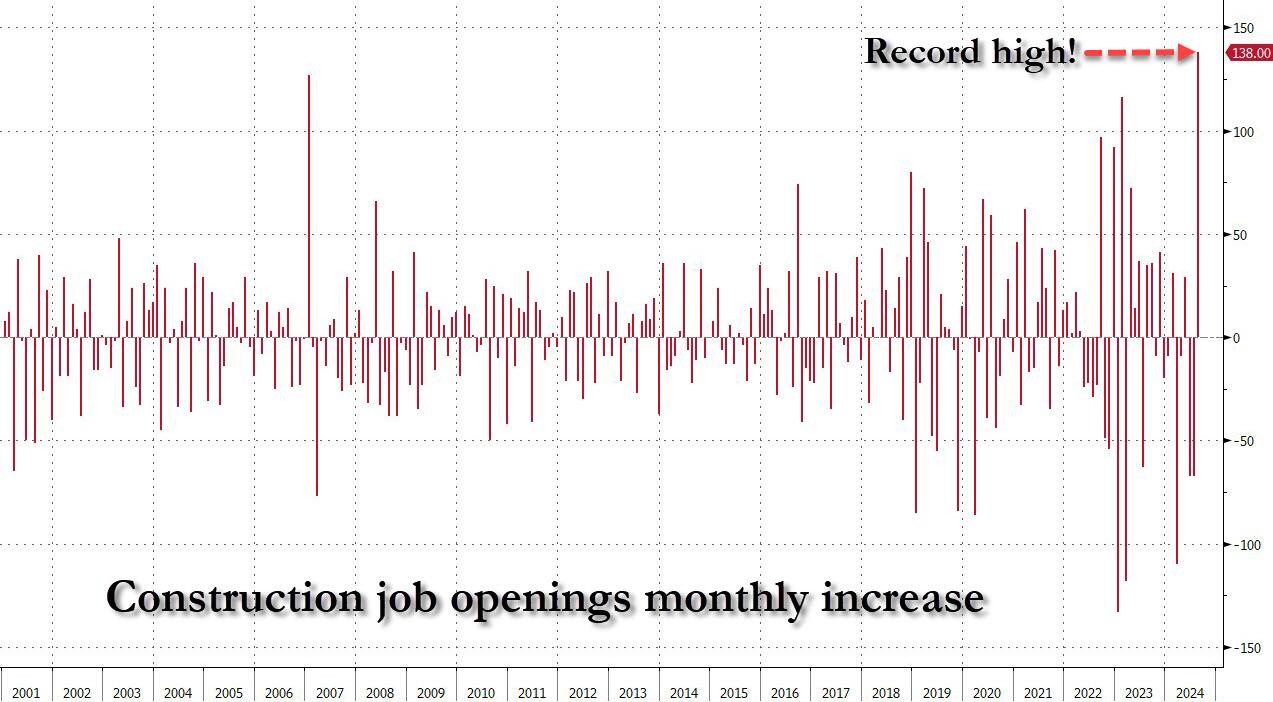
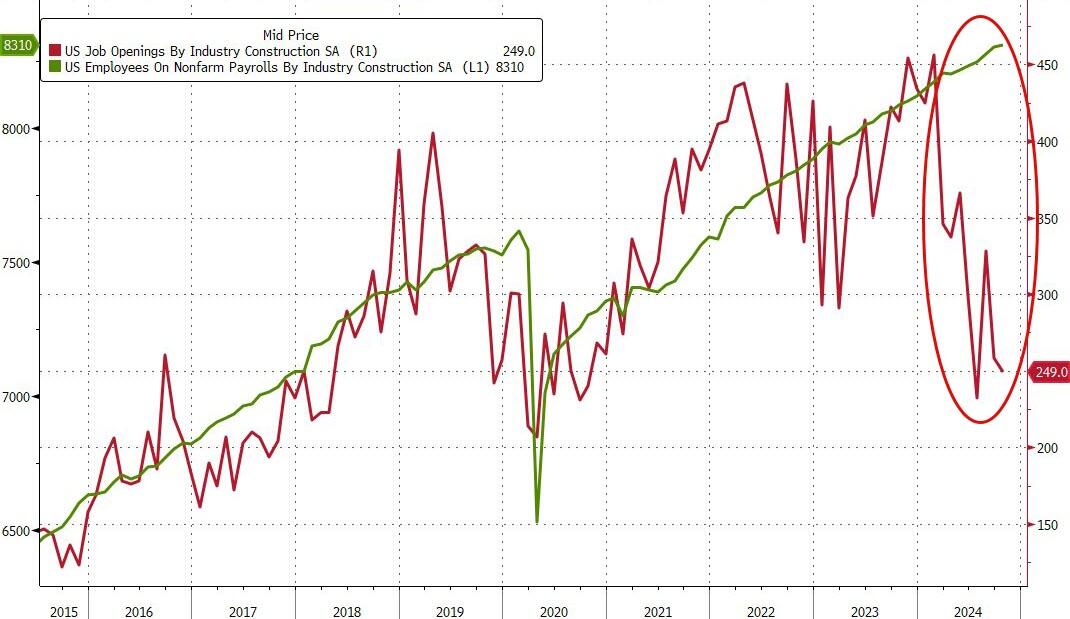
Amusingly, after we mocked two months ago the stunning surge in construction job openings just as a record chasm had opened between the manipulated number of construction jobs and openings…
… which meant the biggest monthly surge in construction job openings on record at a time when the housing market has effectively frozen thanks to sky high interest rates, a simply glorious paradox of manipulated bullshit data…
… the BLS realized that it had to make an adjustment after getting called out, and Construction Job openings dropped by another 9K to 249K and back to post-covid lows. Oh, and yes, the number of “construction jobs” is about to fall off a cliff just as soon as Orange Man Bad enters the White House.
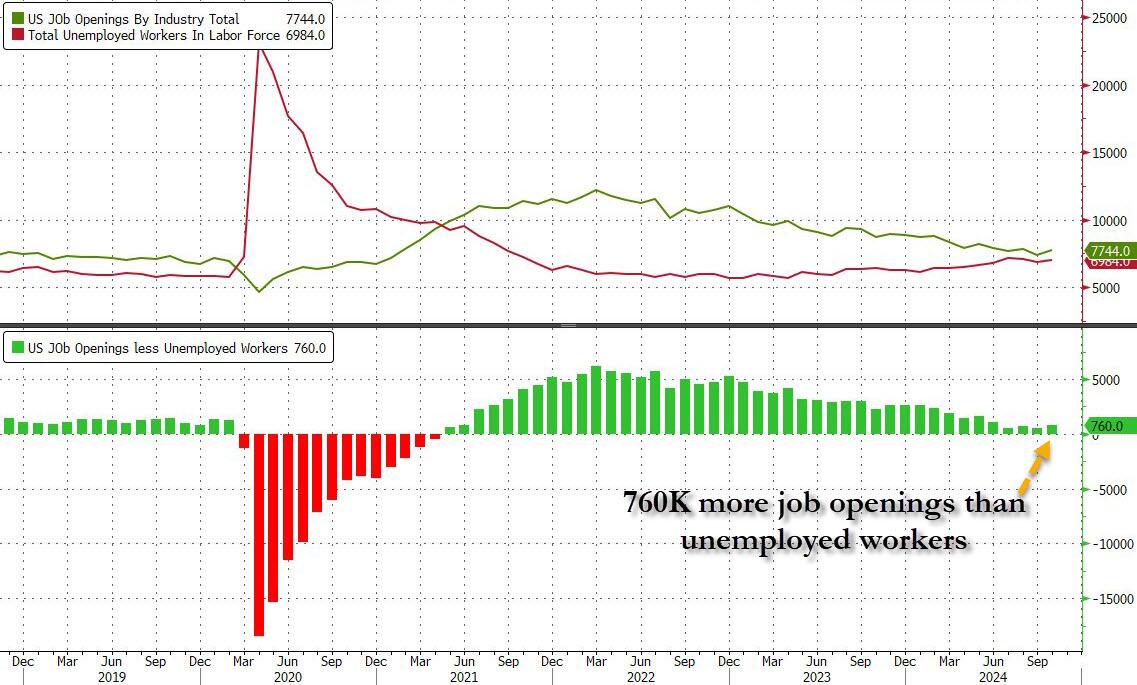
Setting the glaring data manipulation aside, in the context of the broader jobs report, in October the number of job openings was 770K more than the number of unemployed workers, an increase from the previous month and not too far from inverting once again, similar to what happened during the covid crash.
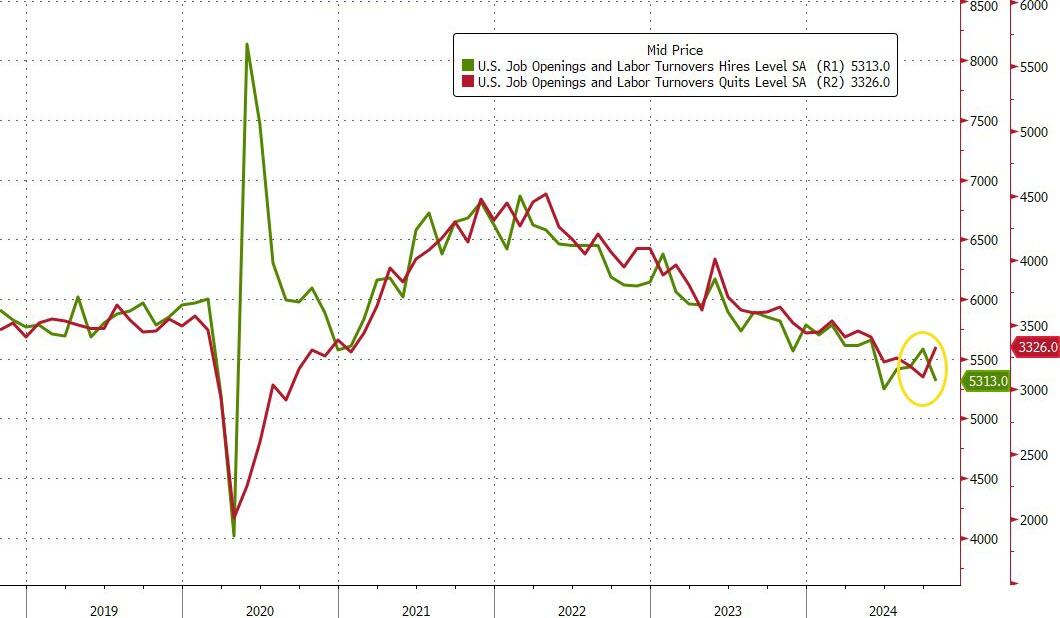
But while the job openings surge was a surprising reversal of the deteriorating trend observed for much of 2024, where even the DOL was stumped was the number of hires, which tumbled from 5.582 million to 5.313 million, a new post-covid low.
Commenting on the plunge, SouthBay Research notes that “hiring was weak in October and the last time hiring was this low was June and NFP slowed to 118K. But remember that this data aligns with the October Payroll data – not November’s. Both October NFP and the latest October JOLTS Hiring data cover the same period (through mid-October).” Furthermore, there were an additional 4 weeks since this JOLTS survey and hurricane recovery (aka hiring) rebounded. In addition, as the Job Openings indicate, employer intent to hire was already underway when this survey was completed.
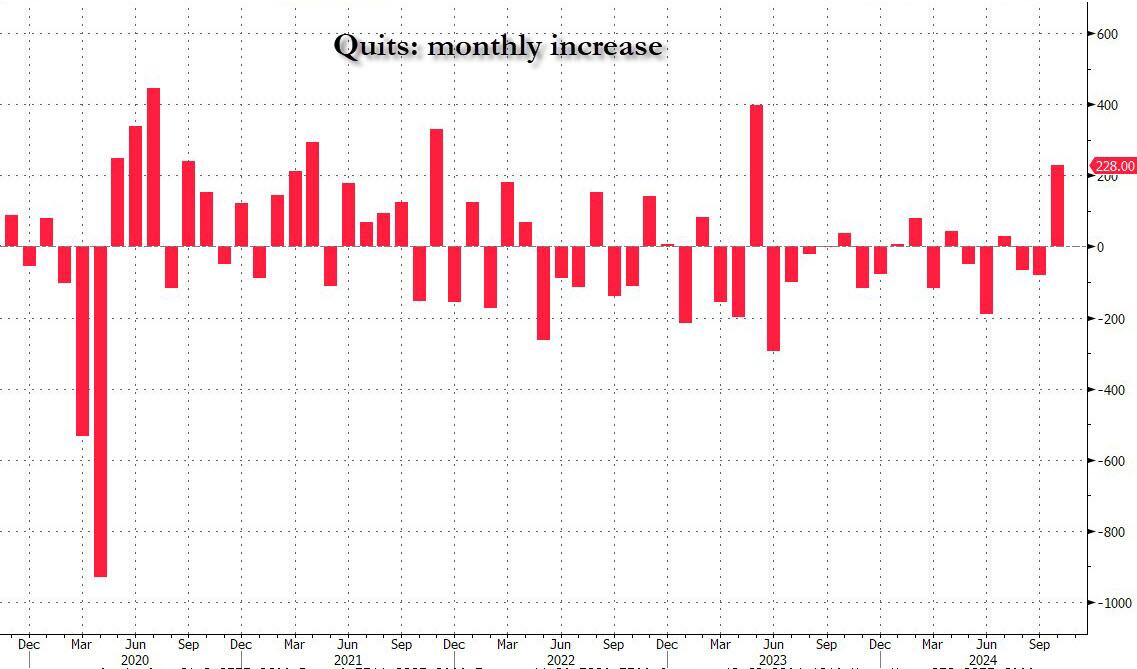
Meanwhile, the drop in hiring was offset by a surprise spike in the number of Quits, which rose by 228K from 3.098MM to 3.326MM, the biggest increase since May 2023, with quits increasing in accommodation and food services (+90,000).
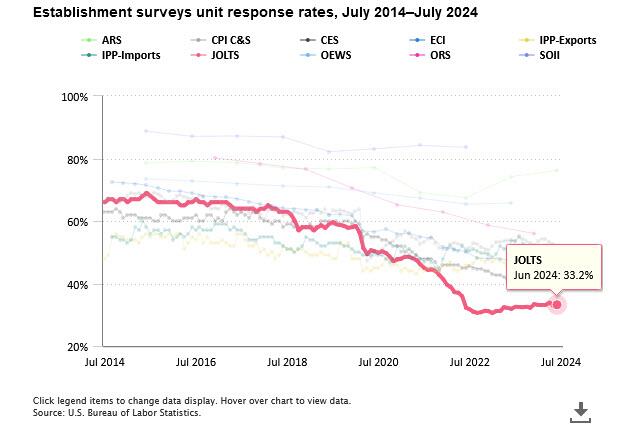
Finally, no matter what the “data” shows, let’s not forget that it is all just estimated, and it is safe to say that the real number of job openings remains still far lower since half of it – or some 70% to be specific – is guesswork. As the BLS itself admits, while the response rate to most of its various labor (and other) surveys has collapsed in recent years, nothing is as bad as the JOLTS report where the actual response rate remains near a record low 33%
In other words, more than two thirds, or 67% of the final number of job openings, is made up!
Looking ahead to Friday’s November Nonfarm Payrolls, the report will be driven by hurricane recovery, with the JOLTS data pointing to a lot of weakness in exactly the areas October Payrolls slipped. As for organic hiring, there have been no anecdotal signs of hiring pullback heading into November. On the contrary: businesses seem to be inclined to ramp up a bit, now that Trump is president and promises a dramatic easing of regulations.
After yesterday’s in line – but really cooler than whispered – CPI which restored hope in a December rate cut, all eyes are on this morning’s PPI print to boost dovish hopes that the Fed’s easing cycle would remain on track. It was not meant to be, however, as the PPI came in hotter than expected across the board on both a monthly and annual basis.
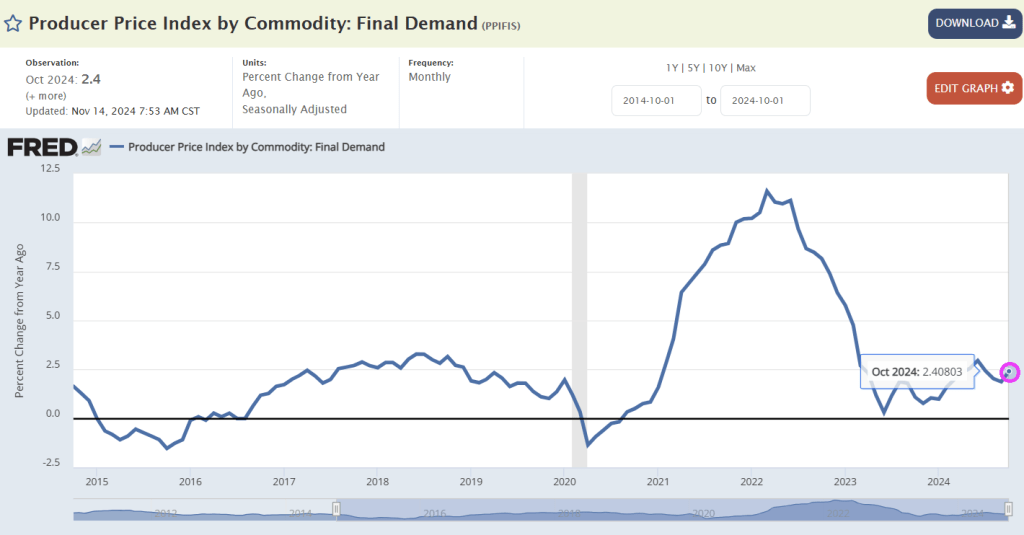
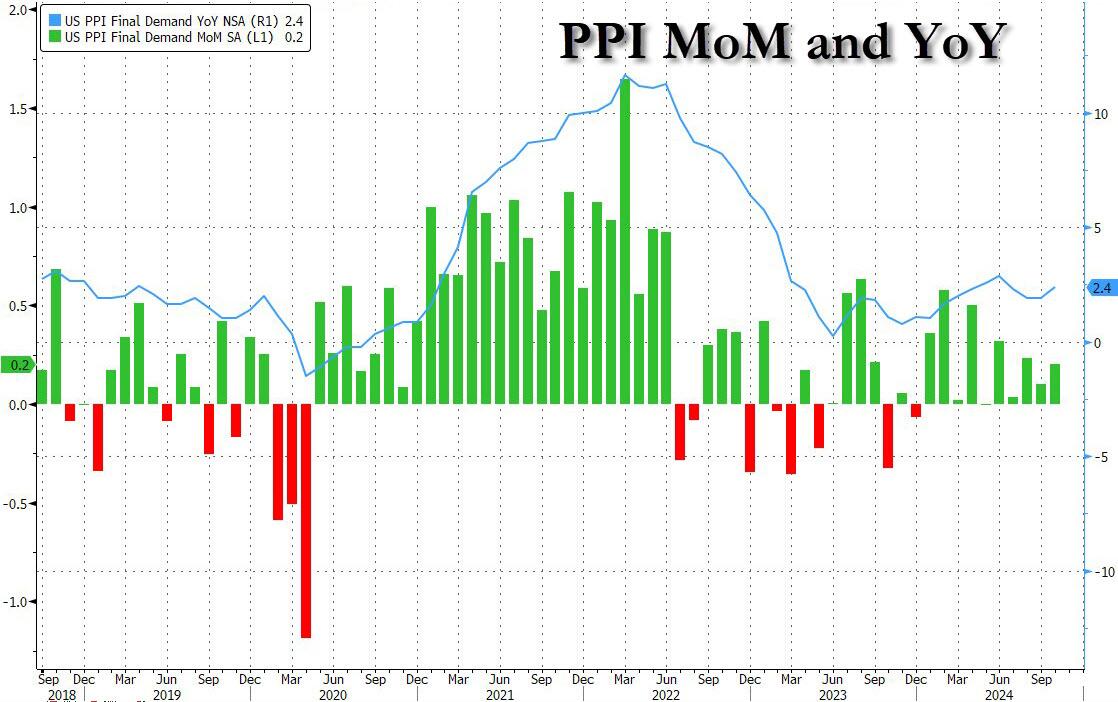
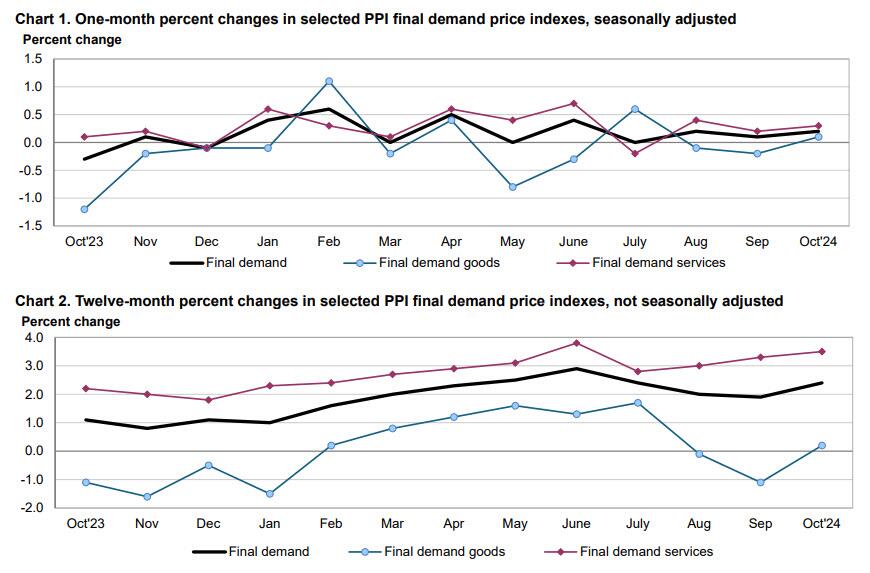
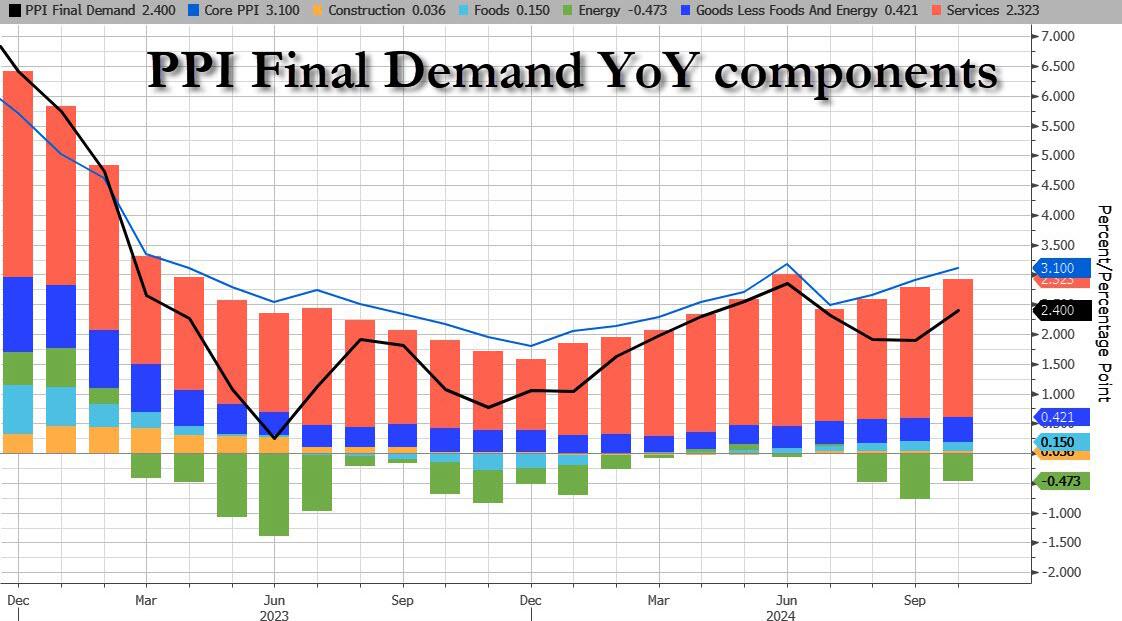
Starting at the top, headline PPI rose 0.2% MoM (in line with the +0.2% expected) but September was revised higher from 0.0% to 0.1%; meanwhile on an annual basis, headline PPI rose 2.4%, higher than the 2.3% expected, with the last month also revised higher from 1.8% to 1.9%.
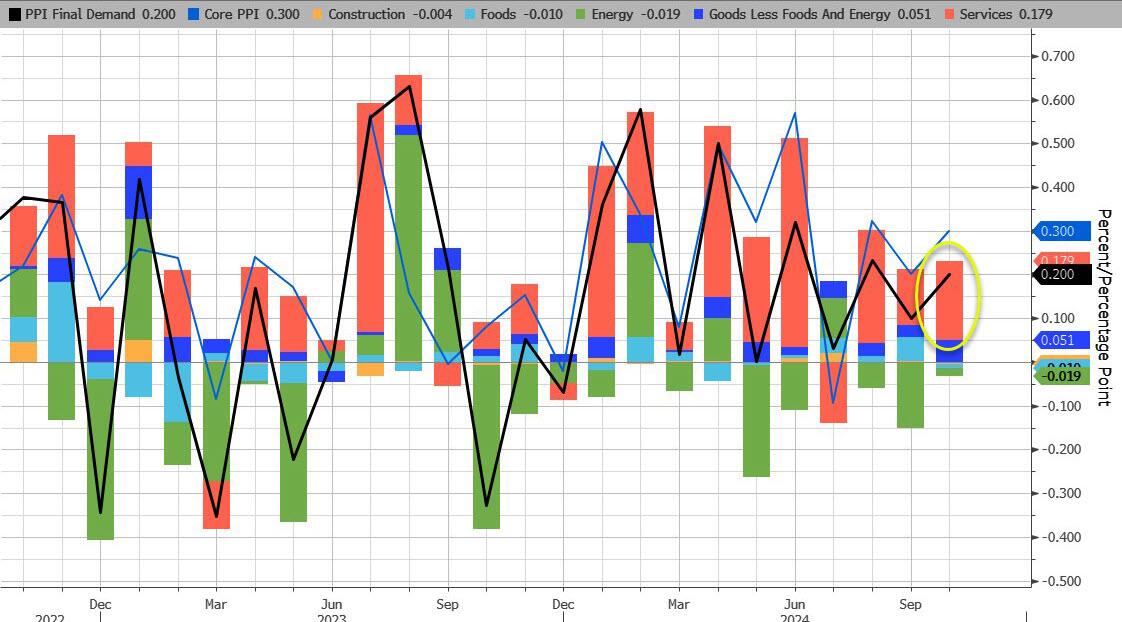
Unlike last month when a drop in energy prices weighed heavily on the headline PPI number, this month energy subtracted just 0.02% from the final print, the lowest detraction since July. Meanwhile, Services added a hefty 0.179% to the bottom line number.
Indeed, according to the BLS, most of the rise in final demand prices can be traced to a 0.% advance in the index for final demand services. Prices for final demand goods inched up 0.1%, the first increase in the index since July.
Taking a closer look at the components:
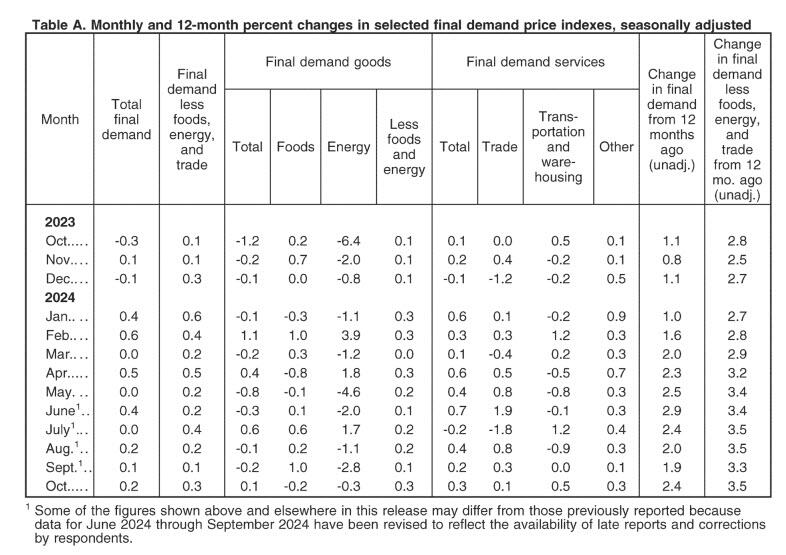
Final demand services: The index for final demand services increased 0.3 percent in October after rising 0.2 percent in September. Over three-fourths of the broad-based advance in October is attributable to prices for final demand services less trade, transportation, and warehousing, which moved up 0.3 percent. The indexes for final demand transportation and warehousing services and for final demand trade services also increased, 0.5 percent and 0.1 percent, respectively. (Trade indexes measure changes in margins received by wholesalers and retailers.)
Product detail:
Over one-third of the rise in the index for final demand services can be traced to prices for portfolio management, which advanced 3.6 percent. The indexes for machinery and vehicle wholesaling; airline passenger services; computer hardware, software, and supplies retailing; outpatient care (partial); and cable and satellite subscriber services also moved higher.
In contrast, margins for apparel, footwear, and accessories retailing fell 3.7 percent. Prices for securities brokerage, dealing, investment advice, and related services and for truck transportation of freight also declined.
Final demand goods: The index for final demand goods inched up 0.1 percent in October following two consecutive decreases. The advance can be traced to a 0.3-percent rise in prices for final demand goods less foods and energy. Conversely, the indexes for final demand energy and for final demand foods declined 0.3 percent and 0.2 percent, respectively.
Product detail:
An 8.4-percent increase in the index for carbon steel scrap was a major factor in the advance in prices for final demand goods. The indexes for meats, diesel fuel, fresh and dry vegetables, and oilseeds also moved higher.
In contrast, prices for liquefied petroleum gas fell 18.1 percent. The indexes for chicken eggs, processed poultry, and ethanol also decreased.
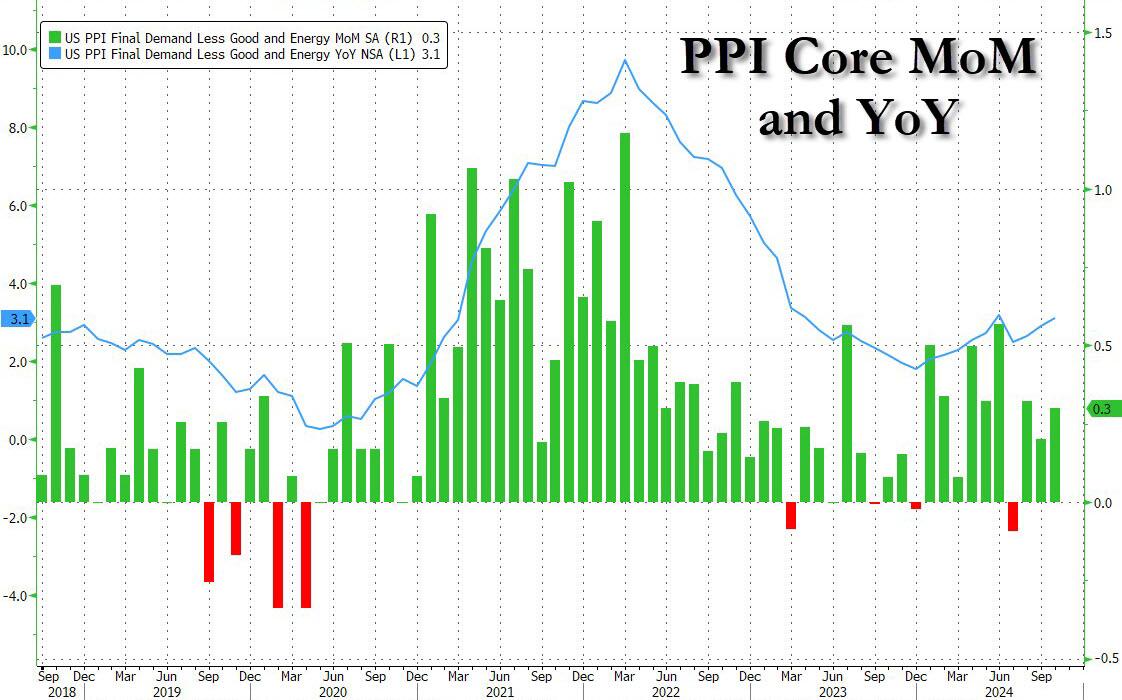
Even more problematic for the doves, however, is that core PPI jumped to +3.1% YoY (hotter than the 3.0% exp) with the prior month revised higher to 2.9% from 2.8%. This was the second hottest print going back to March 2023 with just the June outlier surge hotter than October…
… as sticky Services costs continue to rise.
The hotter than expected PPIs have pushed yields and the dollar higher, even as the market waits to see the details of what impact today’s numbers will have on the Fed’s preferred core PCE metric – according to UBS key PPI components to PCE look hot – although Bloomberg noted a big jump in air passenger services (3.2%), which suggests some upside risks (i.e., 0.3% core PCE).
The most notable takeaway from the data appears to be the increase in final demand for services in October, which is similar to the factors that increased CPI yesterday — shelter, food and energy, which are components the Fed cannot control with interest rates.
Bottom line: this is a long way from the Fed’s mandated 2%, and it’s moving in the wrong direction, something which has not been lost on the market, where Treasury curves are flattening after the data, which suggests traders are wavering over the prospects of a December rate cut. That has yet to be reflected in rates markets — bets have been trimmed but marginally, not enough to really change the swaps market outlook as of now. According to BBG’s Vince Cignarella, sizeable block trades are going through Treasuries, mostly in the five-year tenor and some ten-year tenors, which looks like positioning for higher yields and flatter curves.
Congress went wild spending on Covid relief and related wasteful spending. Notice that the impetus for job openings (spending) occurred before “Angry Joe” Biden and Commie-la Harris were sworn in. So, the job creation claims by Biden/Harris were put into motion before they assumed office.
The lag in job openings growth after the surge in spending is clearly visible in the following chart, as is the BURNOUT in job openings growth after Covid spending burned out.
Harris is promising explosive spending if elected. And she is promising MORE regulations! And the regulatory burden will grow.
Biden/Harris will be remembered for many things, mostly BAD. Uncontrolled immigration, crime out of control, endless wars, grossly incompetent government administrators, 200k+ missing immigrant children, etc. But wreckless inflation coming from insane government spending takes the cake. And it is heating up again, with the help of The Feral Reserve. Yes, The FERAL Reserve.
Under Biden/Harris, prices are WAY up, real weekly earnings are WAY down.
For the 52nd straight month, core consumer prices rose on a MoM basis in September (+0.3% MoM – hotter than the 0.2% expected) – the strongest since March. That left Core CPI YoY up 3.3%, hotter than the 3.2% expected…
Source: Bloomberg
The headline CPI also printed hotter than expected (+0.2% MoM vs +0.1% MoM exp), with the YoY CPI up 2.4% (hotter than the 2.3% expected but lowest since Feb 2021)…
Source: Bloomberg
Core Services and Food costs surged in September…
Source: Bloomberg
Overall, headline consumer prices are up over 20% (5.1% p.a.) since the Biden-Harris admin took over, which compares to around 8% (1.97% p.a) during Trump’s first term…
Source: Bloomberg
The so-called SuperCore CPI also increased on a YoY basis to +4.6%…
Source: Bloomberg
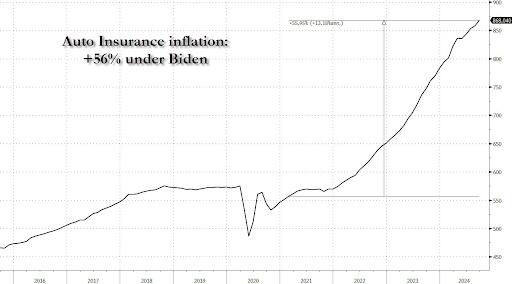
A surge in Transportation Services costs (record high auto insurance) and Medical Care Supplies lifted Super Core…
Source: Bloomberg
Why is the cost of auto insurance up 56% since Biden and Harris took over?
Source: Bloomberg
Real wages are down since the start of the Biden-Harris administration…
Source: Bloomberg
Finally, we note that money supply is resurgent once again, suggesting The Fed’s confidence in CPI’s decline may be misplaced…
Source: Bloomberg
Could we really replay the ’70s once again?
Source: Bloomberg
Will that really be Powell’s legacy? Or will the timing of this resurgence in inflation be perfectly timed to coincide with Trump’s election victory… and offer a perfect patsy for who is to blame?
Kamala Harris and Tim Walz have produced a destructive proposal to solve the inflation problem: price controls. Her biggest supporters like Elizabeth Warren and Ohio’s Sherrod Brown love the idea of meddling in the private sector,
But I would be symapatheic to their arguement if consumer prices soared more than producer prices. However, the truth is that prices paid by producers (PPI) SOARED far more than prices paid by consumers (CPI).
The cause? Federal goverment spending (green line) exploded with Covid. Harris/Walz are proposing massive spending under her administration hence there will be MORE inflation under Harris/Walz. So, the have to rely on flawed gimmics like price controls. Which will lead to shortage, food lines, rastioning, etc.
Market participants are expecting a 50 BPS cut tomorrow. From 5.50% to 4.913%.
This painting represents Washington DC where the deep state lingers in darkness.
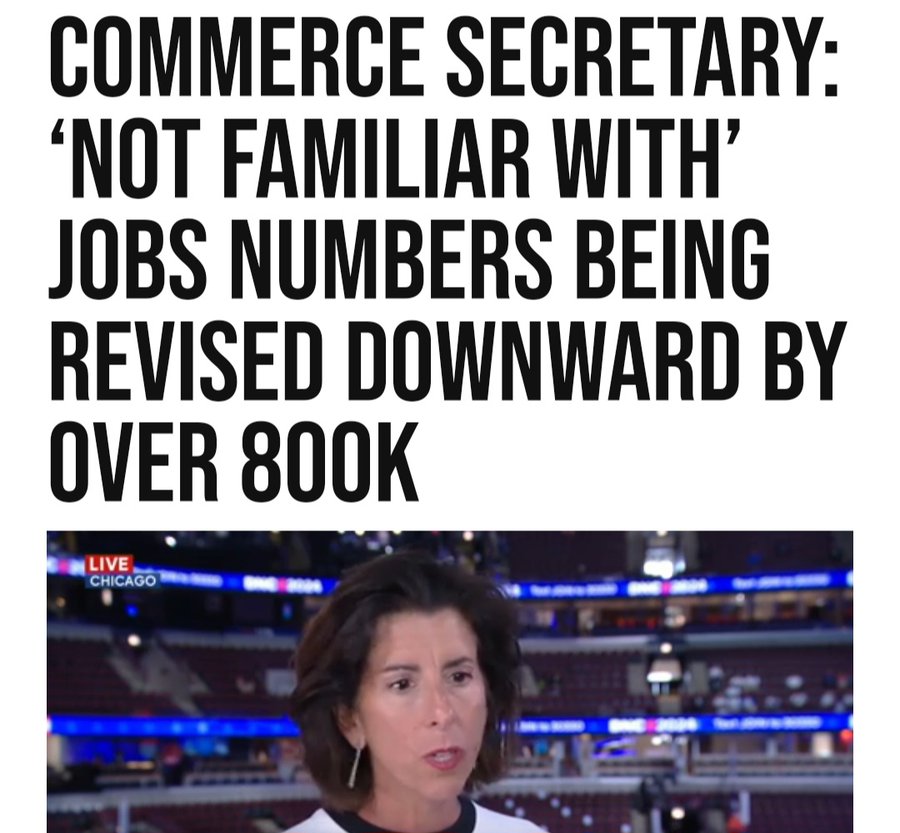
The scary thing about the BLS overstating job gains by Biden/Harris by almost 1 million jobs is that US Commerce Secretary Gina “The Goofball” Raimondo didn’t even know about the Philly Fed report.
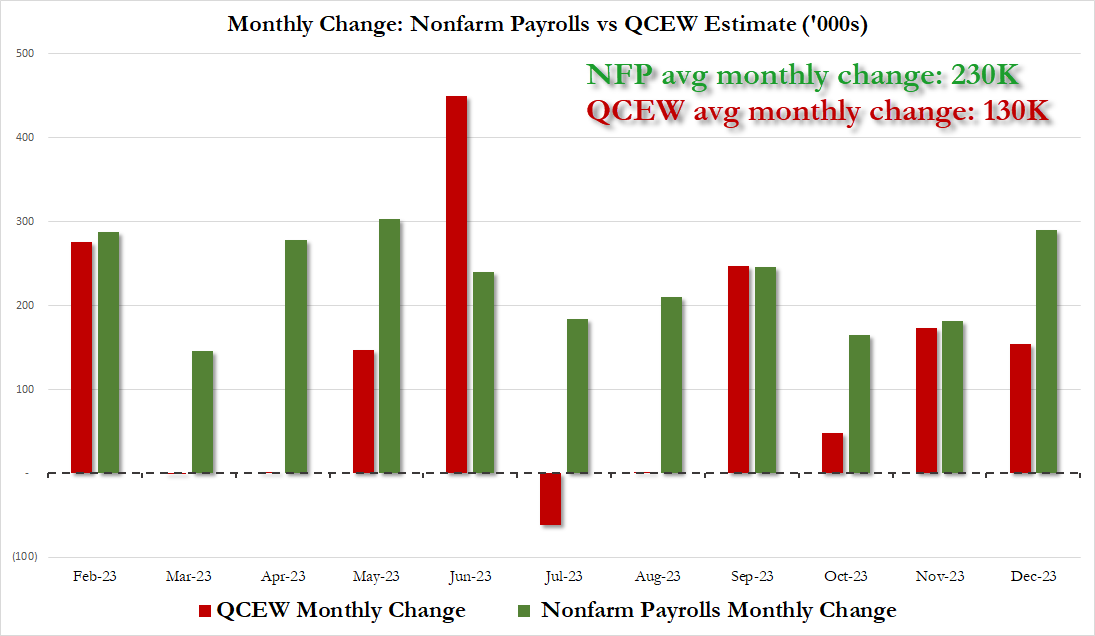
Back in March, when most of Wall Street and economists still believed the lies spewed forth by the Biden Bureau of Labor Statistics, which intentionally uses inaccurate, rushed “data” from the Establishment survey which is meant to pad sentiment and make the economy appear far stronger than it is for propaganda purposes (as one can see by the constant monthly downward revisions), we did an in-depth analysis looking at the actual, “uncooked” numbers published by the Philadelphia Fed preview of the annual Quarterly Census of Employment and Wages employment revision, and warned our readers that actual US payrolls are overstated by at least 800,000.
Specifically, we concluded that “the BLS had overstated payrolls by 800,000 through Dec 2023 (and more if one were to extend the data series into 2024)” and added that “it’s truly statistically remarkable how every time the data error is in favor of a stronger, if fake, economy.”
Furthermore, we also noted that the revision “also means that far from the stellar 230K average monthly increase in payrolls in 2023, which the White House would spin time and again as direct evidence of the benefits of Bidenomics, the true average monthly payroll increase in 2023 was only 130K! The full monthly change in payrolls as originally reported by the BLS (in green) and the actual monthly number, as per the QCEW (in red) is shown below.”
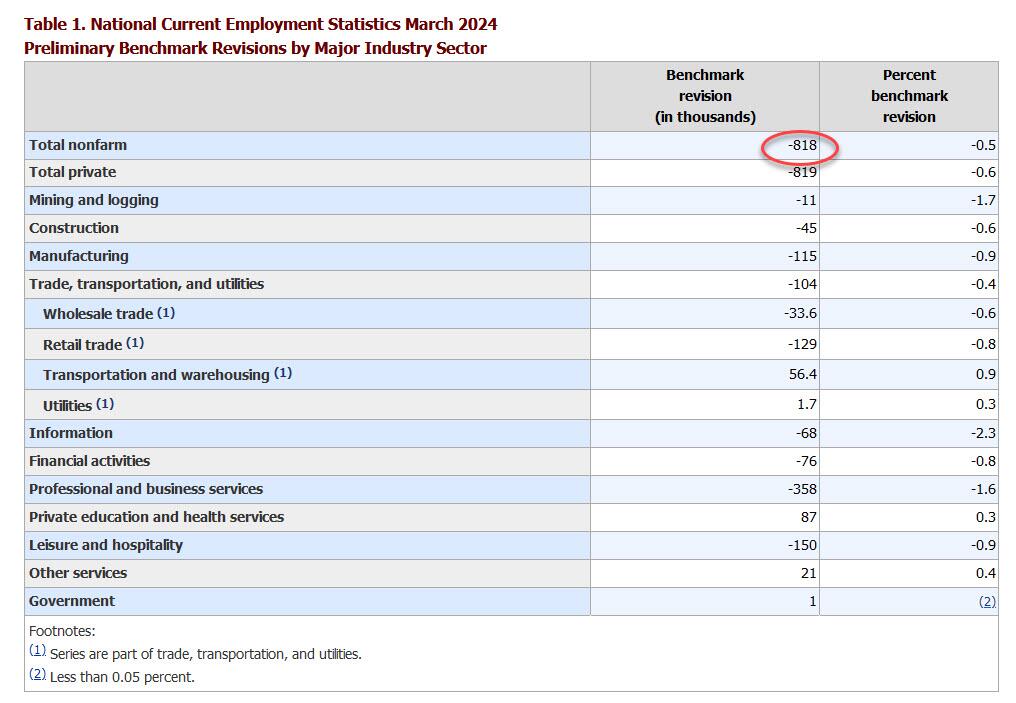
This matters because as we reminded our followers this weekend, today at 10am, the BLS would publish its annual nonfarm payrolls benchmark revision where it would unveil as , which it did (with the usual 35 minute delay because that’s the kind of service $35 trillion in debt buys you), and it confirmed that we were right almost to the dot, because as the BLS unveiled in its CES Preliminary Benchmark Announcement, “the preliminary estimate of the benchmark revision indicates an adjustment to March 2024 total nonfarm employment of -818,000 (-0.5 percent)” or just above the 800,000 was said to expect back in March.
The revision is mainly due to the highest-paying sectors: i.e., professional services -358k, leisure -150k, and manufacturing -115k. Not at all surprising: government was revised +1,000.
As an aside, while the data were scheduled to be released at 10 a.m. in Washington but didn’t appear on the BLS’s website for more than a half hour later. A spokesperson for the agency didn’t answer Bloomberg’s questions as to why the figures were delayed, but we have some pretty good guesses about the panic that gripped the BLS as they realized they needed a green lights from the propaganda ministry before going live with this number.
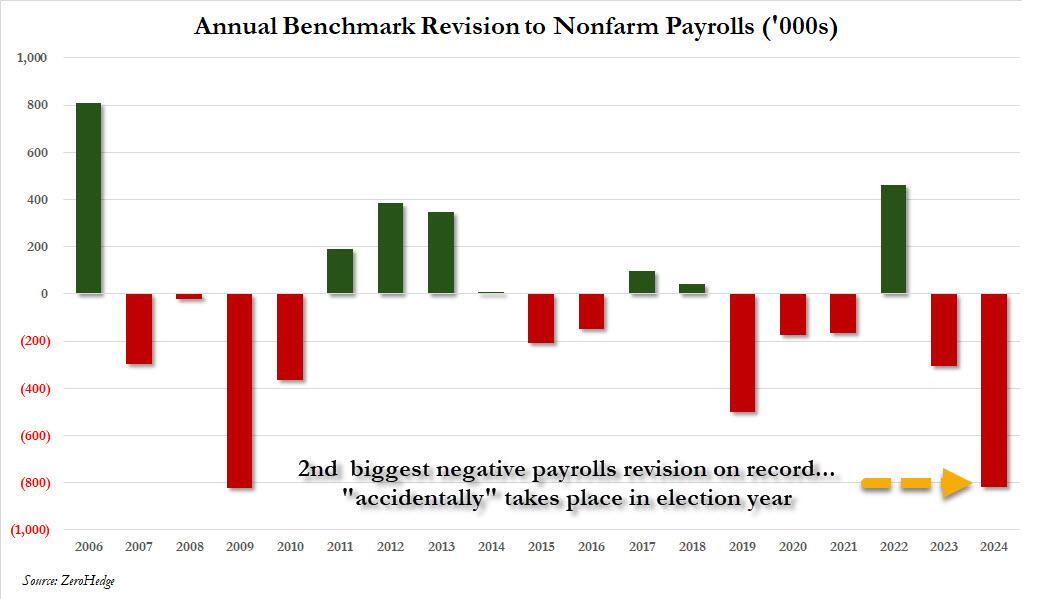
How big is the 818,000 revision in context? As the chart below shows, the 2024 revision was the biggest in the past decade, and the second biggest on record, with just the 824K downward revision in 2009 just (barely) greater.
The revisions confirm that – as we had been warning for much of the past year – the labor market started moderating much sooner than flawed conventional wisdom thought. It wasn’t until earlier this month that markets and economists grew concerned with the release of the July jobs report. That set off alarm bells with a weak pace of hiring and a fourth month of rising unemployment, but other metrics like jobless claims and vacancies have suggested a more moderate slowdown.
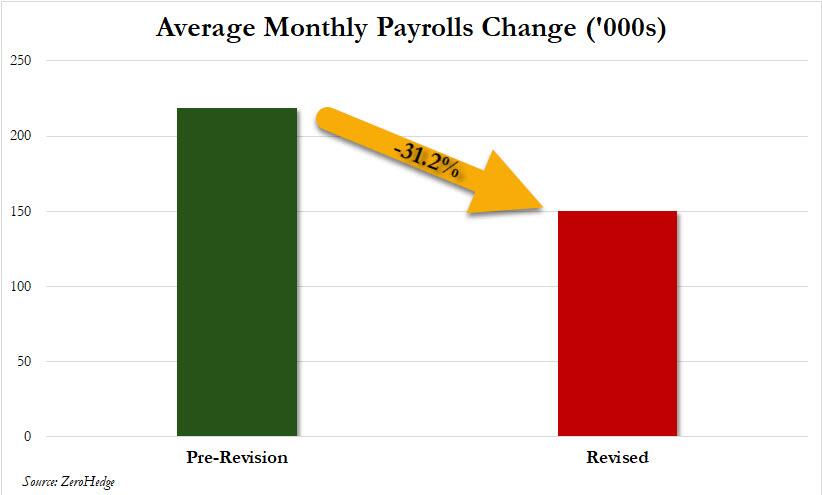
Putting it all together, we now know – as we reported first back in March – that the labor market is, and was, far weaker than conventionally believed. In fact, no less than 800,000 payrolls would end up “missing” when one uses the far more accurate Quarterly Census of Employment and Wages data rather than the BLS’ woefully inaccurate and politically mandated payrolls “data”, and if one looks back the the monthly gains across most of 2023, one gets not 218K jobs added on average every month but rather 150K, a 31% decline. Needless to say, the market would look very different if it had known that effectively all the payroll “beats” of the past year would be deleted!
Of course, none of that paints Bidenomics, or Kamalanomics, or whatever it is now, in a flattering picture, because while one can at least pretend that issuing $1 trillion in debt every 100 days to add 3 million jos per year is somewhat acceptable, learning that that ridiculous amount buys 800,000 jobs less is hardly the endorsement that the White House needs. On the flip side, pretending that the US had added an additional 800,000 jobs in the past year is precisely what Biden, and now, Kamala would have wanted to generate the kind of buzz and momentum that somehow translates into the “greatest economy ever”… at least until it is all revised away as the admin’s lies finally wash away.
What is the implication for the market? Well, as UBS trader Leo He correctly notes, “the Fed is well aware of nonfarm payrolls (establishment survey) overstating the job market, but unemployment rate (household survey) underestimating the job market” and he goes on to quote Governor Bowman’s speech on Tuesday:
“There are also risks that the labor market has not been as strong as the payroll data have been indicating, and it appears that the recent rise in unemployment may be exaggerating the degree of cooling in labor markets. The Q4 Quarterly Census of Employment and Wages (QCEW) report suggests that job gains have been consistently overstated in the establishment survey since March of last year, while the household survey unemployment data have become less accurate as response rates have appreciably declined since the pandemic. The rise in the unemployment rate this year largely reflects weaker hiring, as job searchers entering the labor force are taking longer to find work, and layoffs remain low. It is also likely that some temporary factors contributed to the soft July employment report. The rise in the unemployment rate in July was largely accounted for by workers who are experiencing a temporary layoff and are more likely to be rehired in coming months. Hurricane Beryl also likely contributed to weaker job gains, as the number of workers not working due to bad weather increased significantly last month.”
At the end of the day, all this does is cement the Fed’s 25bps rate cut next month.
As for broader socio-political implications, the reactions are already pouring in with those on the blue side of the spectrum pretending nothing happened, while those on the other side of the aisle raging at what has now become clear propaganda by the highly politicized Department of Labor. To wit, here is RFK, Jr., proposed VP candidate Nicole Shanahan slamming the BLS, and using our data to do so:
The Bureau of Labor Statistics (BLS) has long been used as a tool of propaganda by the executive branch. Here’s how: they distort definitions, manipulate data, exclude discouraged workers, and revise past reports to create narratives that fit the agenda of whichever administration is in power. This skews the actual economic picture and misleads citizens about the true state of our economy. It’s like a game of musical chairs, and neither side wants to be caught standing when the music stops. The Constitution doesn’t grant the government the authority to track unemployment statistics, so why do we even have this agency? Perhaps it’s time to get rid of it. Their $750M budget could surely be put to better use, and private companies already track U.S. unemployment for free. Win-win.
We agree: back in March we concluded our article, which predicted today’s revision with near 100% accuracy, by warning that the staggering size of the revised data “is also why nobody in the mainstream media – which is now nothing more than the PR smokescreen for the Biden puppetmasters, the government and the deep state – will ever mention this report.”
Today it will be more difficult for the propaganda press to ignore it.
At least she should speak in front of a Communist Chinese flag! Her true master.
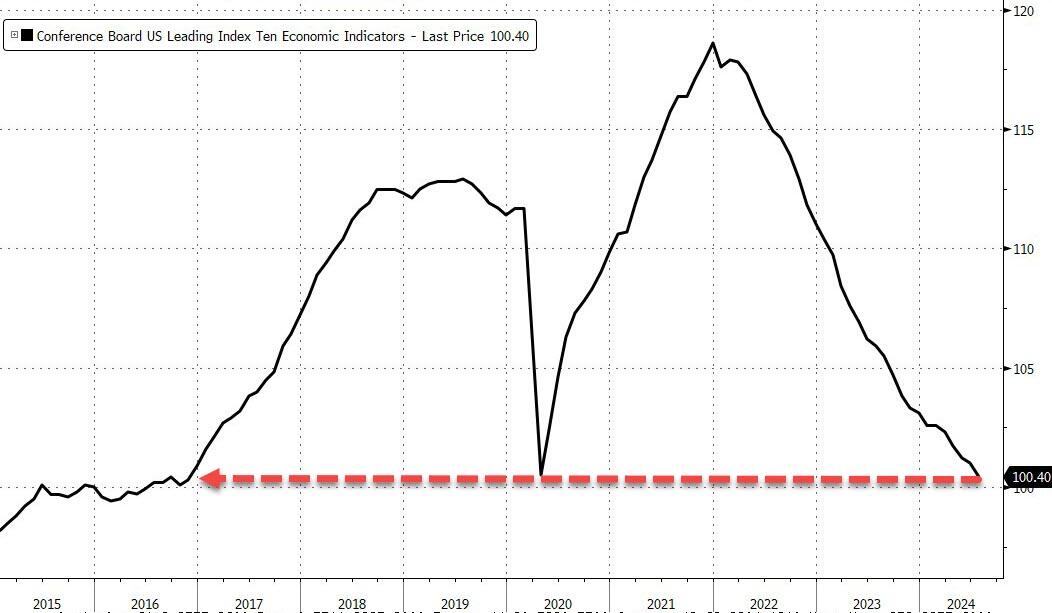
…and the head of The Conference Board says ‘nothing to see here’…
“The LEI continues to fall on a month-over-month basis, but the six-month annual growth rate no longer signals recession ahead,” said Justyna Zabinska-La Monica, Senior Manager, Business Cycle Indicators, at The Conference Board.
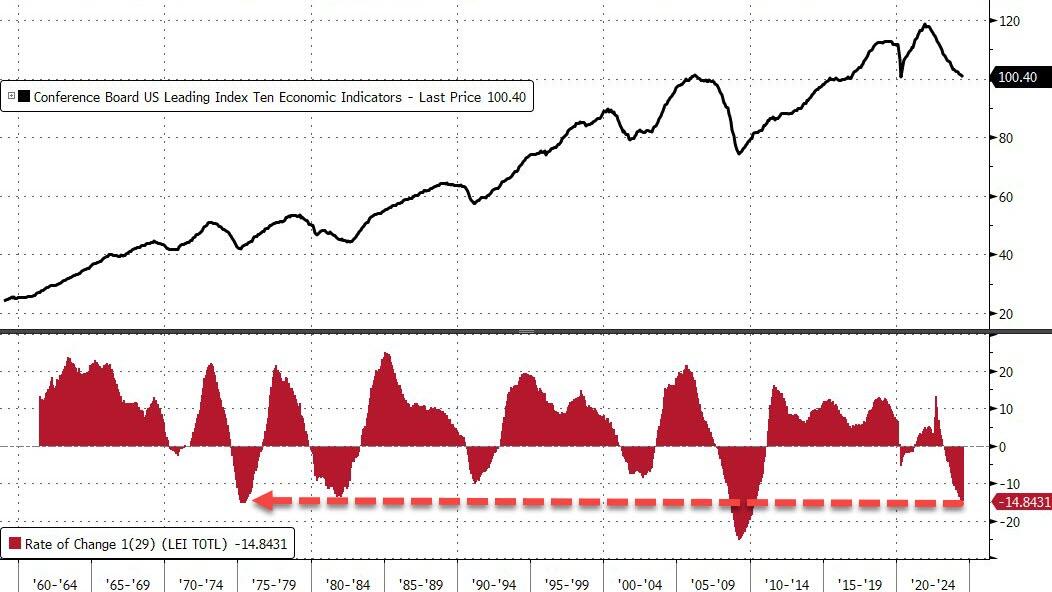
For context, outside of the great financial crisis, this is the worst decline in LEI since the mid ’70s!!!
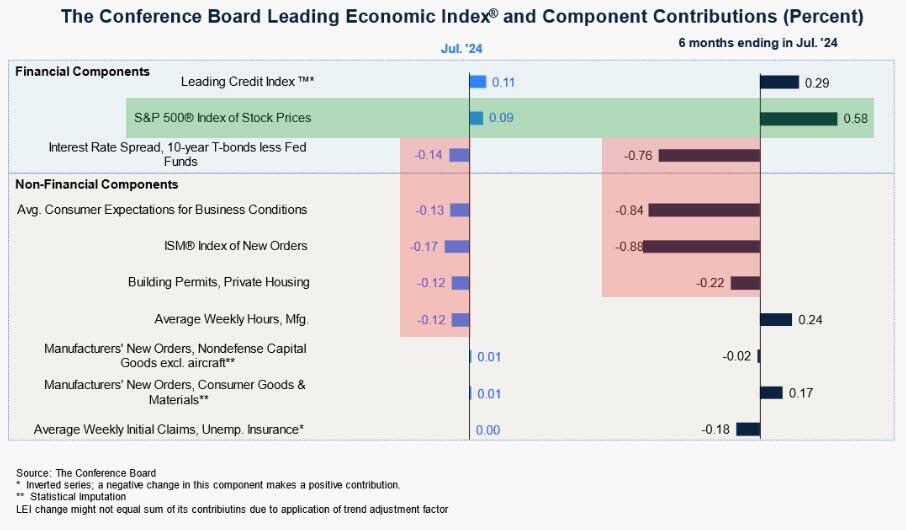
And what is behind the ‘no recession’ call… US equity strength!!
Thank The Feral Reserve for the equity spike!
So, to summarize – almost all the macro data signals weakening growth for years… but because stocks are up (and credit spreads down), there’s no recession anywhere on the horizon!!??


You must be logged in to post a comment.