The U.S. has already brought in nearly $73 billion in revenue from tariffs so far this year, compared to $77 billion in tariff revenue for the entirety of 2024. In Trump’s second term, tariff revenue is over $25 billion.
So much for the hysteria over a stock market crash and massive increase in inflation. Particularly “economists” who say this nonsense. Who are those guys?
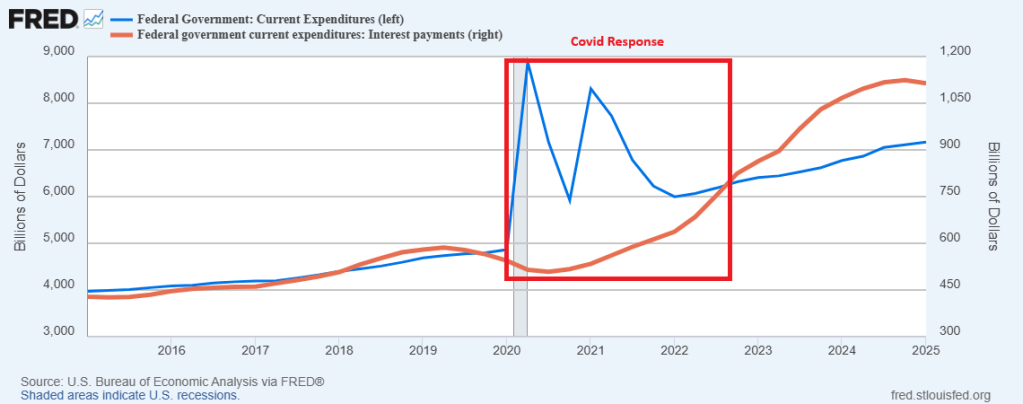
It’s Gov’t Gone Wild! That includes The House, Senate, President and Federal Reserve.
The purchasing power of the US Dollar was $1004.4 on 1915-03-01. By 2025-05-01, the purchasing power fell to $31.1, a loss of 97%. Public debt since the last year of GW Bush, Obama/Biden (with a brief hiatus with Trump) rose 317% since January 2009.
Finally, US government debt growth (YoY) was approximately equal to US nominal GDP growth in Q1 2025.
Unfortunately, the BBB (Big Beautiful Bill) is projected to add $3.9 trillion of debt. Unfortunately, there are insufficient spending cuts in the BBB. And the Senate just nixed kicking illegal immigrants off of Federal healthcare programs.
Unfortunately, GDP growth is only expected to be modest with debt growth once again rising faster than GDP growth. As Diane Feinstein once said, politicians are elected to spend money. This, of course, was a ridiculous statement embraced by spend-crazy Democrats and RINOs.
So, Congress has committed American taxpayers to debt slavery.
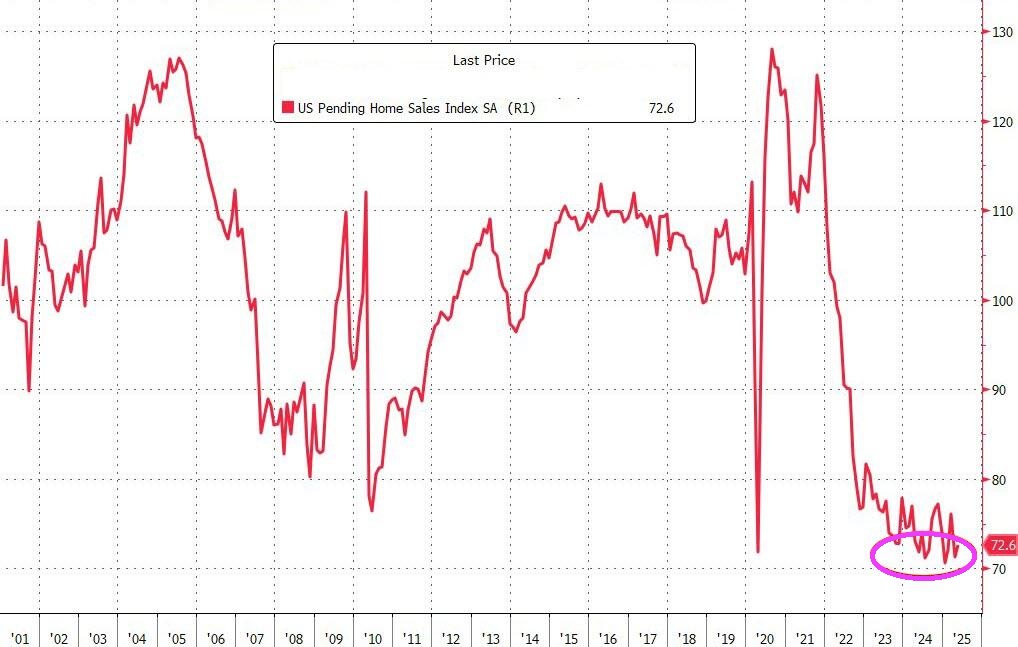
I sure hope this isn’t a repeat of the financial crisis! But new homes for sale have ballooned to financial crisis levels.
Home sales have dropped below year-ago levels, presaging likely declines in mortgage supply and turnover. With completed-home inventories hitting post-global financial crisis (GFC) highs, regional surpluses are emerging as key home-price factors, setting the stage for widening pockets of price weakness in the months ahead.
Contributing to the glut of new homes for sale is the rising prices AND higher mortgage rates.
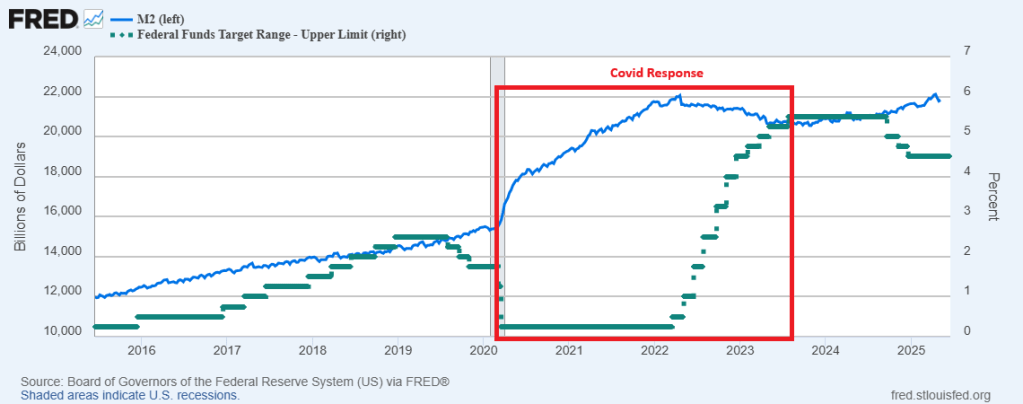
The Fed continues printing money! And home prices continue to rise on year-over-year basis, but falling on a month-over-month basis.
Home prices in April tumbled 0.31% MoM (-0.02% exp) – the biggest MoM drop since Dec 2022.
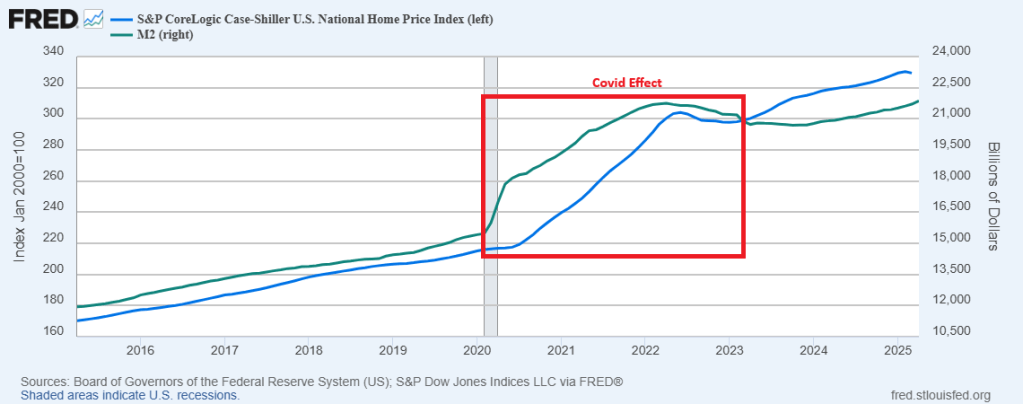
But if we look at the national home prices via S&P Case-Shiller and YoY rather than MoM, home prices ROSE 2.64% YoY.
You can see the damage to homeownership caused by Covid and The Fed. The massive expansion of M2 Money in 2020 was followed shortly by rapid increases in home prices. This was followed by a normalization in Fed M2 Money printing. Consequently, home price growth has slowed.
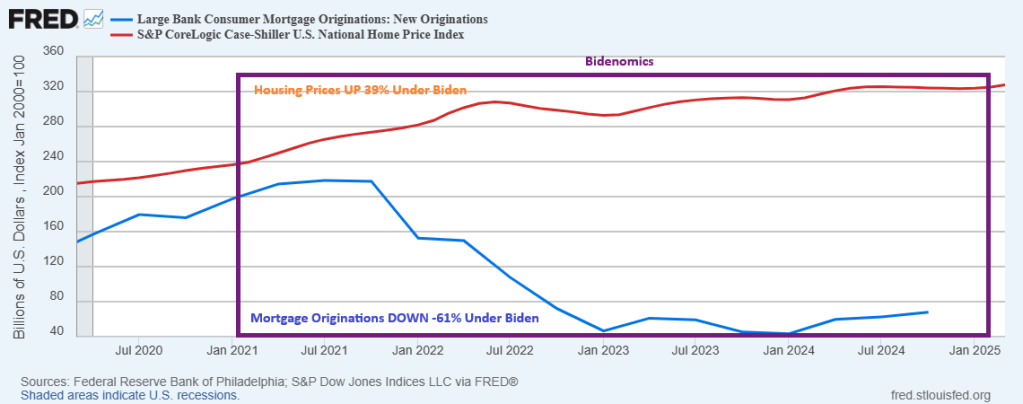
All aboard! The crazy mortgage train! Home prices rose 39% under Biden while mortgage originations at large banks fell -61%. The mortgage market is still recovering from Bidenomics!
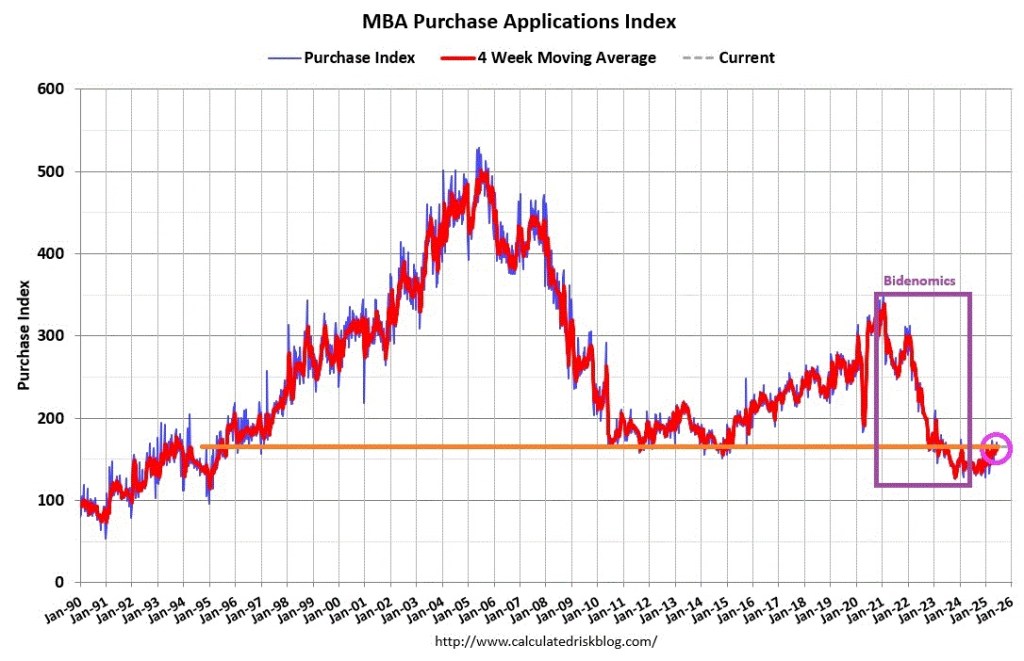
Mortgage applications decreased 2.6 percent from one week earlier, according to data from the Mortgage Bankers Association’s (MBA) Weekly Mortgage Applications Survey for the week ending June 13, 2025.
The Market Composite Index, a measure of mortgage loan application volume, decreased 2.6 percent on a seasonally adjusted basis from one week earlier. On an unadjusted basis, the Index decreased 4 percent compared with the previous week. The seasonally adjusted Purchase Index decreased 3 percent from one week earlier. The unadjusted Purchase Index decreased 5 percent compared with the previous week and was 14 percent higher than the same week one year ago.
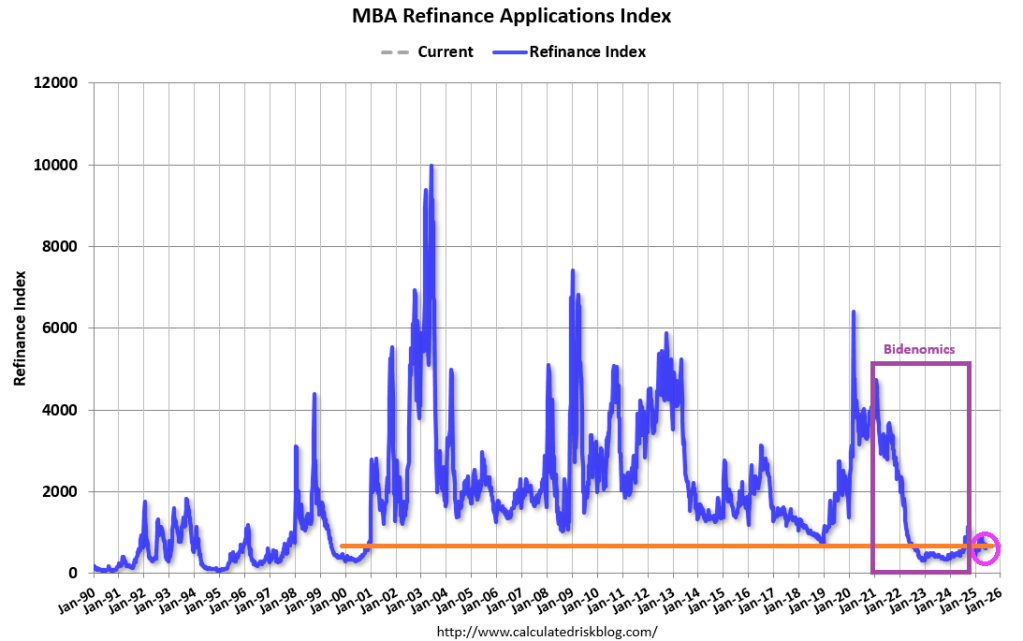
The Refinance Index decreased 2 percent from the previous week and was 25 percent higher than the same week one year ago.
Home prices rose 39% under Biden while mortgage originations at large banks fell -61%.
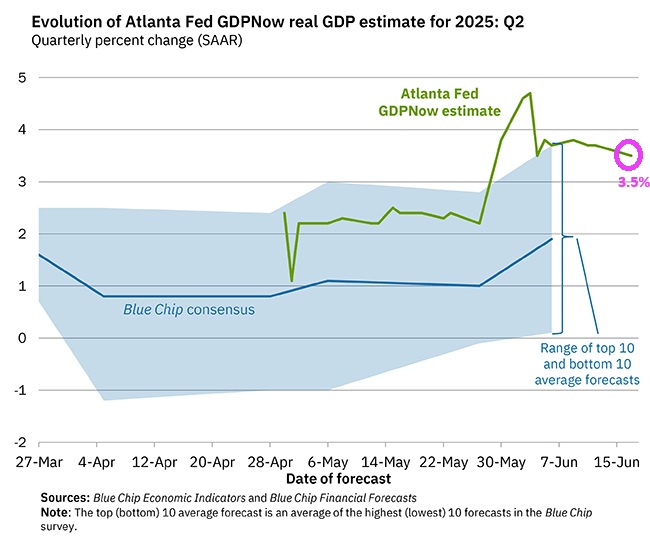
The GDPNow model estimate for real GDP growth (seasonally adjusted annual rate) in the second quarter of 2025 is 3.5 percent on June 17, down from 3.8 percent on June 9. After recent releases from the US Census Bureau, the US Bureau of Labor Statistics, the Federal Reserve Board of Governors, and the Treasury’s Bureau of the Fiscal Service, the nowcasts of second-quarter real personal consumption expenditures growth and second-quarter real government expenditures growth decreased from 2.5 percent and 2.3 percent, respectively, to 1.9 percent and 2.1 percent, while the nowcast of second-quarter real gross private domestic investment growth increased from -1.9 percent to -1.4 percent.
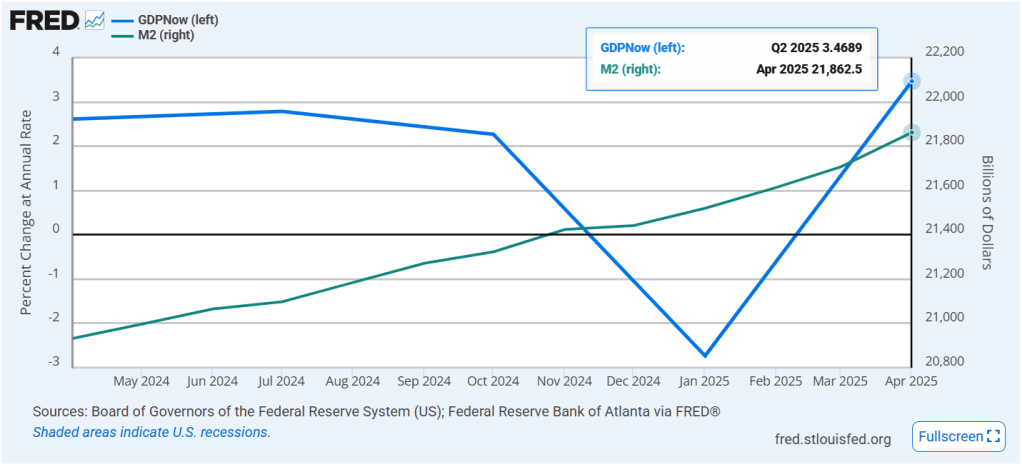
GDP growth corresponds to Fed money printing.
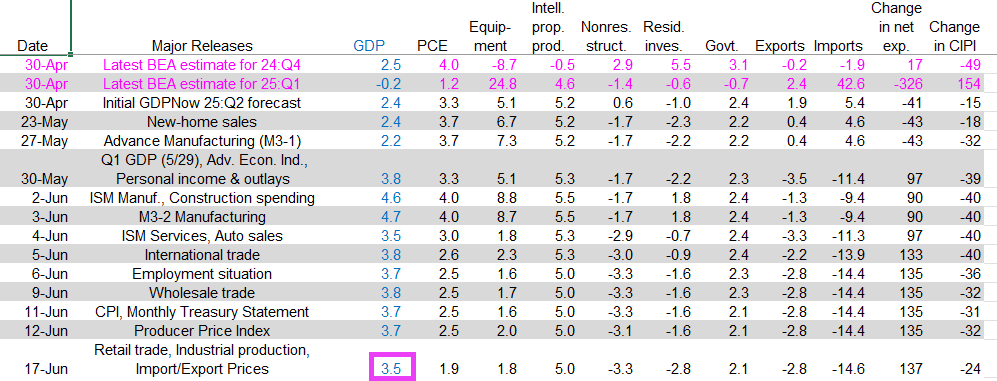
Here is the breakdown. True, real GDP growth has been slowing over June.
Thanks a lot Fed! Home prices rose dramatically after Covid as The Fed printed billions of dollar of currency (M2). Making housing unaffordable for much of America.
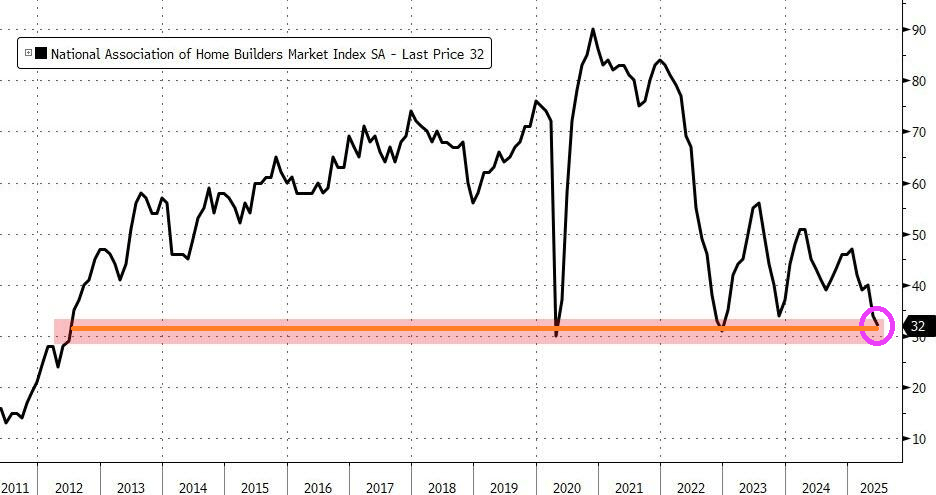
As a result of higher mortgage rates and higher home prices, homebuilder confidence is at a 13 year low (back to 2012).


You must be logged in to post a comment.