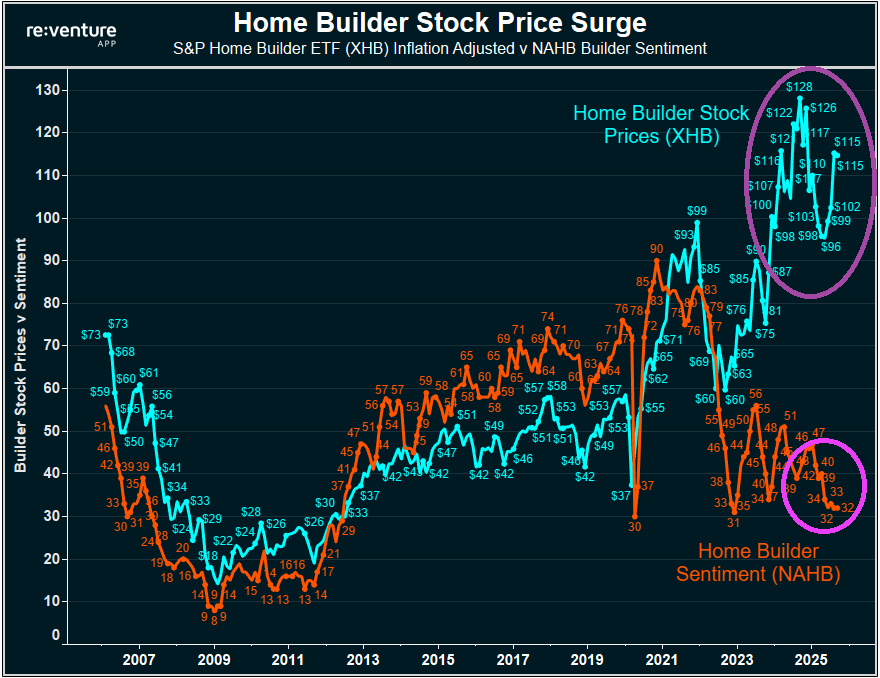
Home builder stock prices have surged, while home builder sentiment has plunged.
Of course, The Fed’s endless money printing isn’t helping the supply side of home building.
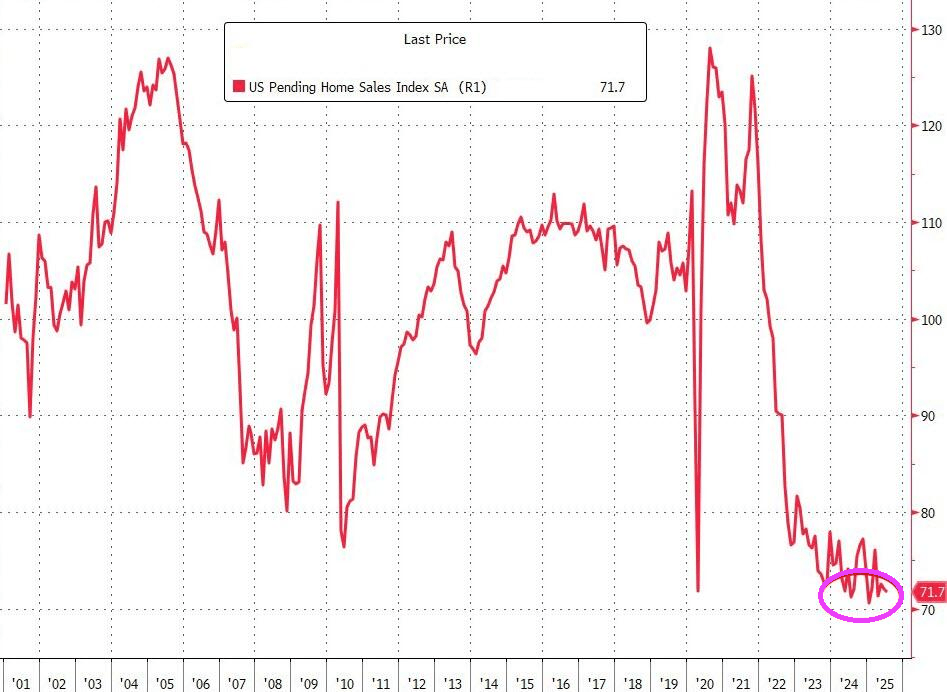
To make matters worse, pending home sales remain in the doldrums.
Federal Reserve Board member Lisa Cook is an embarrasment for committing mortgage fraud, then refusing to step down. And now she has filed a lawsuit against the Trump Administration for wrongful termination. Typical of an Obama appointee!
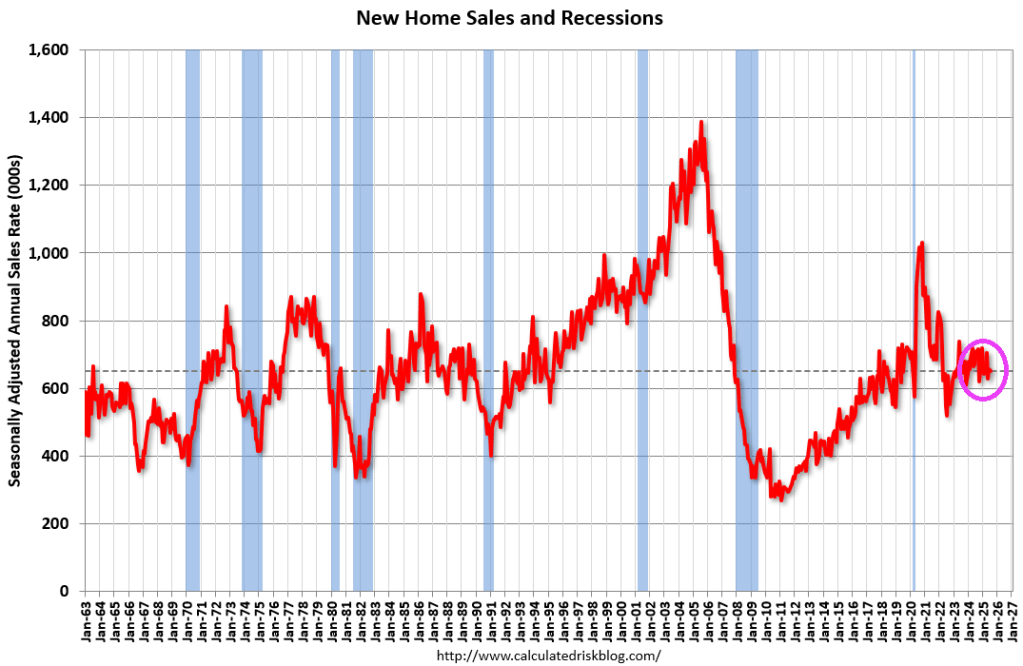
According to the US Census Bureau, New Home Sales of new single-family houses in July 2025 were at a seasonally-adjusted annual rate of 652,000, according to estimates released jointly today by the U.S. Census Bureau and the Department of Housing and Urban Development. This is 0.6 percent (±15.5 percent)* below the June 2025 rate of 656,000, and is 8.2 percent (±14.0 percent)* below the July 2024 rate of 710,000.
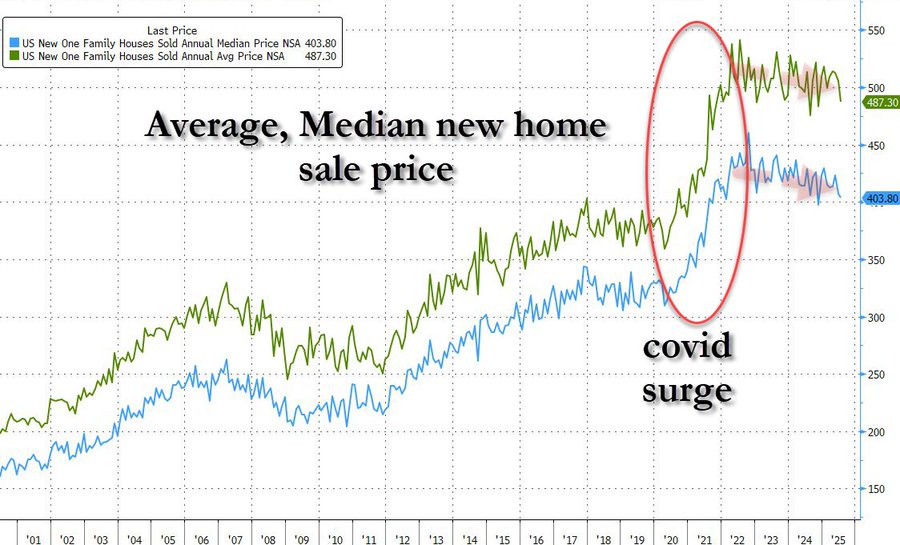
Median and Average Sales Price
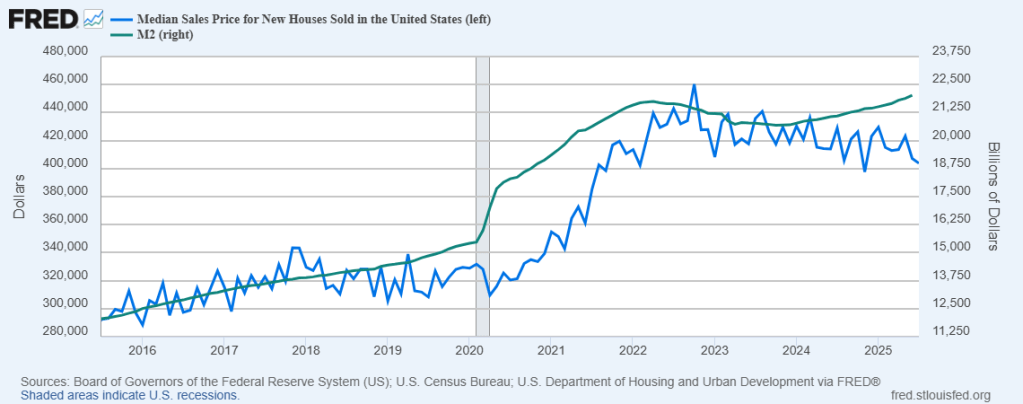
The median sales price of new houses sold in July 2025 was $403,800. This is 0.8 percent (±5.9 percent)* below the June 2025 price of $407,200, and is 5.9 percent (±8.5 percent)* below the July 2024 price of $429,000. The average sales price of new houses sold in July 2025 was $487,300. This is 3.6 percent (±8.0 percent)* below the June 2025 price of $505,300, and is 5.0 percent (±8.6 percent)* below the July 2024 price of $513,200.
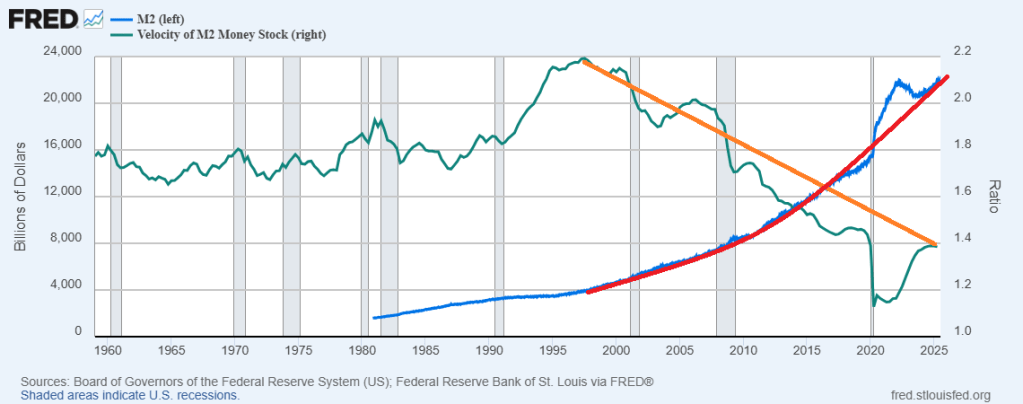
Here is a chart of median sales price of new homes against Fed money printing (M2).
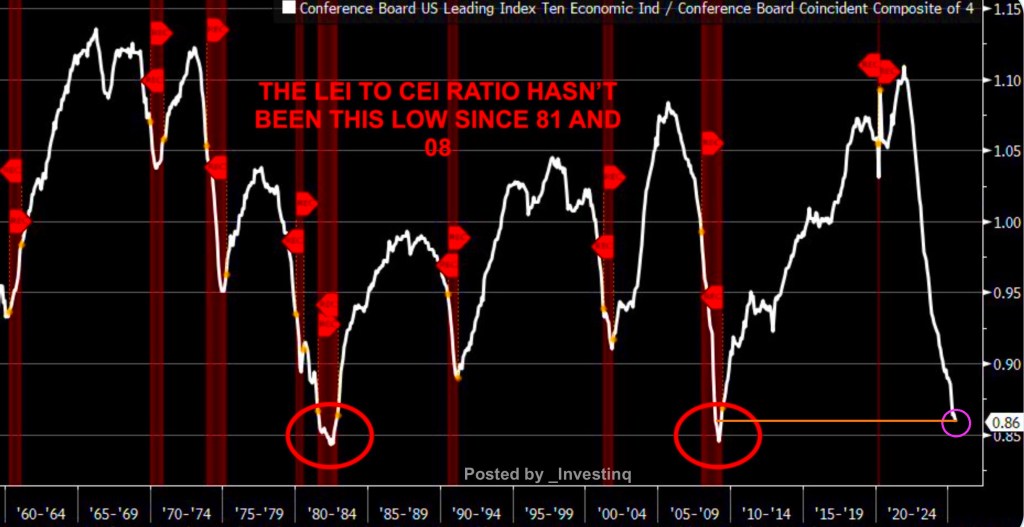
The Fed will have to whip it good with rate cuts if the recession warnings are an indicator of what lies ahead for the US economy.
The ratio of The Conference Board’s Leading Economic Indicators (LEI) vs. The Conference Board’s Coincident Economic Index (CEI) ratio hasn’t been this low since 2008.
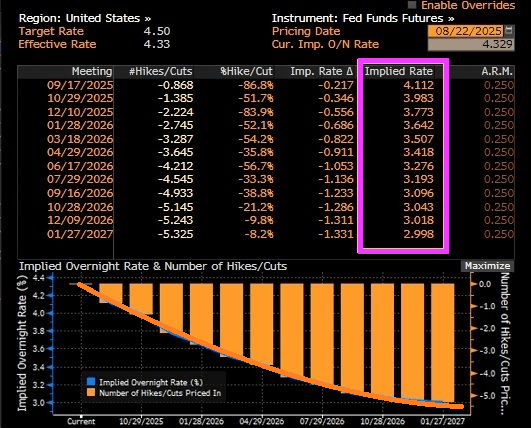
Fed Funds Futures are signalling rate cuts at the September 17th FOMC meeting and December 10th meetings.
Month-over-month sales increased in the Northeast, South, and West, and fell in the Midwest. Year-over-year, sales rose in the South, Northeast, and Midwest, and fell in the West.
• 2.0% increase in existing-home sales – seasonally adjusted annual rate of 4.01 million in July.
• Year-over-year: 0.8% increase in existing-home sales
Median existing-home price for all housing types, up 0.2% from one year ago ($421,400) – the 25th consecutive month of year-over-year price increases.
It will be hard to make housing more affordable as long as The Fed keeps printing money.
Powell et al cutting rates 25 basis points won’t really matter as long as they continue to print money. Unfortunately, M2 VELOCITY peaked under the Clinton Administration and has declined since despite frantic money printing.
What happended in 1995? Clinton’s National Homeownership Strategy that mandated HUD partners (GNMA, FHA, Fannie Mae, Freddie Mac, banks, etc.) to lower credit standards to encourage homeownership.
We need FHFA Director Bill Pulte to avoid doing what Democrats love (everything free or cheap).
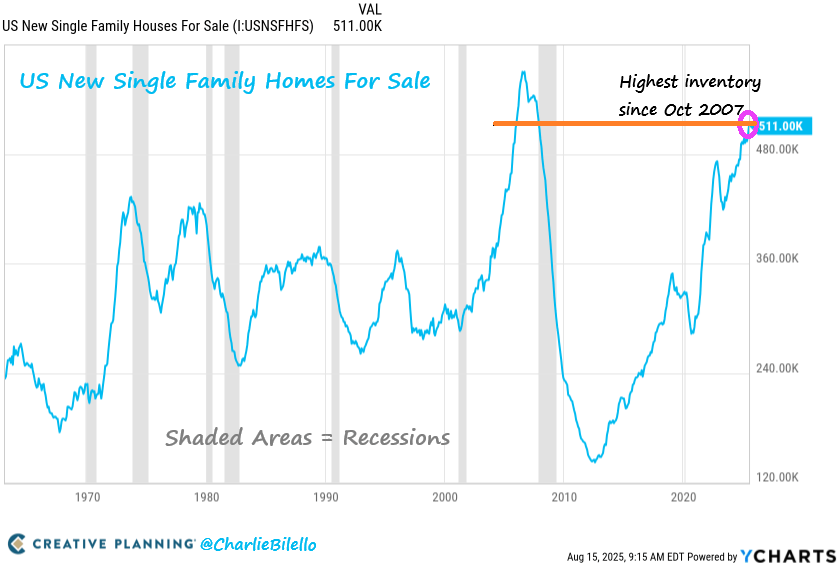
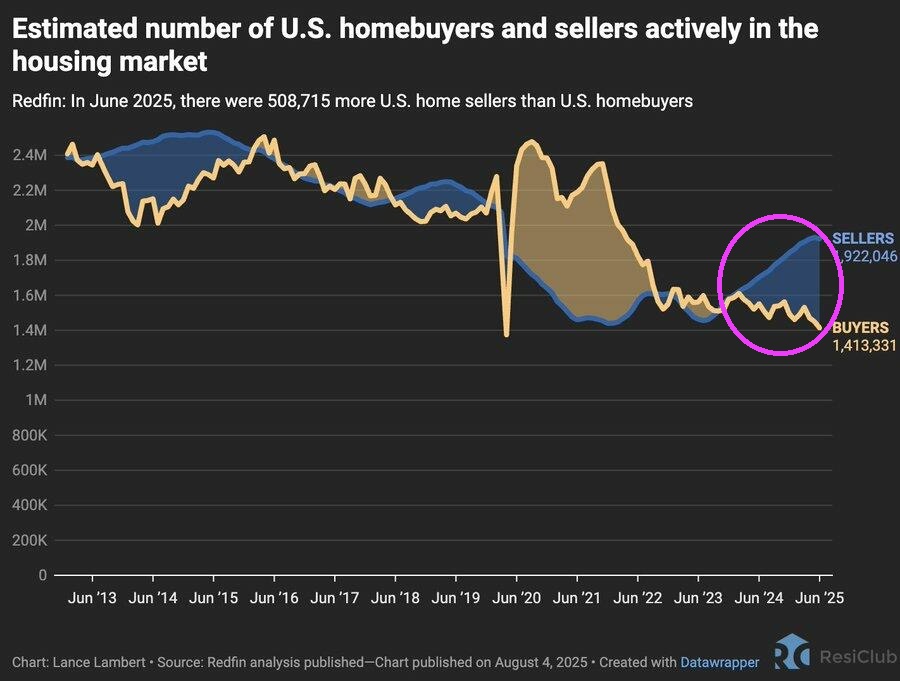
The US housing market is a changeling, going from a mega glut during the financial crisis to a tight market, then back to a glut … again. In fact, there are 511,000 new homes for sales in the US, the highest inventory since the financial crisis.
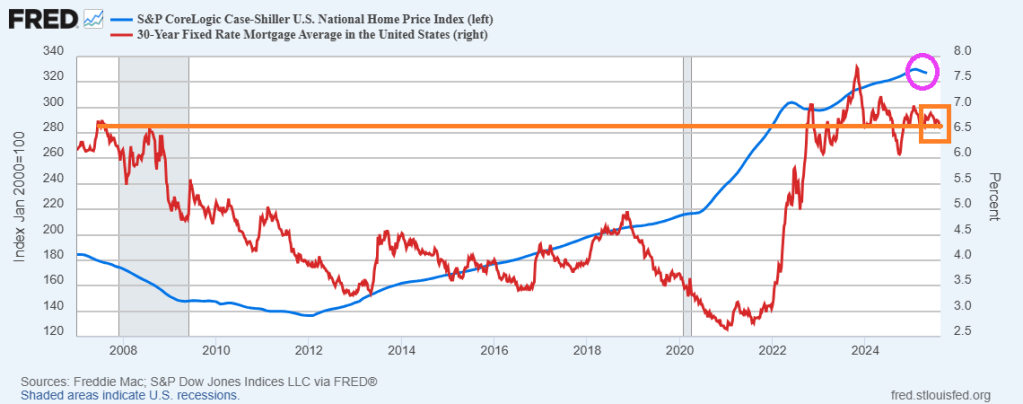
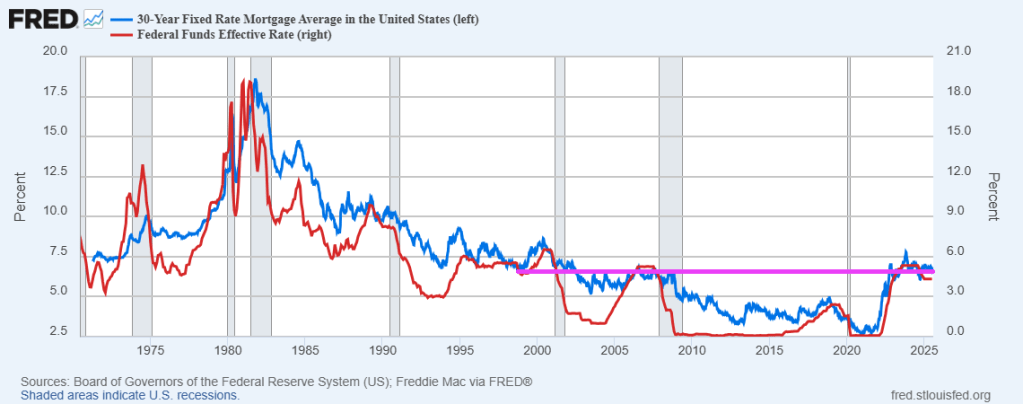
Combine all-time high home prices with RELATIVELY high mortgages, and we have an affordability crisis once again.
While we have the most new homes for sales since 2007, mortgage rates are about the same as in 2007 (orange line). But home prices are 87.5% higher today than in 2007!
When government gets involved, what could go wrong?
The Fed didn’t try, but mortgage rates fell and mortgage applications rose 10.9% week-over-week.
Mortgage applications increased 10.9 percent from one week earlier, according to data from the Mortgage Bankers Association’s (MBA) Weekly Mortgage Applications Survey for the week ending August 8, 2025.
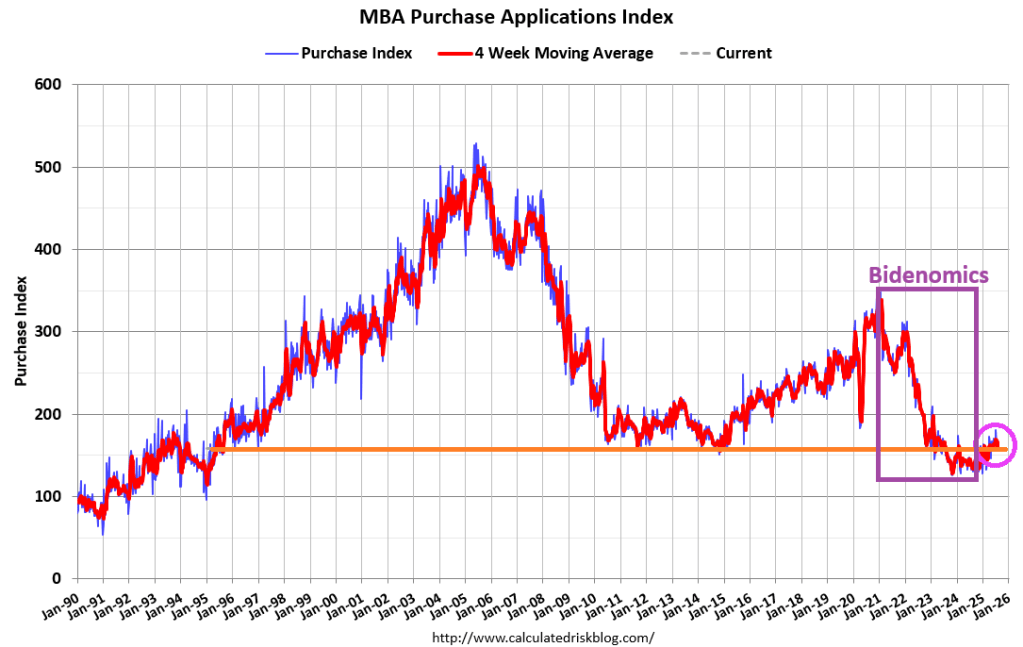
The Market Composite Index, a measure of mortgage loan application volume, increased 10.9 percent on a seasonally adjusted basis from one week earlier. On an unadjusted basis, the Index increased 10 percent compared with the previous week. The seasonally adjusted Purchase Index increased 1 percent from one week earlier. The unadjusted Purchase Index increased 1 percent compared with the previous week and was 17 percent higher than the same week one year ago.
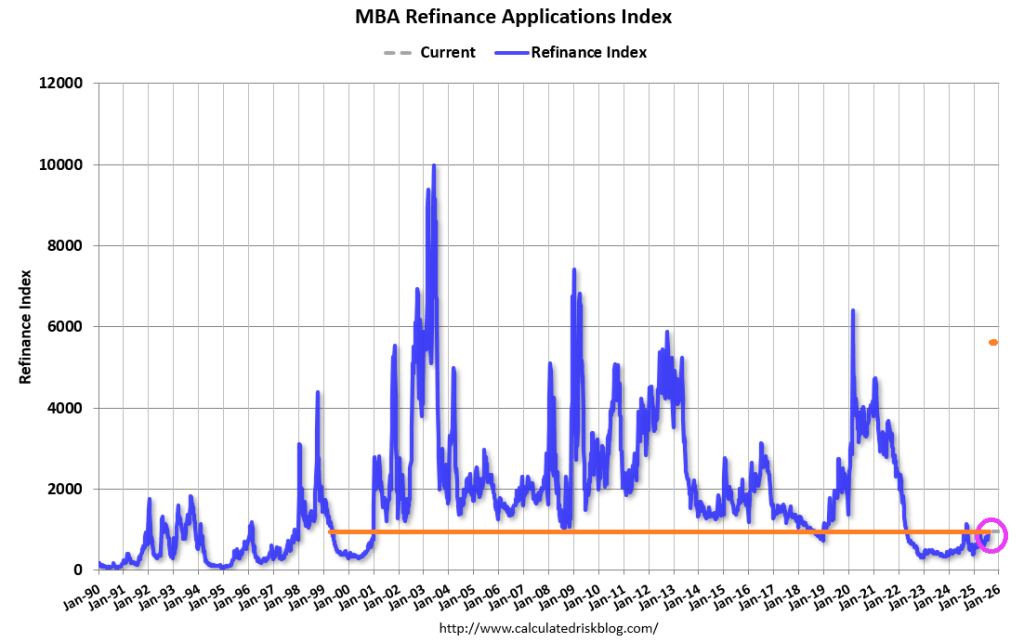
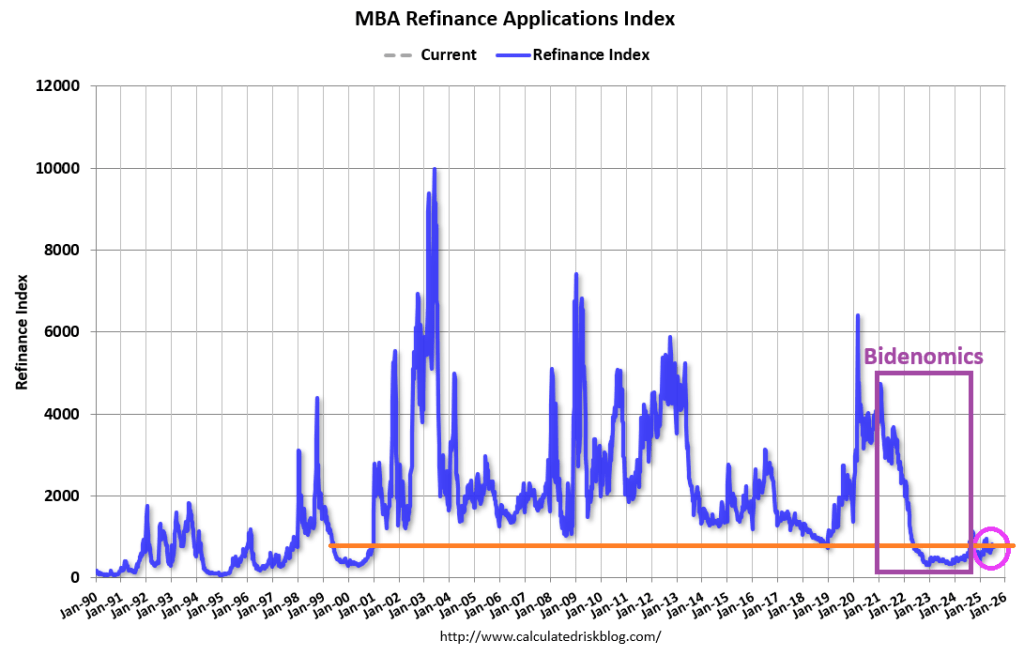
The Refinance Index increased 23 percent from the previous week and was 8 percent higher than the same week one year ago.
The 30-year fixed mortgage rate declined to 6.67 percent last week,which spurred the strongest week for refinance activity since April. Borrowers responded favorably, as refinance applications increased 23 percent, driven mostly by conventional and VA applications. Refinances accounted for 46.5 percent of applications and as seen in other recent refinance bursts, the average loan size grew significantly to $366,400. Borrowers with larger loan sizes continue to be more sensitive to rate movements.
They can’t accuse Fed Chair Jerome Powell of trying too hard to help Donald Trump. Mortgage rates moved lower last week, following declining Treasury yields as economic data releases signaled a weakening U.S. economy. As a result, the 30-year fixed rate decreased for the third straight week to 6.77 percent. As a result …
The Market Composite Index, a measure of mortgage loan application volume, increased 3.1 percent on a seasonally adjusted basis from one week earlier. On an unadjusted basis, the Index increased 3 percent compared with the previous week. The seasonally adjusted Purchase Index increased 2 percent from one week earlier. The unadjusted Purchase Index increased 1 percent compared with the previous week and was 18 percent higher than the same week one year ago.
The Refinance Index increased 5 percent from the previous week and was 18 percent higher than the same week one year ago.
And the number of sellers in the housing market is greatly outweighing the number of buyers.
Mortgage and housing economists should breathe a sigh of relief that Bidenomics is over, but I doubt it they will.
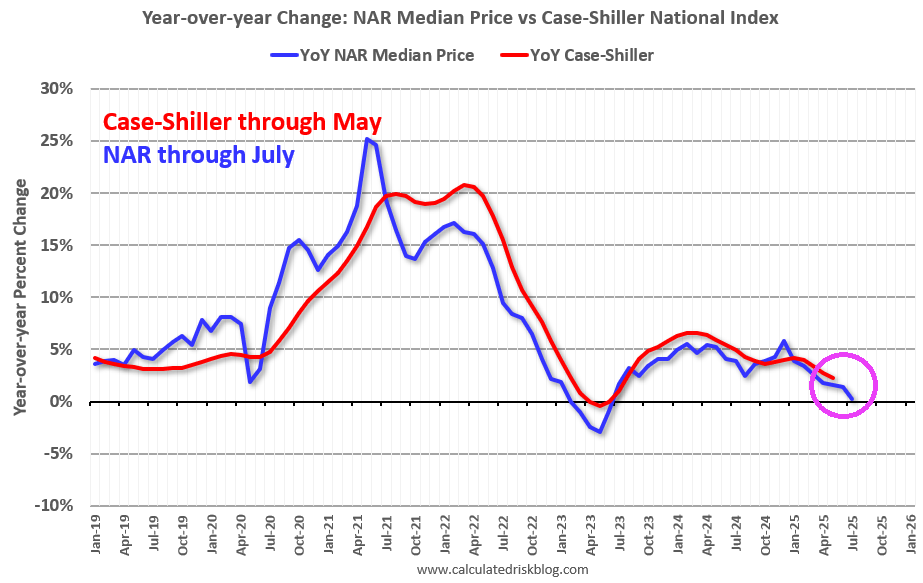
The US housing market is finally slowing down in terms of price growth. But this is after 3 Federal government-fueled house price bubbles.
In addition to record-high housing prices, mortgage rates are higher than levels going back to 2006.
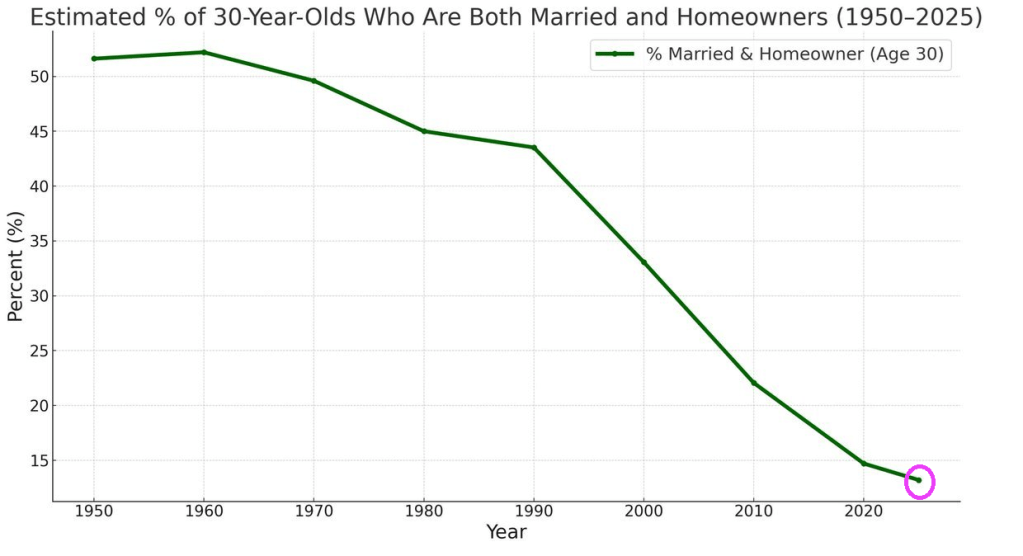
Throw in the “woke” movement, and we have a problem. The percentage of 30-year-olds who are both married and homeowners has plummeted to the lowest level since 1950.
Simply lowering interest rates won’t fix this problem. Much of the housing “crisis” is due to local and state level politicians and their restrictive housing policies. Like LA Mayor Karen “Venceremos Brigade” Bass allocating the burnt-down Pacific Palisades area on the Pacific Ocean to “affordable housing.”
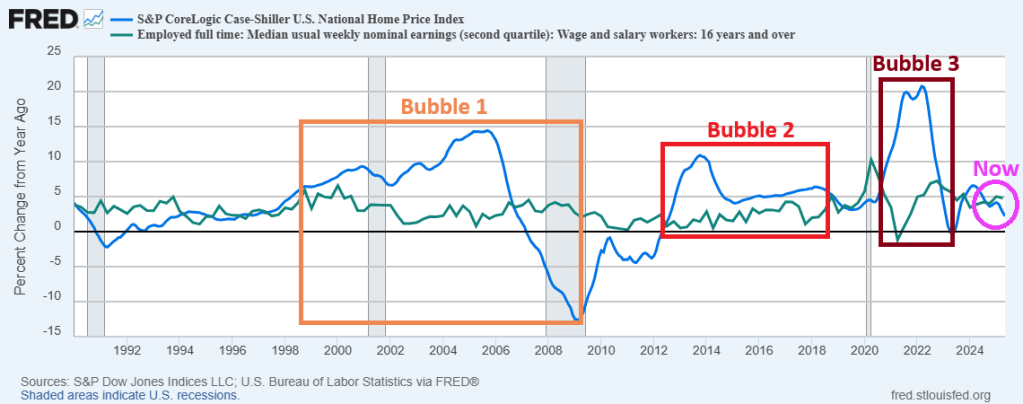
Yes, the US housing market is in a price bubble. If we compared home price growth with median earnings.
The financial crisis was spawned by a home price bubble where home price growth was faster than median earnings growth (see Bubble 1). After home price growth cooled in 2007-2009, the cycle started again (Bubble 2). But the current bubble (Bubble 3) is related to the Covid outbreak and massive spending binge by Congress (and The Fed). Notice that median earnings dropped (green line) post Covid.
But while we have normalized home price growth and median earnings, the LEVELS are still unaffordable for millions of households.
Poor Bill Pulte (FHFA Director). He has to work with an uncooperative Fed under Foul Powell, and local politivcians like Greasy Gavin Newsom (Democrat Gov of California), JB Pritzker (Democrat Gov on Illinois), Kathy Hocul (Democrat Gov of New York), and the assorted lunatic Mayors like Karen Bass (D, Mayor Los Angeles), Zohran Kwame Mamdani (D, presumptive Mayor New York City), etc.


You must be logged in to post a comment.