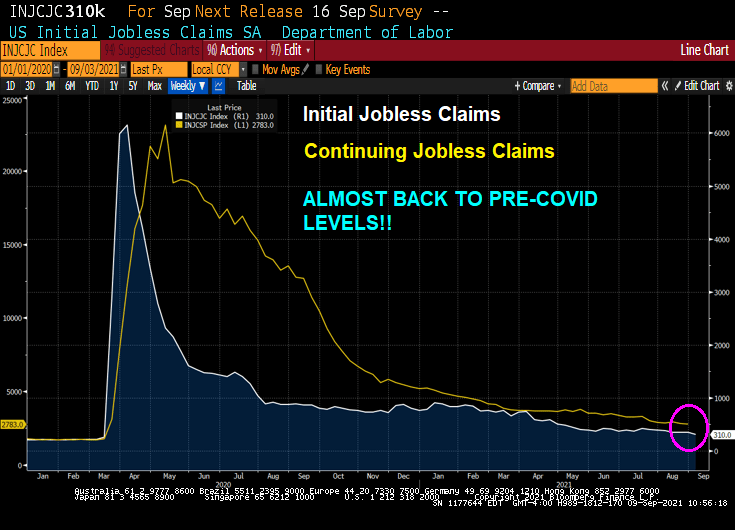
Initial jobless claims dropped below their recent range last week, falling to the second lowest level since the COVID-lockdowns crushed the economy. Only 326k Americans filed for jobless benefits for the first time last week, down from 364k last week and below the 348k expectation.
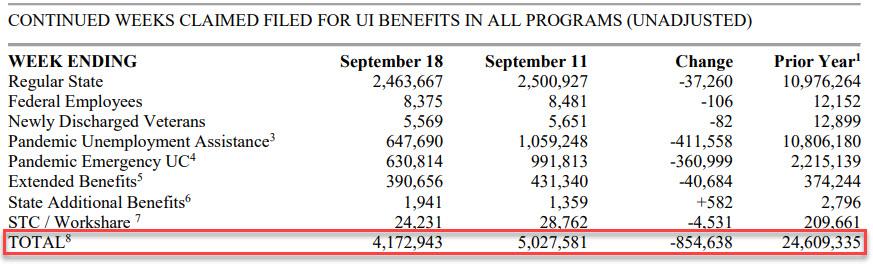
Continuing claims also declined from the previous week, again largely from Pandemic Unemployment Assistance and Pandemic Emergency Claims programs ending.
On a related note, Challenger job cuts were down -84.9% YoY. But for September, there was a surge in low-paying retail jobs and transportation jobs as Panademic stimulus ran out and governments have pretty much stopped their destructive government shutdowns of economies.
Central banks are turning “hawkish” in the face of inflation.
(Bloomberg) — Treasuries fell, sending 10-year yields to a three-month high, as traders braced for a testing week of heavy bond auctions and continued to digest the prospect that central banks in the U.S. and Europe will step up the pace of policy tightening.
The yield on 10-year Treasuries reached 1.51%, the highest since June, before settling at 1.48%. The yield has climbed 16 basis points over the past week as the Federal Reserve signaled it may start reducing its asset purchases in November and raising rates as soon as next year. Yields on two- and five-year Treasuries hit their highest levels since early 2020, with a combined $121 billion of the securities set to be sold Monday. A seven-year auction is due Tuesday.
While Treasuries briefly extended the selloff after a report showed durable goods orders exceeded economists’ forecasts, they started to pare losses after U.S. equity futures soured.
Bond yields increased across the globe last week as central banks move to reduce pandemic stimulus. The Bank of England surprised markets by raising the prospect of increasing rates as soon as November, and Norway delivered the first post-crisis hike among Group-of-10 countries. In the U.S., traders pulled forward wagers on an interest-rate increase to the end of 2022 following last week’s Fed meeting.
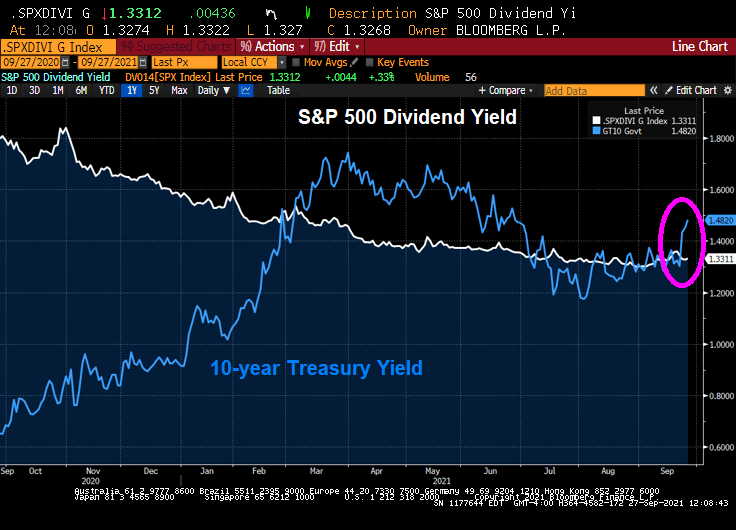
On the equity side, FAANG stocks trail the S&P 500 as 10-year Treasury yield climb.
We have the 10-year Treasury yield climbing above the S&P 500 dividend yield.
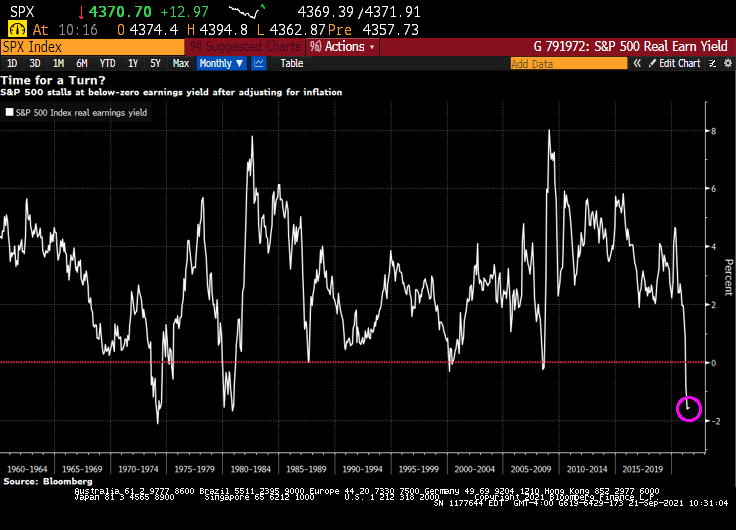
The stock market mildly rebounded from yesterday’s mild correction, but a glaring problem remains: S&P 500 real earning yields are negative.
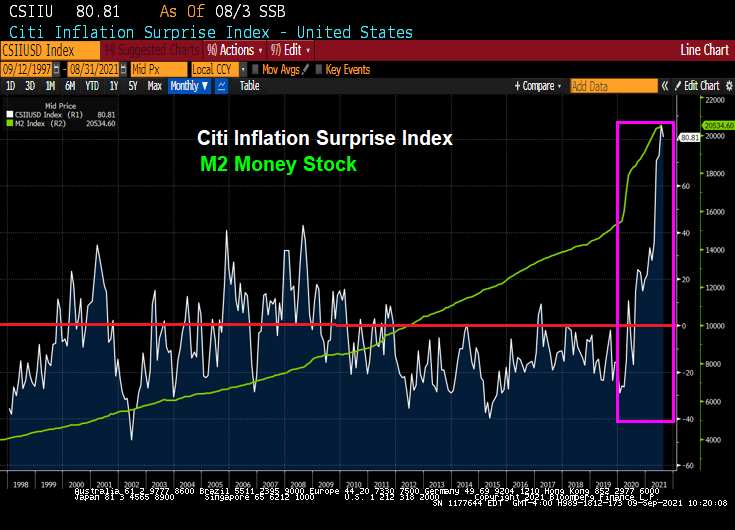
With all the Federal government fiscal stimulus and Federal Reserve monetary stimulus, we are seeing inflation and that inflation is eating away at S&P 500 earnings yield.
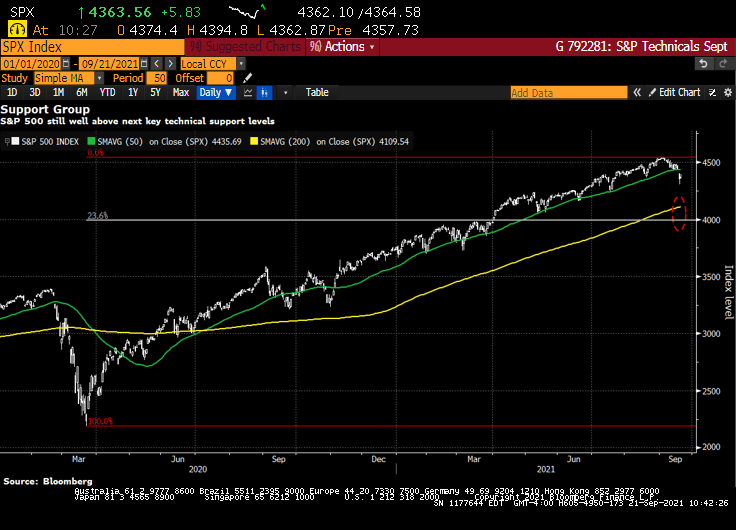
The S&P 500 is still well above key technical support levels.
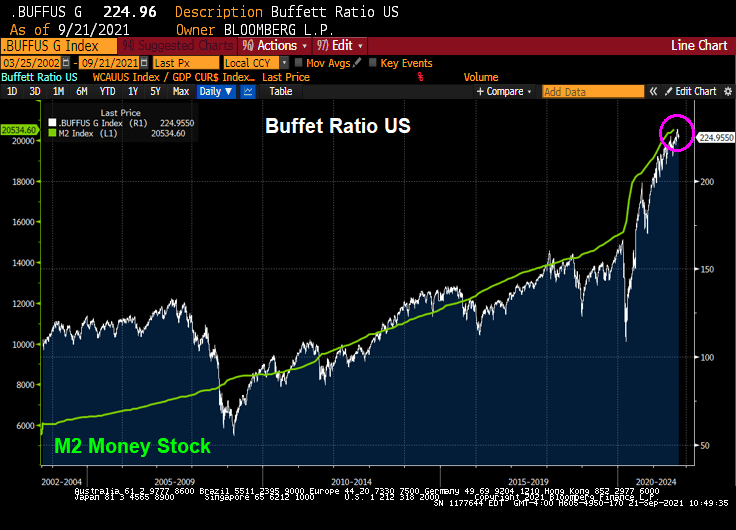
However, the Buffet ratio is raging along with Fed stimulus.
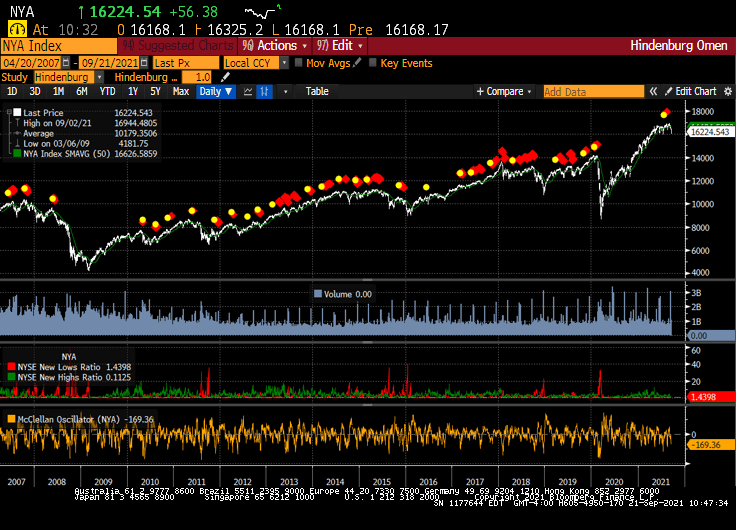
And the Hindenburg Omen is flashing RED!
The mystery of the Flying Fed is whether they will withdraw their massive monetary stimulus or not.
(Bloomberg) — The S&P 500 Index extended its decline past 2% Monday afternoon amid growing investor jitters about China’s real estate crackdown potentially sparking a financial contagion. And the Hang Seng fell 3.30% overnight.
The benchmark gauge was down 2.1% as of 12:08 p.m. in New York. All of the 11 major industry groups declined, with the energy, financials and materials sectors leading the losses. The tech-heavy Nasdaq 100 index slumped 2.4%, while the blue-chip Dow Jones Industrial Average retreated 1.9%.
By 2:33pm, the Dow is down 2.55%, NASDAQ down 3.15%.
Volatility also soared, with the Cboe Volatility Index — often called Wall Street’s “fear index” — jumping as much as 29% to 26.75, the highest level in over four months.
“While the Evergrande situation is front and center, the reality is, stock market valuations are overstretched and the market has enjoyed too long of a break from volatility and Monday’s stock market declines are not surprising,” said David Bahnsen, chief investment officer at the Bahnsen Group, a wealth management firm.
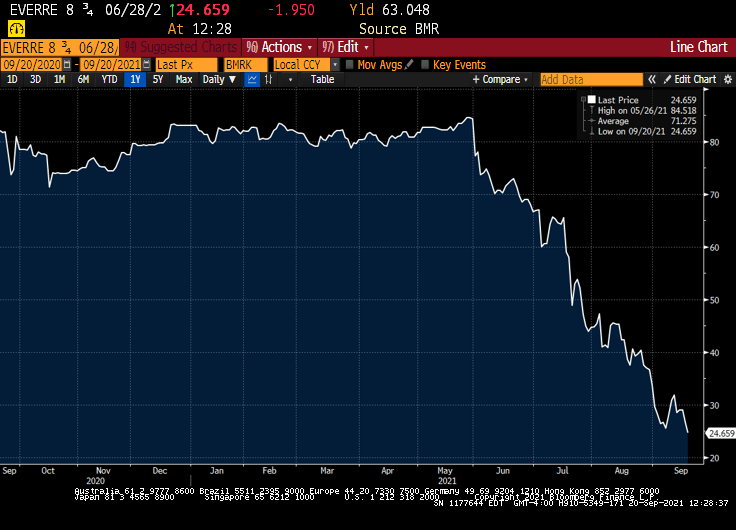
As Evergrande bonds continue to tank.
Meanwhile, most commodity prices are falling … except for UK Natural Gas Futures which are up 16.5%!
This is the Steve Urkel economy where The Federal Reserve and Federal government screw everything up with their policies (or follicies) and say “Whoops! Did I do that?”
(Bloomberg) — U.S. consumer sentiment rose slightly in early September but remained close to a near-decade low, while buying conditions deteriorated to their worst since 1980 because of high prices.
The University of Michigan’s preliminary sentiment index edged up to 71 from 70.3 in August, data released Friday showed. The figure trailed the median estimate of 72 in a Bloomberg survey of economists.
Buying conditions for household durables, homes and motor vehicles all fell to the lowest in decades. The report said the declines were due to complaints about high prices. Consumers expect inflation to rise 4.7% over the coming year, matching the highest since 2008.
September’s UMich Buying Conditions for Houses fell to 60 … thanks to superheated house prices.
I can just picture Fed Chair Jerome Powell channeling Steve Urkel and saying “Whoops!! Did I do that?”
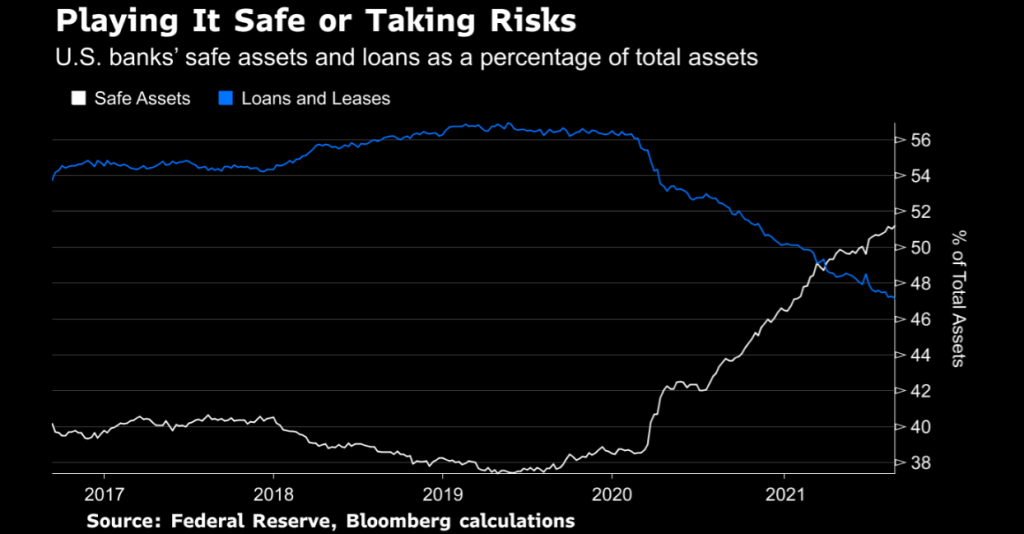
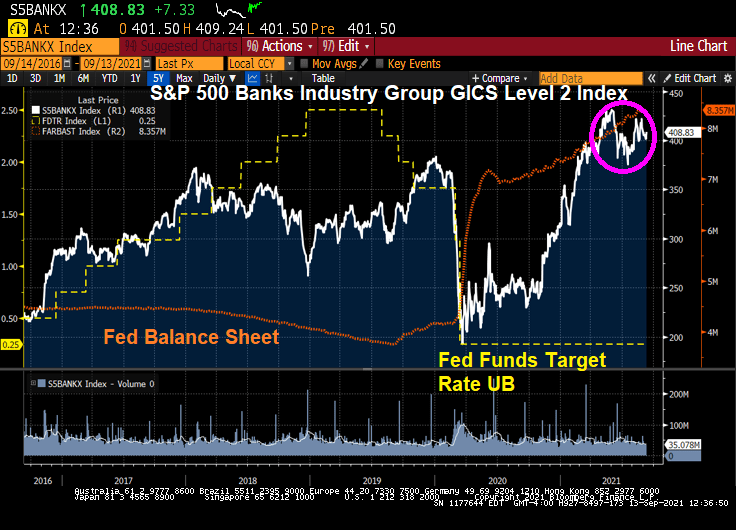
US bank loans and leases are slowing, yet The Federal Reserve has helped keep their stock values elevated thanks to the extraordinary monetary stimulus.
(Bloomberg) — U.S. banks’ loans and leases dropped to 47.15% of total assets in the week to Sept. 1 from 47.24% the week before, according to the Fed
Total assets increased to $22.19 trillion from $22.10 trillion
The share of safe assets — virtually riskless investments such as cash, Treasuries, and securities effectively guaranteed by the U.S. government — increased to 51.2% of total assets from 51.0%
Loans and leases as a percentage of deposits were unchanged at 59.7% Cash was the highest as a percentage of total assets since January 2015 Residential real-estate loans hit a historic low as a percentage of total assets at 10.0% Commercial real-estate loans were the lowest as a percentage of total assets since August 2015 Consumer loans were the lowest as a percentage of total assets since May Commercial and industrial loans were the lowest as a percentage of total assets since June 2012
Only in this deranged, hyper-stimulated market can bank stocks be soaring despite slowing loan and lease growth.
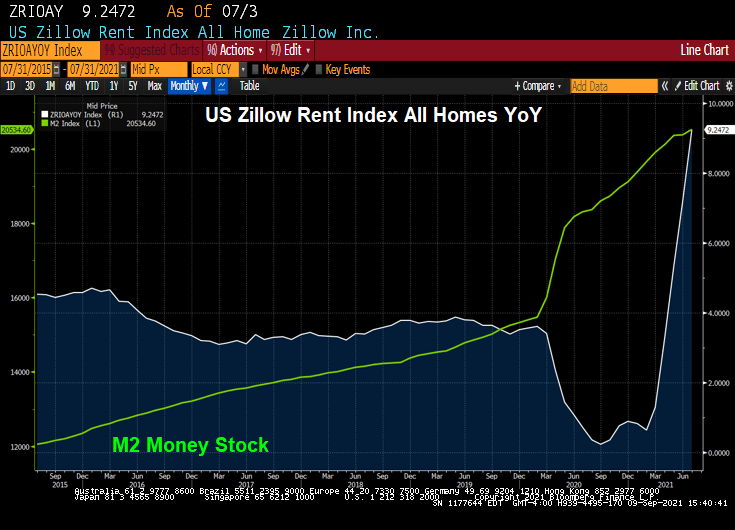
Not only after home prices screaming at near 20% YoY growth, but apartment rents are surging as well.
(Bloomberg) — Apartment rents were up in August from a year earlier in all the top 30 U.S. metro areas, the first time that’s happened since the start of the pandemic, according to a new report by Yardi.
The national average rent inmulti-family buildings rose 10.3% from a year earlier to $1,539 — the first double-digit rise in the dataset’s history — after a $25 increase in August, the real-estate firm said. Over the past 10 years, the average pace of growth has been 2%.
Zillow’s rent index of all homes is growing at 9.25% YoY.
Fed Chair Jerome “Inflation is Transitory” Powell.
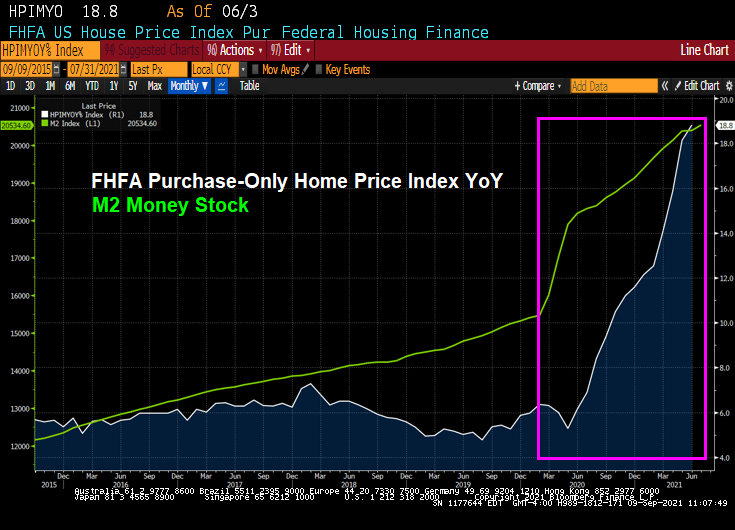
Covid struck in early 2020 and The Fed spiked the punchbowl with a massive surge in M2 Money. Like a storm surge.
Today’s unemployment report showed initial jobless claims and continuing jobless claims ALMOST at pre-Covid levels.
So it appears that The Fed’s job is done (under the assumption that The Fed had anything to do with the recovery).
So did The Fed almost violently overreact to the Covid crisis? The Atlanta Fed’s Raphael Bostic says it is too early to withdraw while St Louis Fed’s James “Bully” Bullard says it is time to taper.
Really Raph? 18.8% price growth is not enough for you?
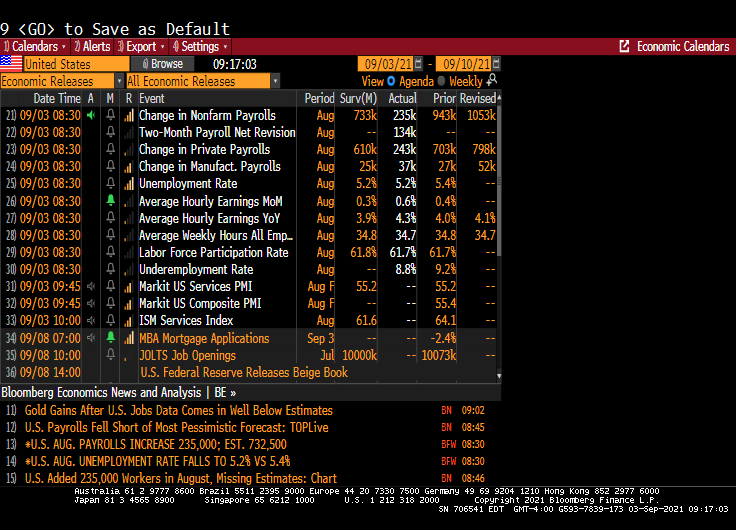
Well, after the dismal ADP print we knew that the August jobs numbers would be worse than imaginable. And they were!
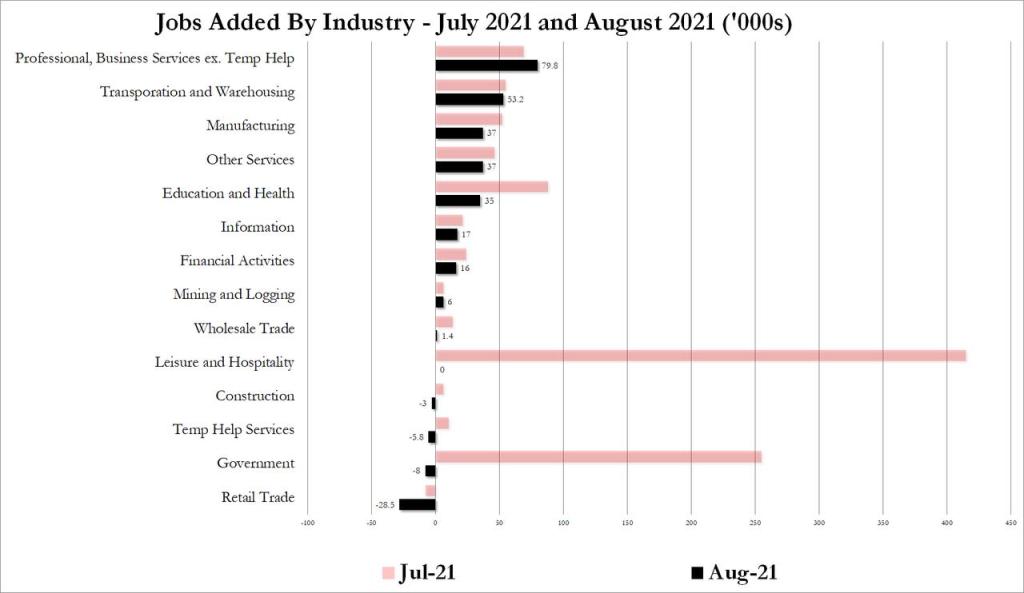
A big miss on the topline job creation number — the establishment survey suggested only 235,000 jobs were created in August, versus expectations for 733,000 — has undercut what little chance there was left of a Fed announcement on tapering later this month. It should make for a very interesting debate among policy makers about forward momentum in the labor market.
The shocker was in the leisure and hospitality sector, which created zero new jobs on net in August after figures of around 400,000 in each of the previous two months. There was a dip in hiring in other service sectors too, but nowhere near as significant. That could perhaps be due to some early impact from the spread of the delta variant in recent weeks.
On the household survey, the numbers looked better. According to those figures, the unemployment rate fell to 5.2%, in line with estimates, thanks to a 509,000 increase in reported employment. That also propelled the prime working-age employment to population ratio to 78%, from 77.8% in July.
Disparities narrowed in August as well, according to prime working-age EPOP ratios by race and ethnicity. Prime working-age Black EPOP, in particular, jumped to 73% from 72.2% the month before — outpacing the rest.
Equity futures pared a modest gain after the release, with contracts on the S&P 500 Index flat as of 9:09 a.m. in New York. With wages climbing, Treasury yields rose, with those on 10-year notes rising 4 basis points to 1.33%. The Bloomberg Dollar Index was down 0.3%.
The unemployment rate dropped which a misleading headline. That simply means that more people dropped out of the labor force than were unemployed. Not a good way to lower the unemployment rate.
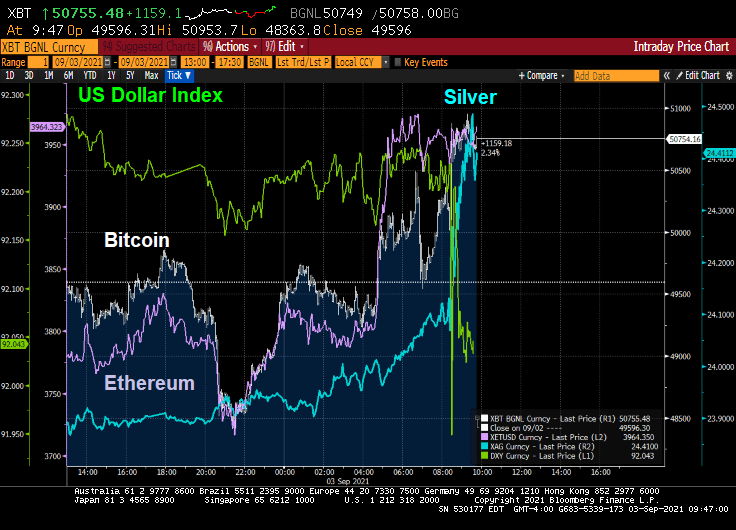
Alternative investments silver, Bitcoin and Ethereum rose on the lousy jobs report as the US Dollar dropped.
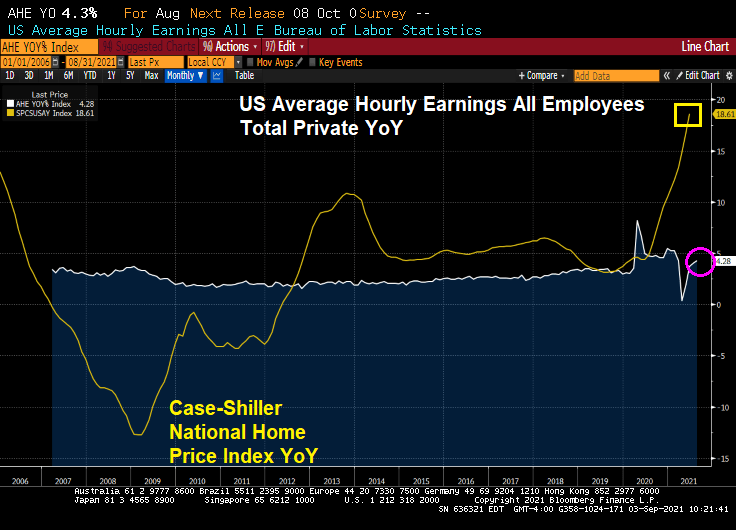
The good news? US Average Hourly Earnings All Employees Total Private YoY rose to 4.28%! The bad news? US home prices are rising at a 18.61% pace.
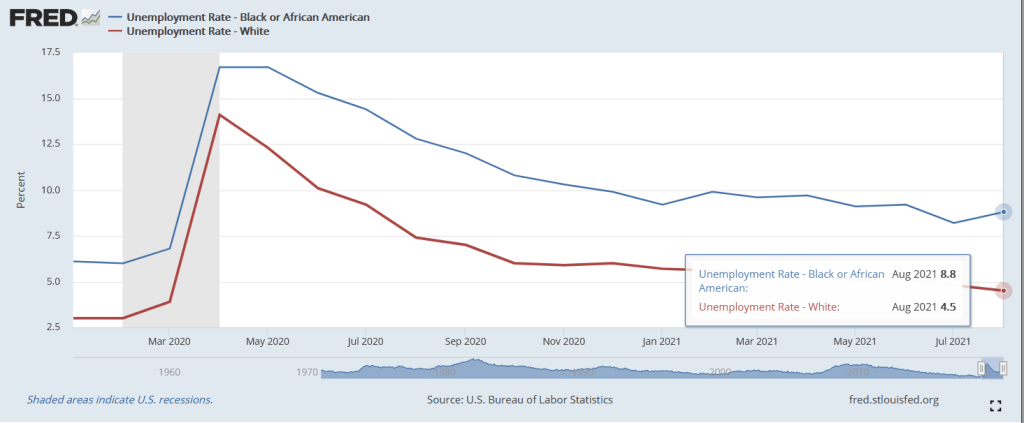
The bad news? Black unemployment rose to 8.8% in August while white unemployment fell to 4.5%. This represents a widening of the employment gap that is higher in August than pre-Covid.
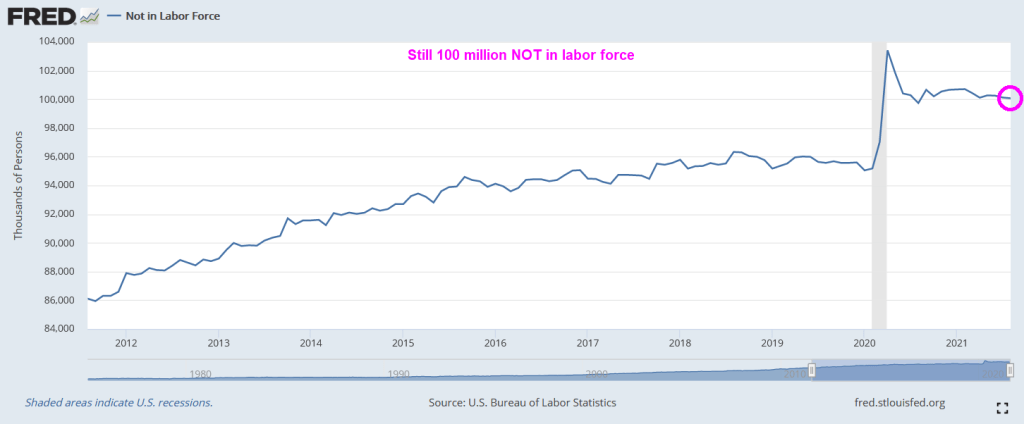
There are still over 100 million NOT in the labor force, higher than pre-Covid.
So, The Fed’s plans to begin tapering have gone up in smoke.
Since the original model of The Federal Reserve was to purchase Treasuries and Agency MBS in an effort to push down interest rates, it will be quite difficult to delink the two: taper the balance sheet while not raising short-term rates.
(Bloomberg) — Bond investors may not wait long to start pushing back against Federal Reserve Chair Jerome Powell’s efforts to delink the start of asset-purchase tapering from the countdown to eventual policy-rate hikes.
Since Powell last week said the central bank could begin reducing its monthly bond buying this year, traders have stuck with early 2023 as the likely timing for the Fed’s liftoff from zero interest rates, and Treasury yields have barely budged.
But that calm faces a test starting Friday. The potential for volatility comes from the fact that when Fed officials gather this month, they will release fresh projections for the fed funds rate for the next few years. And with the labor market pivotal for Fed policy now, Friday’s August jobs report is seen as laying the foundation for these forecasts — collectively known as the dot plot — especially as some Fed officials have already been pushing for an early taper.
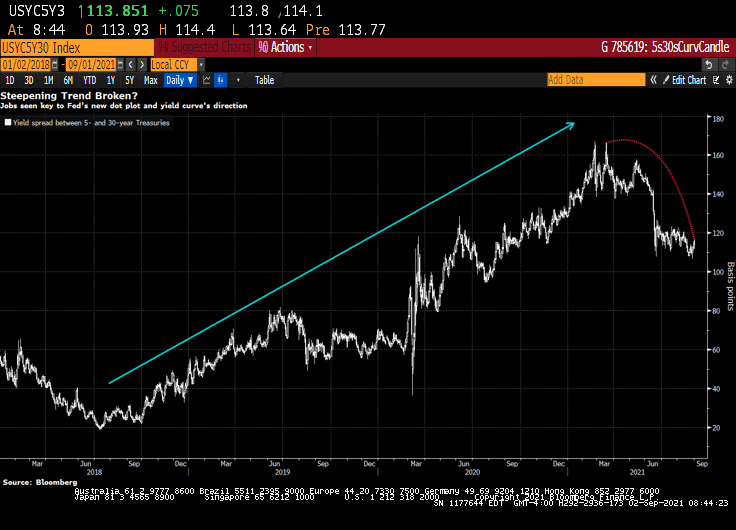
The upshot is that a robust reading Friday could have investors pulling forward tightening bets regardless of Powell’s efforts last week in his virtual speech at the Fed’s Jackson Hole symposium. The risk is traders will prepare for a repeat of June, when a hawkish signal via the dot-plot took markets by surprise and triggered an abrupt unwinding of wagers on a steeper yield curve.
If the employment report is “even deemed acceptable, regional presidents will be back on the tape in a flash,” sounding hawkish again, said Jim Vogel, an analyst at FHN Financial. “And you may have more officials penciling in a 2022 hike. And that would have to flatten the yield curve.”
Expectations for a hawkish shift would lift 5-year Treasury yields in particular, shrinking the gap with 30-year rates, Vogel said. That spread was around 114 basis points Wednesday, down from about 140 just before the Fed met in mid-June.
Dots Math
Officials’ June quarterly forecasts not only showed a median funds rate projection of two hikes in 2023 — after the March dot plot indicated no tightening until at least 2024 — but that seven participants saw at least one increase next year. This time around, it will take just three officials to raise their dots for 2022 for a full hike to be the new median for next year, assuming everyone else keeps their projections where they were.
Traders responded to the Fed’s June rate projections by driving 5-year yields up the most in almost four months. That was even as Powell said in his press conference that the dot plot should be taken with a “big grain of salt” and discussion about raising rates would be “highly premature.”
Powell last week said “the timing and pace of the coming reduction in asset purchases will not be intended to carry a direct signal regarding the timing of interest rate liftoff, for which we have articulated a different and substantially more stringent test.”
But the leadup to the Fed decision on Sept. 22 may culminate in a dot-plot unveiling that yet again presents a communication challenge for policy makers, as has been seen several times since the Fed introduced the projections in 2012.
“There’s information in the dots, and generally it’s good information,” said Shahid Ladha, head of Group-of-10 rates strategy for the Americas at BNP Paribas SA. It makes sense for the Fed, regarding tapering and rate hikes, “to try to separate them, but I don’t think they’ll be ultimately successful in separating them.”
Trouble Ahead
Even some Fed officials are wary of being able to disentangle the tapering from rate hikes, minutes from the July Fed meeting showed.
Kevin Flanagan, head of fixed-income strategy at WisdomTree Investments Inc., which runs exchange-traded funds with assets of $75 billion, sees trouble for the Fed.
His view is that the labor market will keep gaining ground in its rebound from the pandemic, and that the median September dot may show a hike in 2022. That bodes for higher yields, a flatter curve and makes floating-rate notes appealing, he said.
The median of economists’ projection is for a gain of 725,000 jobs in August, a slowdown from June and July but well above the average for 2021. Of course, with millions still out of work relative to pre-pandemic levels, the Fed may prove to take longer to lift rates than traders expect, especially given the central bank’s “broad and inclusive” maximum-employment goal. But the market may be about to challenge that approach.
Note: Yesterday’s ADP jobs gain was forecast to be 625k jobs added in August, but only 374k jobs were actually added.
Fed Faces ‘Ugly Fight’ Over Jobs Goal in Next Big Policy Debate
“We are going to be all of a sudden talking about rate hikes potentially next year, and that is where the focus of the bond market is going to go,” Flanagan said. “The dot plot will be the Fed’s initial message for its forward guidance on rates. And then it will begin to come from Fedspeak — which is when the rubber will really meet the road.”
And with the stock market, particularly technology stocks, rising with Fed asset purchases, I wonder if The Fed forecasts that assets prices will keep going if they withdraw the punch bowl?
Let’s see if Powell and The Gang can forecast the stock market if they taper the balance sheet and raise rates.


















You must be logged in to post a comment.