Can The Crypto Ethereum Hedge Against Inflation? (Inflation Rate Highest In 40 Years)

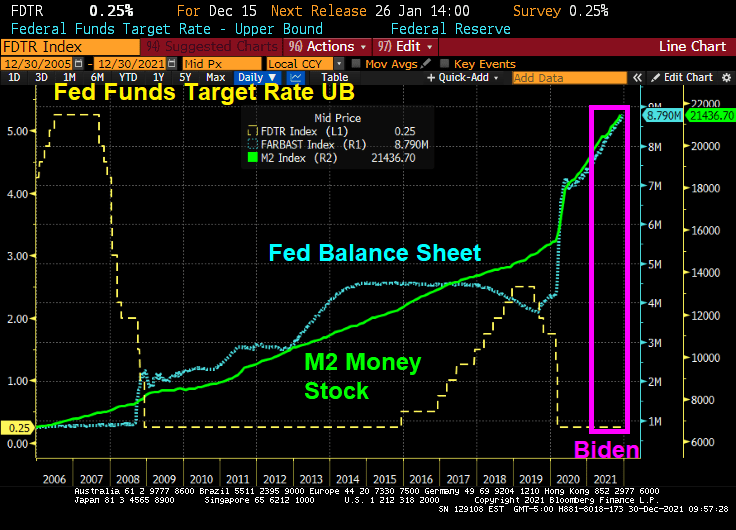
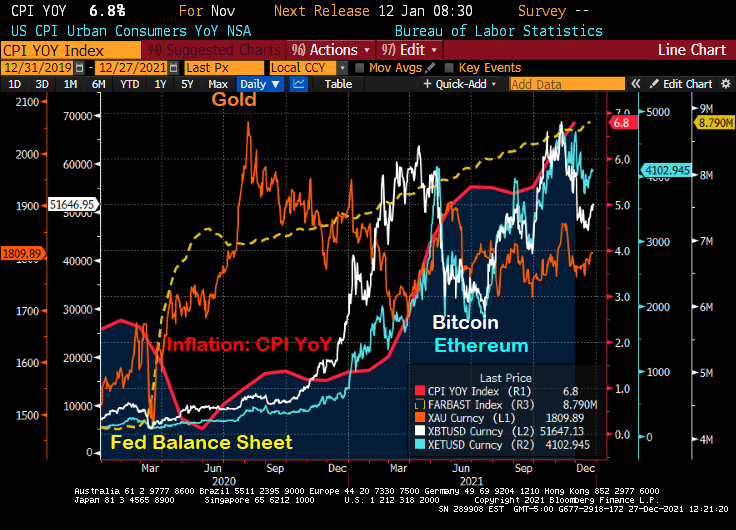
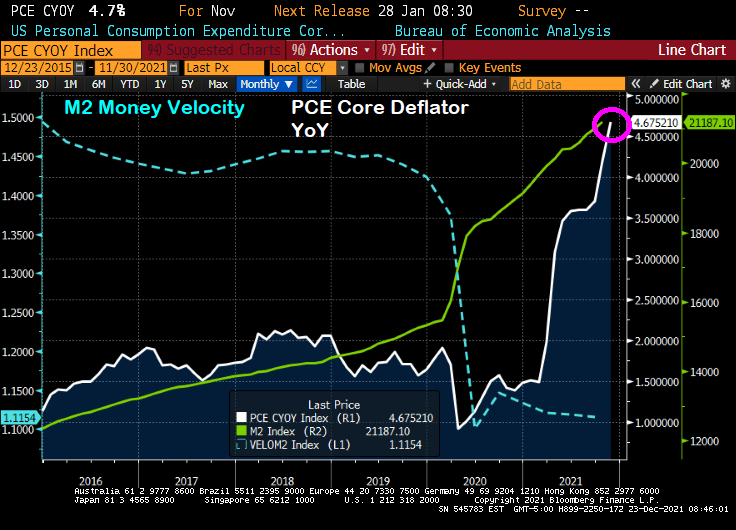
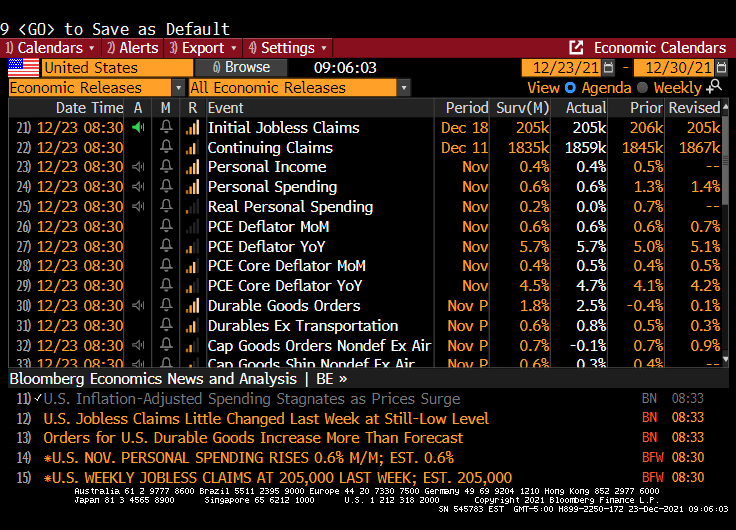
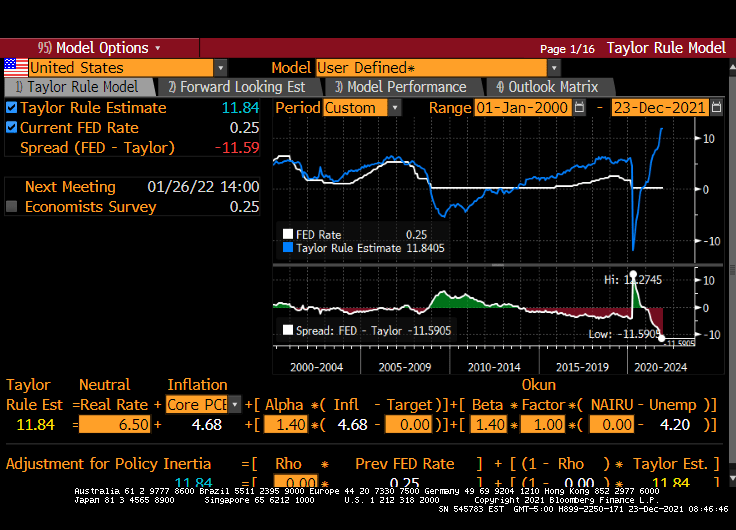
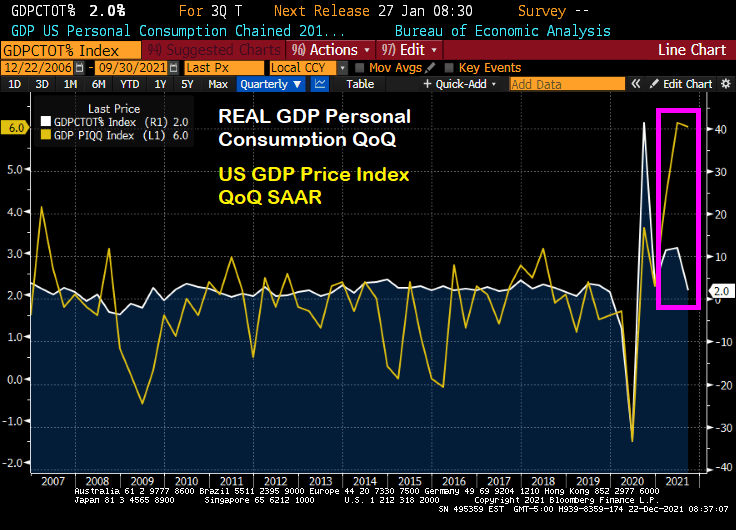
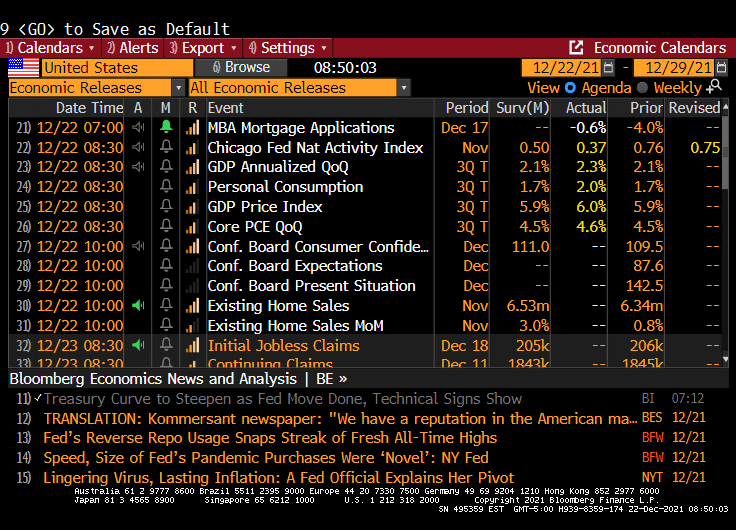
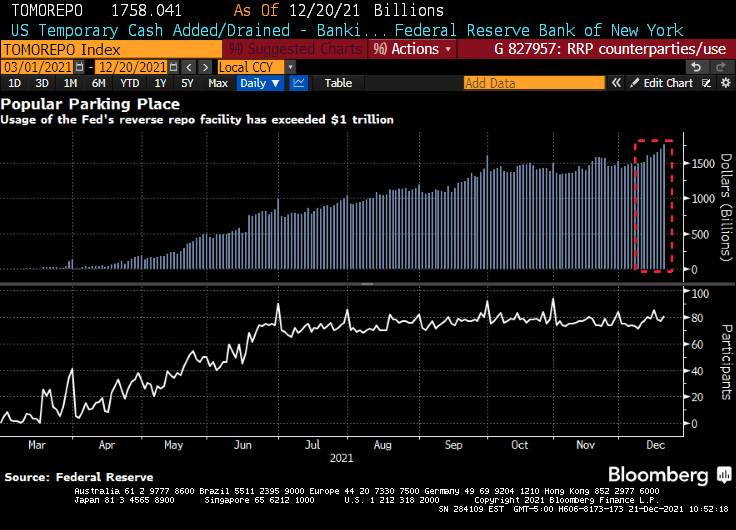
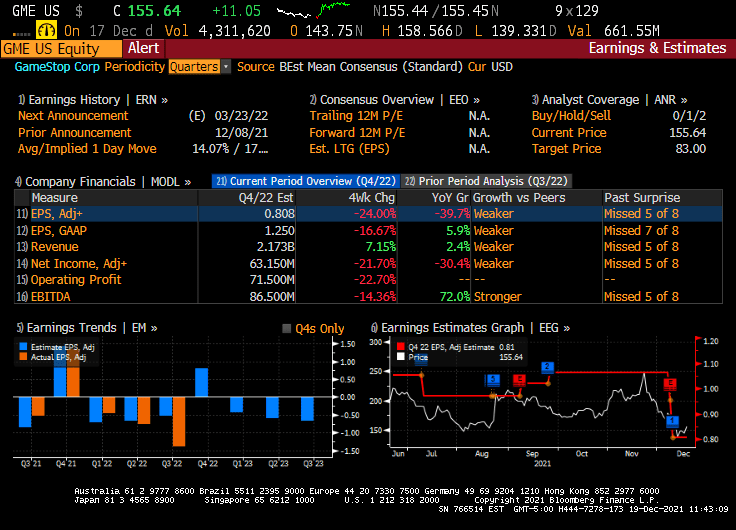
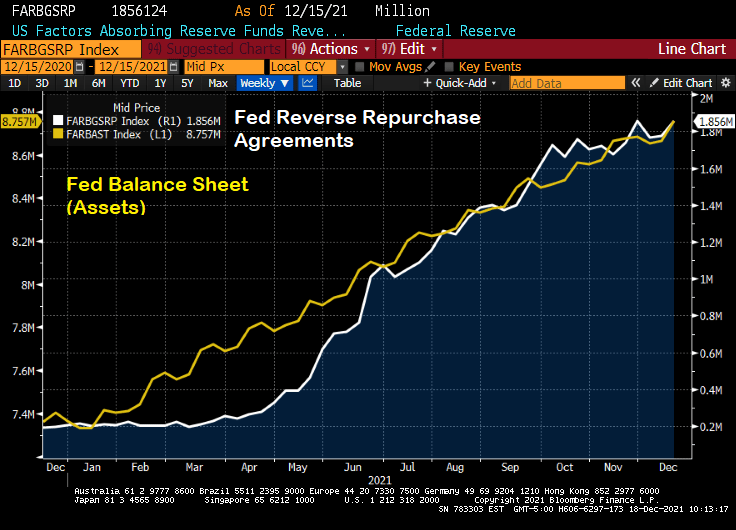
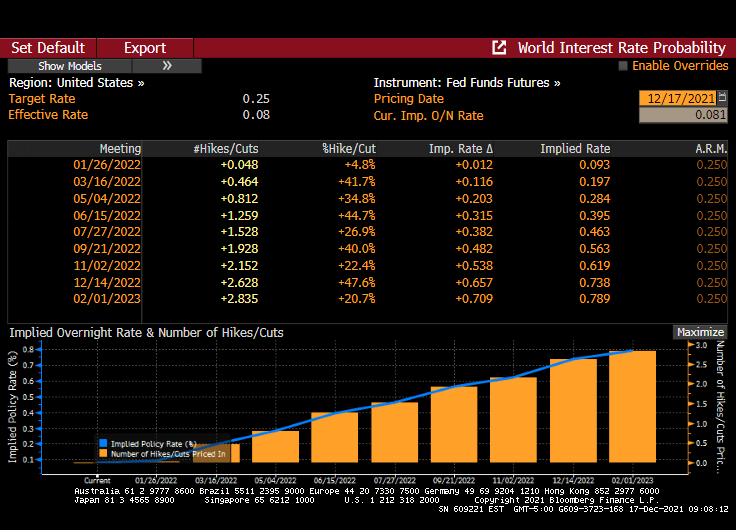
Inflation is the highest in 40 years. There used to be a lot of discussion about hedging against inflation in the 1970s and 1980s, but discussion subsided as inflation cooled in the US. But now it is roaring back as Fed monetary stimulus continues unabated and The Federal government continues to spends like crazy.

So, how do we protect ourselves against inflation caused by Federal government policies (or follicies)? How about cryptocurrencies like Ethereum?

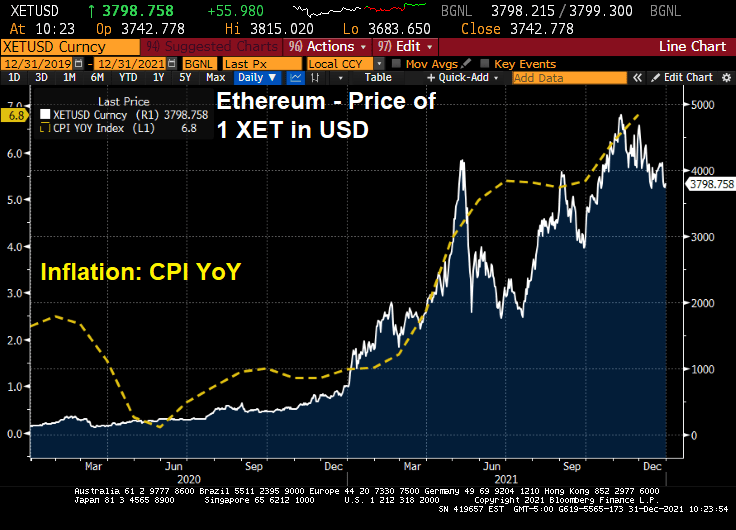
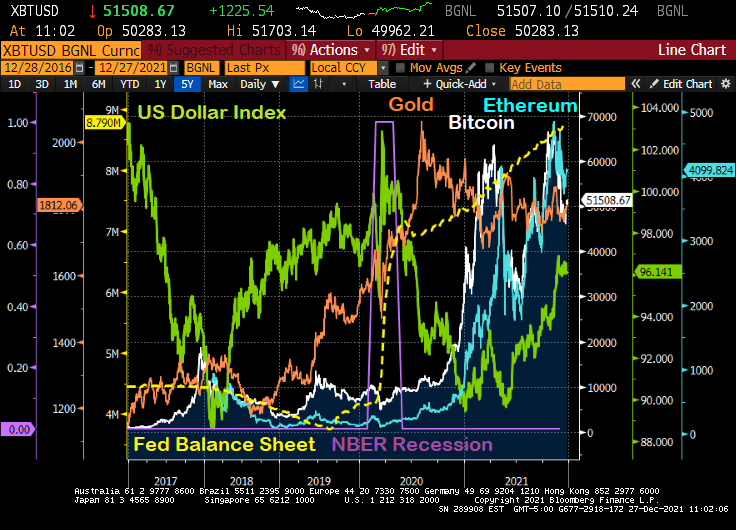
Ethereum really started to take off as US inflation took off. Not a perfect fit (or hedge), but on average Ethereum has kept up with inflation.

If you believe in technical analysis, Ethereum is in the 3rd wave on the downside.

But if you believe the Ichimoku Cloud, Ethereum lies BELOW the cloud indicating that Ethereum is likely to rise.

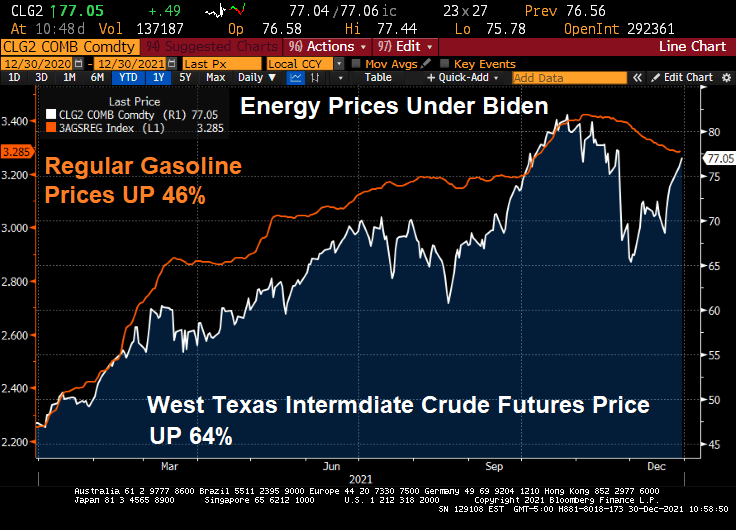
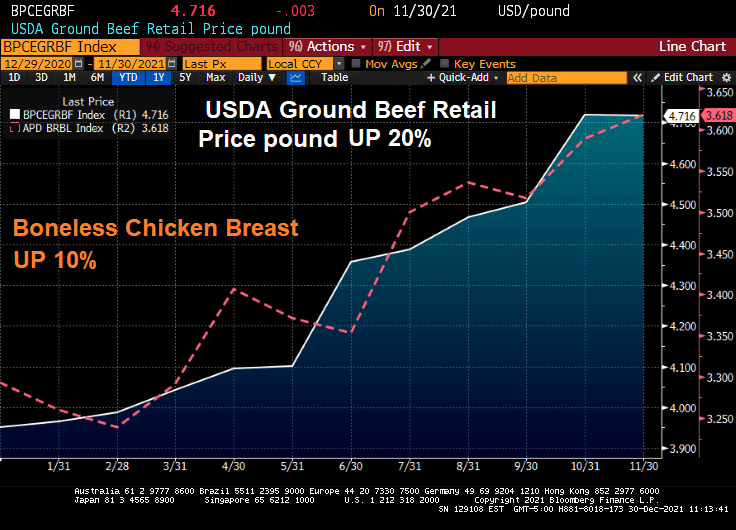
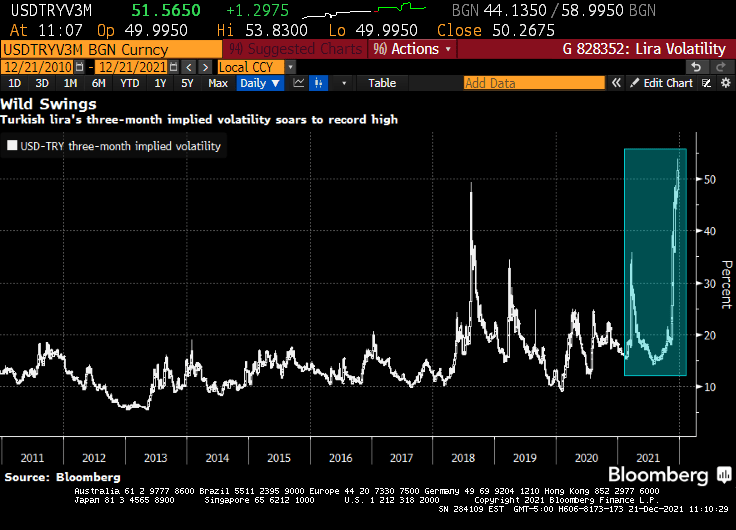
Bear in mind that Biden’s energy policies have created large increases in energy prices which lead to large increases in other products such as food prices. Again, not all inflation is due to Federal policies. Arabica coffee prices are driven by droughts and excessive rainfall, etc. But inflation causes a rise in agriculture prices due to transportation cost increases, increases in fertilizer prices (thank to natural gas price increases), and panic buying by consumers.

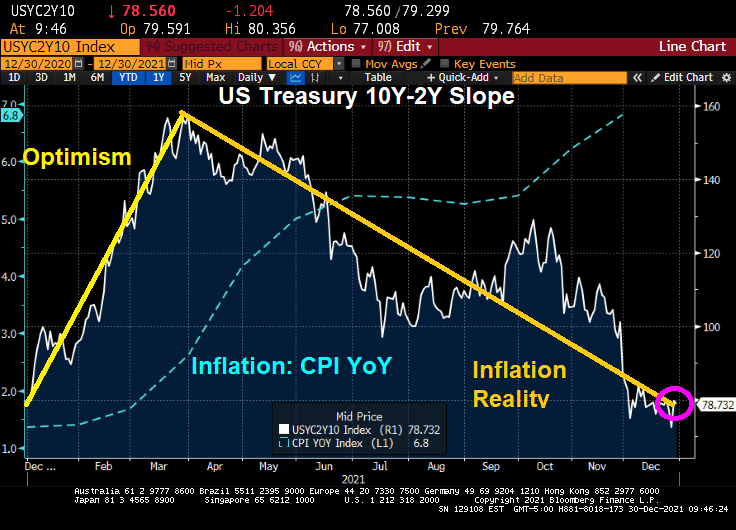
Despite what Federal officials jawbone about, inflation has momentum and is unlikely to swiftly subside, particularly if the Build Back (Inflation) Better Act passes in 2022.

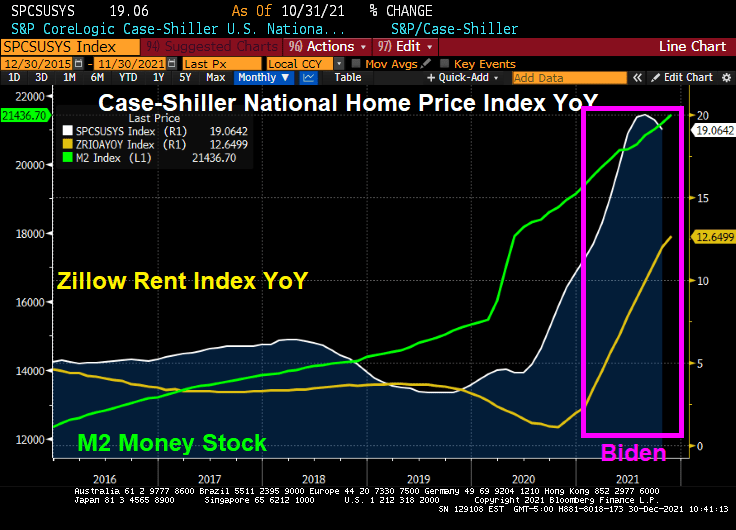
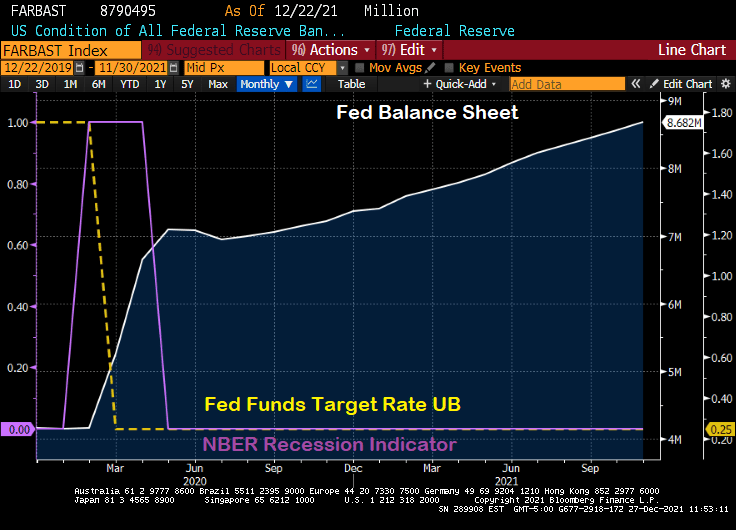
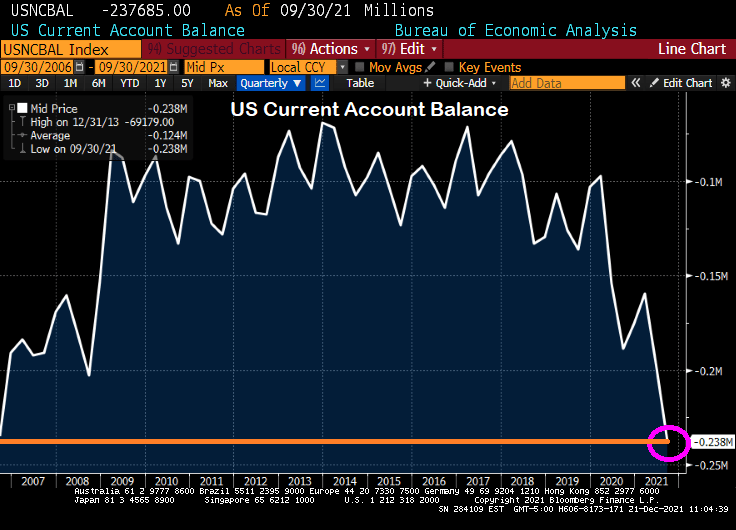
Remember, consumer purchasing power of the US Dollar has declined dramatically since the creation of The Federal Reserve System in 1913. The Fed isn’t going away and neither is wasteful Federal spending, like BBB.

Protect yourself! Or at least Treat Yo Self!

Should Speaker Pelosi Replace Cramer At CNBC Investing Club? (Insider Trading Of Impending Regulations And Government Spending IS Insider Information And Should Be ILLEGAL)

I thought US House Speaker Nancy Pelosi was going to retire, but now it looks like she wants to keep inside trading with information about regulation and government spending that investors don’t have.

Today, her investments were released for the last two weeks of December.

Largely, her investments were in call options for Disney, Saleforce, Roblox, Micron and Google (Alphabet).

I would prefer that she retire and replace Cramer on CNBC’s Mad Money. So she could bang the gong instead of her gavel. Or call it CNBC Investing Club with Nancy Pelosi.

Her defense that she should be allowed to invest in stocks and options since the US is a free-market economy was comical at best, and extremely hypocritical at worst.

US Treasury Yield Curve Now Back Where It Stated With Biden At The Helm (Inflation Crushing America And The Yield Curve)

It has been almost a year since Joe Biden has been President of the United States and a Democrat majority took control of The House and Senate. And what has happened to the US Treasury yield curve slope over the past year?

The yield curve is back where it started. There was the “honeymoon effect” where the curve slope rose. After all, Biden was Obama’s Vice President for 8 years and The Democrats has promised so much in the 2020 election. But by early April, the reality of the massive Federal spending (combined with Fed Stimulypto) began showing what was feared: inflation (blue line) started to grow at a rapid rate of speed. With inflation now at 6.8% YoY,

In fairness to Biden, The Federal Reserve has been overstimulating the economy since The Federal Reserve since Ben Bernanke and the Fed Open Market Committee (FOMC) dropped the hammer on The Fed Funds Target Rate once the rate hit 5.25% in September 2007. They kept cutting it reached 25 basis points (or 0.25%) in December 2008. In August 2008, Bernanke and Company began their “Quantitative Easing” or asset purchasing programs. Between The Fed’s Target Rate and QE, The Fed has continued to overstimulate markets ever since. Under Biden, The Fed Funds Target Rate remains at 0.25% and The Fed’s Balance sheet has grown to $8.79 Trillion (bigger than the entire economies of Japan and Germany put together!).

How about housing? Home prices are growing at 19% YoY while rents are growing at 12.65% YoY.

Energy prices have risen dramatically under Biden. Gasoline is up 46% despite a slight reprieve recently. WTI crude prices are up 64%.

How about food? Beef prices are up 20% and chicken prices are up 10%.

On a positive note, the S&P 500 index has soared … thanks has soared during Biden’s term thanks to Fed stimulus and Federal spending on COVID.

The Build Back Better Act if passed (in its entirety or on a piecemeal basis) will lead to even MORE inflation.

Perhaps Biden’s spokesperson Jen Psaki can recreate the Biden Administration as a lovable, hilarious family like the comic strip Gasoline Alley with old Joe Biden as Skeezix. And insider-trading star, House Speaker Nancy Pelosi as the family matriarch.

The Great Distortion! Since COVID And Fed Hysteria, First Gold Then Bitcoin, Then Ethereum Surged While The US Dollar Declined Then Rallied

The global economy has certainly been turned on its head by the COVID outbreak in early 2020. Not so much by the virus itself, but by Central Bank hysteria in terms of rate lowering and balance sheet expansion. Which The Fed has not yet unwound.

Let’s look at what has happened since the mini-recession caused by COVID in early 2020. The shortest recession in US history, a measly 2 months. The Fed expanded its balance sheet from $4.17 million in February 2020 to $8.79 million today. That is, The Fed over doubled the size of their balance sheet in reaction to the shortest recession in US history. Overreaction much?

What has happened since the mini-recession and The Fed’s massive overreaction?

First, gold (gold line) surged then calmed down. Then cryptocurrency Bitcoin (while line) surged, then calmed down, then surged again only to calm down again. Then crypto Ethereum surged, calmed, surged, calmed. Meanwhile the US Dollar Index crashed only to start rising again.

The Fed’s overreaction and failure to withdraw excessive stimulus has led to the rise of alternatives to the deflating dollar due to inflation.

When will The Fed ACTUALLY start removing the overreaction stimulus? Let’s get it started.

Perhaps only April Ludgate can kill The Fed’s overreaction stimulus.

U.S. Inflation-Adjusted Spending Stagnates To 0% Growth As Prices Surge (Core PCE Deflator Rises To 4.7% YoY, Highest Since 1989 Implying A Taylor Rule Rate Of 11.84%)

The core Personal Consumption Expenditures (PCE) deflator numbers for November were released this morning and the print was a whopping 4.7% YoY, the highest rate since 1989.

Meanwhile, U.S. consumer spending, adjusted for inflation (aka, REAL personal spending), stagnated in November as the fastest price gains in nearly four decades eroded purchasing power. Stagnated to 0.

Purchases of goods and services, after adjusting for higher prices, were little changed following a 0.7% gain in October, Commerce Department figures showed Thursday.

And as Paul Harvey would say, here is the rest of the story.

Core PCE growth YoY of 4.68% implies a Fed Funds target rate of 11.84%. Powell and the gang have the target rate at 0.25%. But the Taylor Rule doesn’t take into account the latest FEAR raging in Washington DC … the Omicron variant. Just another excuse for The Fed to do nothing and let asset bubbles blow out of control.

Tiny bubbles? How about HUGE bubbles!

Stimulypto! US Q3 Price Index Grows 3X Personal Consumption (Real GDP +2.3% QoQ)

The good news is that US Real GDP grew at 2.3% QoQ in Q3 thanks to massive Federal government and Federal Reserve stimulus. The bad news? Prices are growing at rate of 6% QoQ, three times higher than the growth of real personal consumption.

Runaway inflation, cooling personal consumption. This is the definition of “stimulyltpo”: the excessive spending by Washington DC in conjunction with excessive monetary stimulus from The Federal Reserve.

Let’s see if Christmas season is jolly with Sewage Joe trying to scare everyone about Omicron.

Fed Reverse Repo Usage Rises to Record for Fourth Straight Day As Turkish Lira Volatility Hits All-time High And US Current Account Balances Rise To 2006 Levels

(Bloomberg) — The amount of money that investors are parking at a major central bank facility climbed to yet another all-time high as supply-demand imbalances continue to dog U.S. dollar funding markets. 

Eighty-one participants on Monday placed a total of $1.758 trillion at the Federal Reserve’s overnight reverse repurchase agreement facility, in which counterparties like money-market funds can place cash with the central bank. That surpassed the previous record volume of $1.705 trillion from Dec. 17, New York Fed data show.

Demand for the so-called RRP has climbed further as principal and interest payments from government-sponsored enterprises has entered short-end funding markets. However, that cash is expected to exit the overnight space by the end of the week as the Treasury ramps up its issuance of Treasury bills now that Congress has increased the debt limit. 

Overall volume has been rising this year as a flood of cash continues to overwhelm the U.S. dollar funding markets due to central-bank asset purchases and the drawdown of the Treasury’s cash account, which is pushing reserves into the system. The larger takeup looks set to persist even as the Fed tapers its asset-purchase program — something it began this month — because the supply-demand imbalances in short-end securities are likely to persist.

Then we have the Turkish Lira volatility hitting an all-time high.

And finally we have the US Current Account Balance rising to levels last seen in 2006 just after the peak of the US housing bubble.

Mele Kalikimaka!

China Contagion (Not Wuhan Virus, But Real Estate), Kaisa Down 13%, Evergrande Down 4.32%, Shimao Down 6.40%, Chinese Estates Down 30.42%

While the Chinese Wuhan virus (aka, the Fauci Flu) has plagued the world, another Chinese “export” is also suffering what is known as contagion: China’s real estate sector.

Real estate companies Evergrande, Kaisa, Shimao and Chinese Estates are falling like a rock today.

But it has been a steady decline since Q1 2021 except for Chinese Estates. But they have resumed their death dive.

On the debt side, Evergrande is down to 18.856 while Kaisa has lost less (but still quite a bit) and Shimao’s bond look almost like a good investment, relative to Kaisa and Evergrande. But they are all sucking wind. Maybe they all have the Fauci Flu?

Let’s see if this latest Chinese “export” washes ashore in the USA.

Transitory? Temporary? What Happens When The COVID Stimulus Is Removed? GameStop, Bitcoin, Ethereum, Gold And M2 Money

I love how The Federal Reserve talking heads, the media, economists like Paul Krugman, all refer to inflation as “transitory” and excessive liquidity as “temporary.”

Let’s look at a variety of alternative investments to the S&P 500, GameStop, Bitcoin, Ethereum and Gold after The Federal Reserve’s and Federal government massive (over)reaction to COVID in early 2020. Gold is the first asset to surge after M2 Money surged, but has declined since. Game Stop had a big surge (likely due to positive vibes on Reddit), but has been volatile and generally falling since “The Surge.” Bitcoin had a delayed surge as did Ethereum. Despite fear about government regulation, Ethereum in particular remains elevated.

The “temporary” stimulus has resulted in the lowest M2 Money velocity in history. And we will have to see if the “temporary” excess liquidity in the financial system is truly temporary.

Here is a chart to show the “Stimulytpo” effect on commercial and industrial loans which surged (including PPP loans) but have simmered down to pre-COVID levels.

The earnings for GameStop were terrible (down 39.7% YoY). But at least Christmas season is upon us and maybe GameStop will surge with a good retail spending season.

But what happens to markets if the Federal government “stimulypto” is removed? If it ever is.

What’s Wrong With This Picture? Fed Reverse Repo Usage Continues To Grow Along With Fed’s Balance Sheet (Reverse Repos At All-time High)

I love listening to Fed talking heads (or Fear The Talking Fed). They mostly seem to acknowledge that inflation is a problem and that the excessive monetary stimulus should be reduced.

But then I see the chart of The Fed’s balance sheet and The Fed’s reverse repo operations.

Then we have Federal Reserve Governor Christopher Waller saying that Th Fed could start raising interest rates as early as its March 15-16 meeting, after deciding to end asset purchases sooner than planned. My question is … why wait until the March meeting?

Is it fear of the Omincron Variant (which sounds like a Frederick Forsyth thriller)? Does The Fed not want to rock the boat prior to the Christmas season? The US is at or near full employment, so what is the real reason for delaying a rate increase until March or June? Or the fear that Congress won’t pass Biden’s Build Back Better Act?

Fed Funds Futures infer that one rate hike will occur at the June Fed Open Market Committee (FOMC) meeting and one at the November meeting.

So will Powell get back in the saddle again and actually do his job?