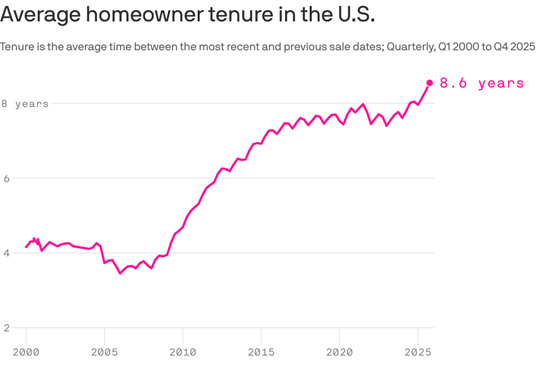
Higher housing prices and higher than normal mortgages produces rising average homeowner tenure.
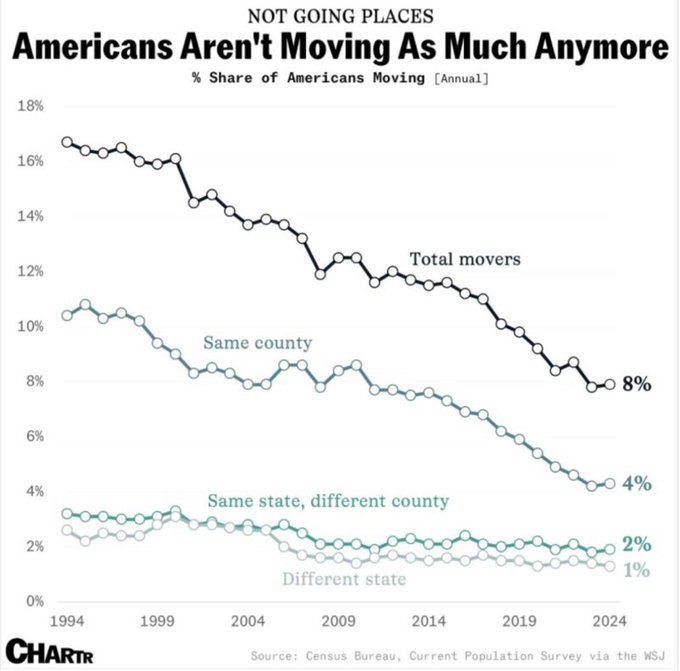
And Americans aren’t moving.
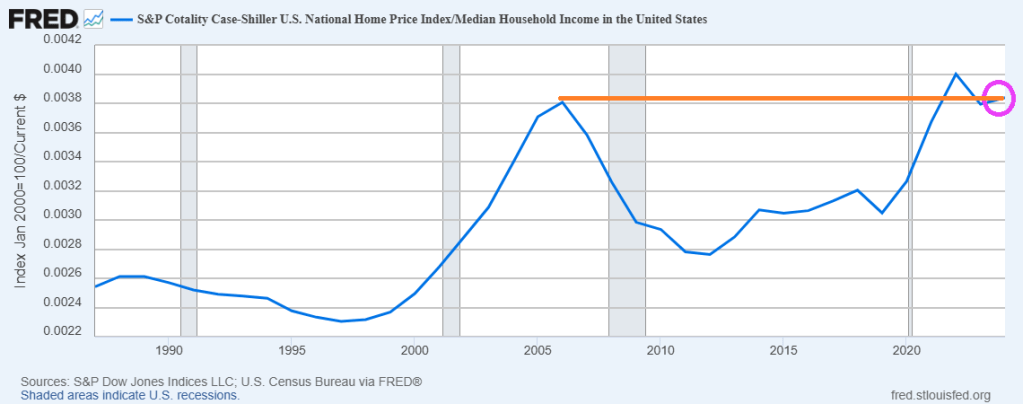
The ratio of home prices to median household income is the highest since “The Big Short” home price collapse.
Confounded Interest – Anthony B. Sanders
Financial Markets And Real Estate
Higher housing prices and higher than normal mortgages produces rising average homeowner tenure.
And Americans aren’t moving.
The ratio of home prices to median household income is the highest since “The Big Short” home price collapse.
Yikes! The ratio of US Home Prices to US Median Household Income is now higher than the ratio during the catestrophic housing bubble during the latter half of the 2000s.
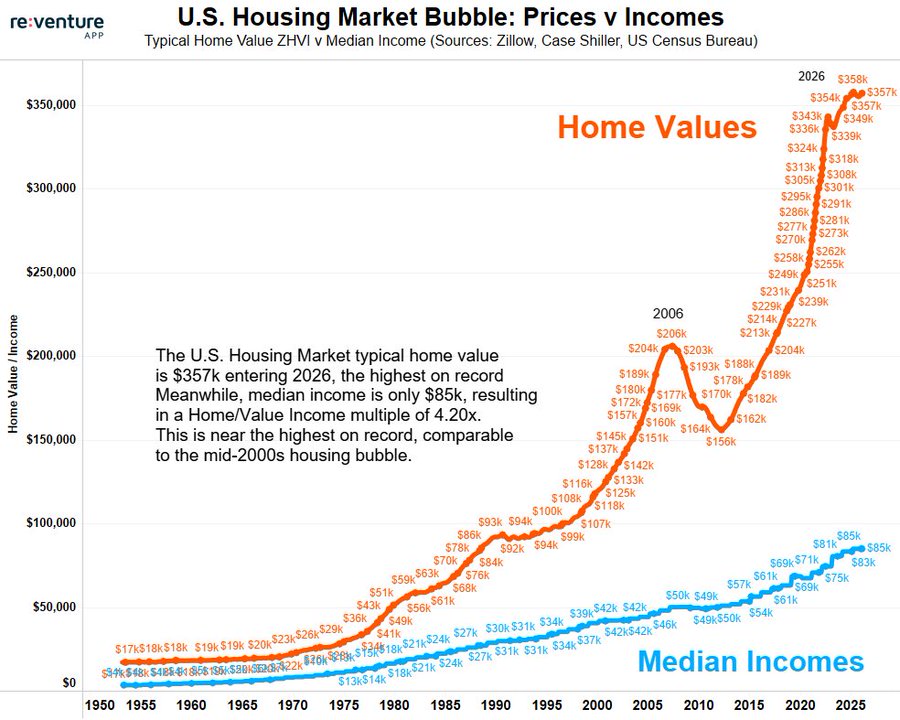
Here is a chart of home prices and median household incone,
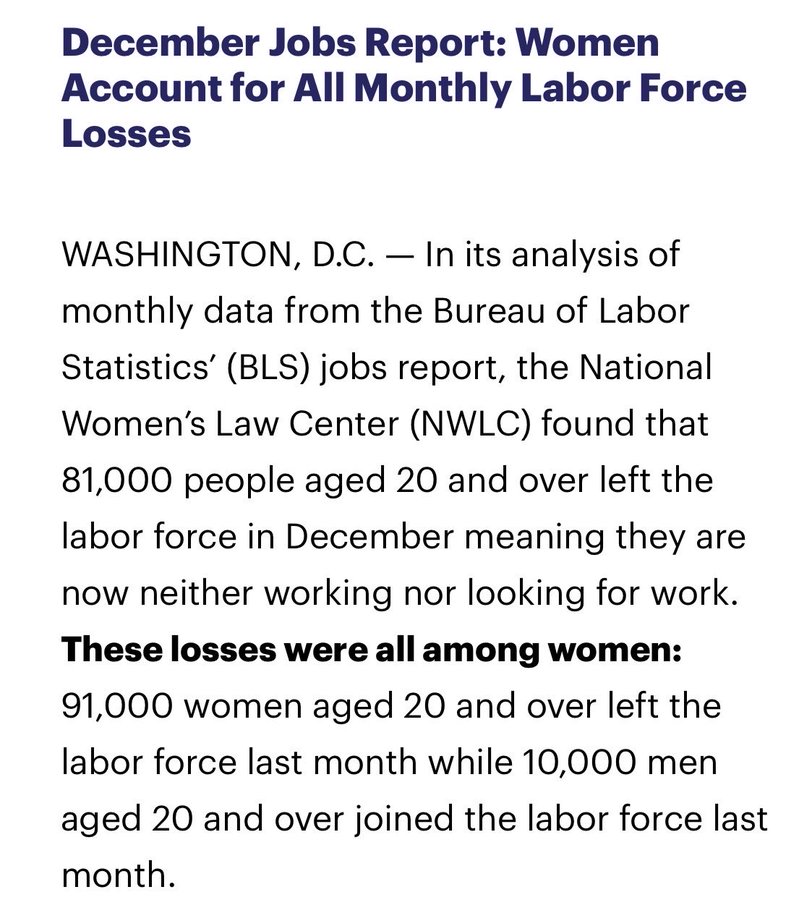
The labor market is truly screwed-up. The December jobs report reveals that women account for nearly all labor force losses.
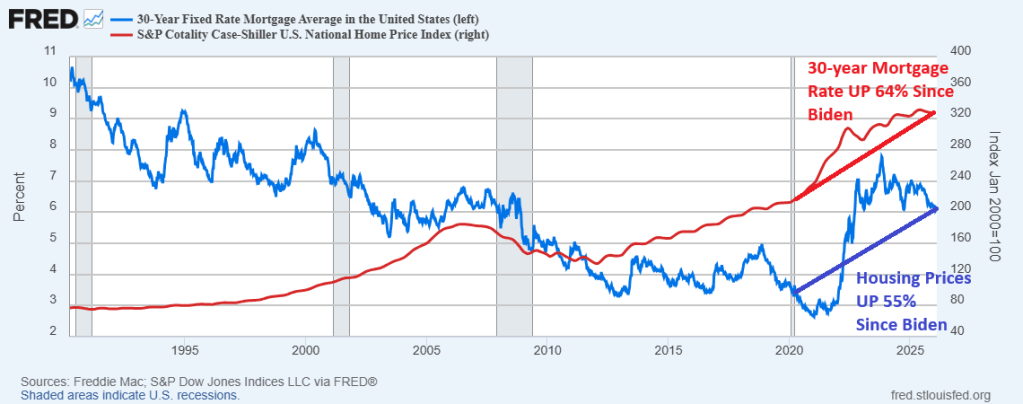
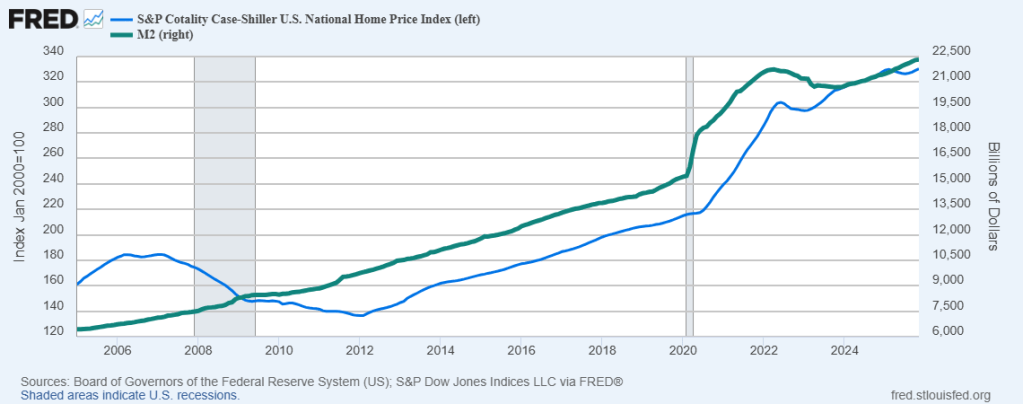
I ain’t drunk! But it would help in this housing market where housing prices and mortgage rates are much higher than when Joe Biden became President in January 2020. In fact, the Case-Shiller national home price index is 55% higher than when Sleepy Joe took the reins of Presidency and the 30-year mortgage rate is 64% higher.
Because of higher housing prices and mortgage rates,
The Case-Shiller national home price index is 55% higher than when Sleepy Joe took the reins of Presidency and the 30-year mortgage rate is 64% higher.
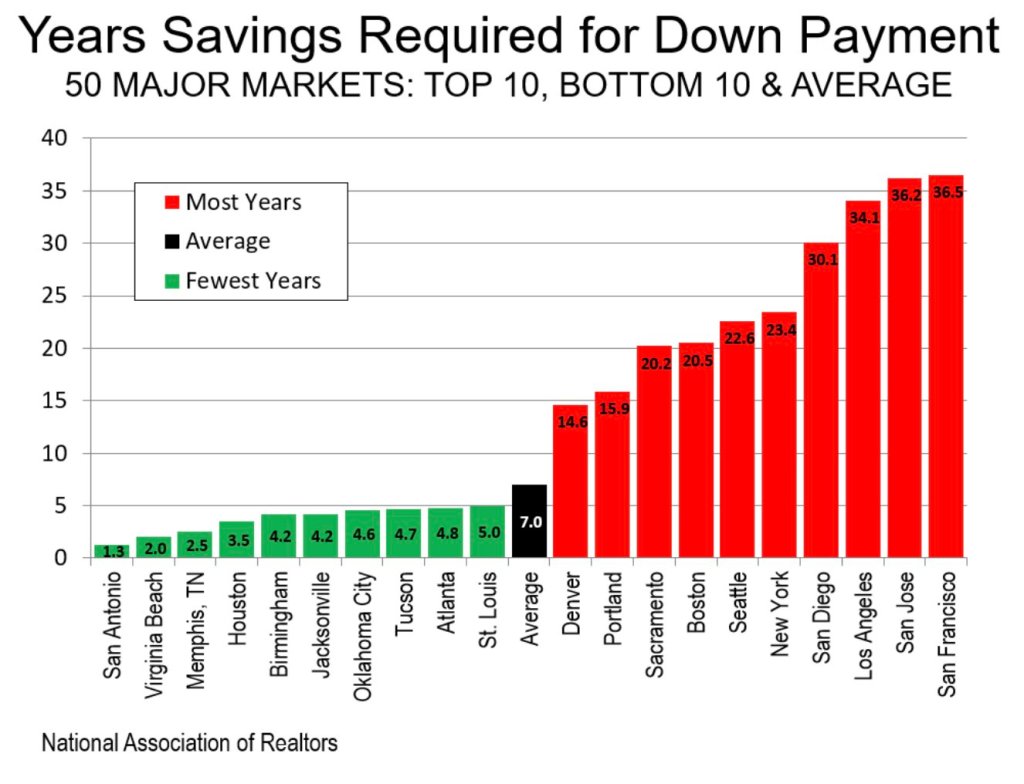
As a result of higher housing prices and mortgage rate (and Gavin Newsom’s ludicrous policies), it will take over 30 years to accumulate enough savings to buy a home in San Diego, Los Angeles, San Jose and San Francisco.
I ain’t drunk, but first-time homebuyers will need to be drunk in this housing market.
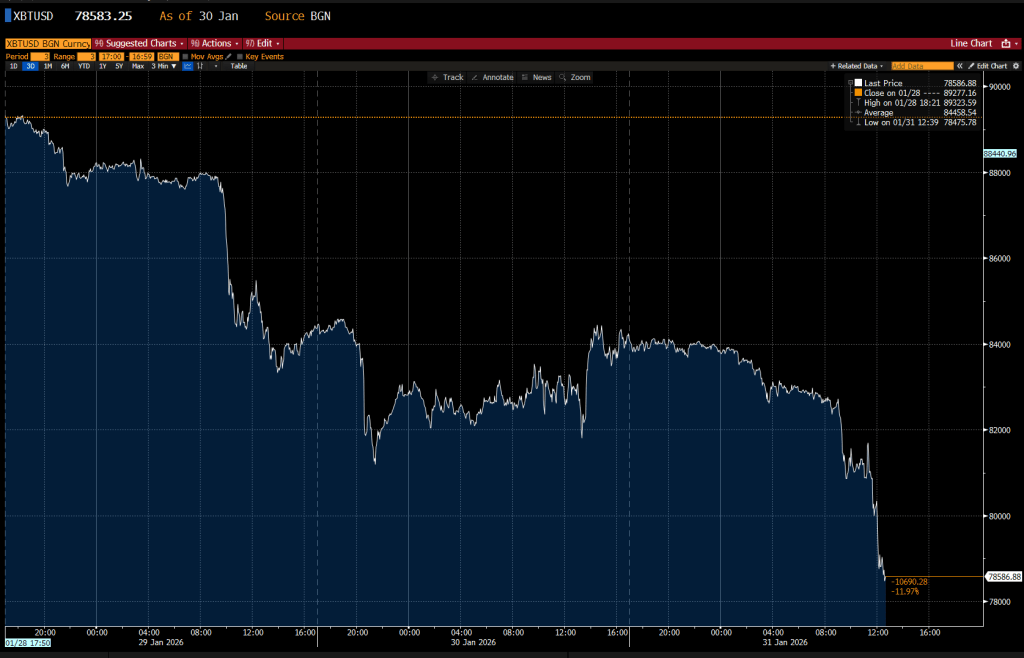
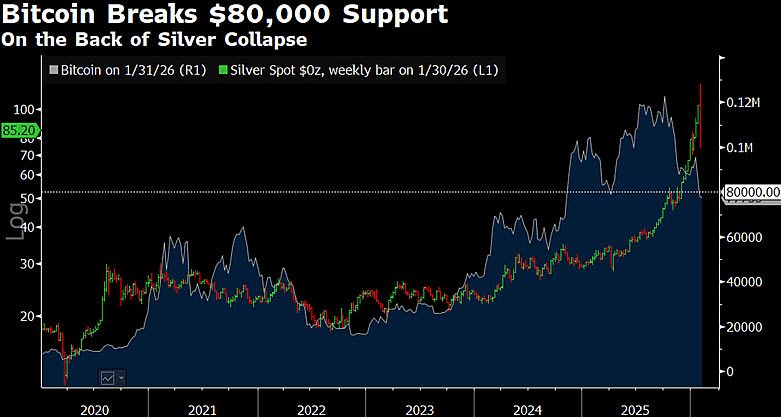
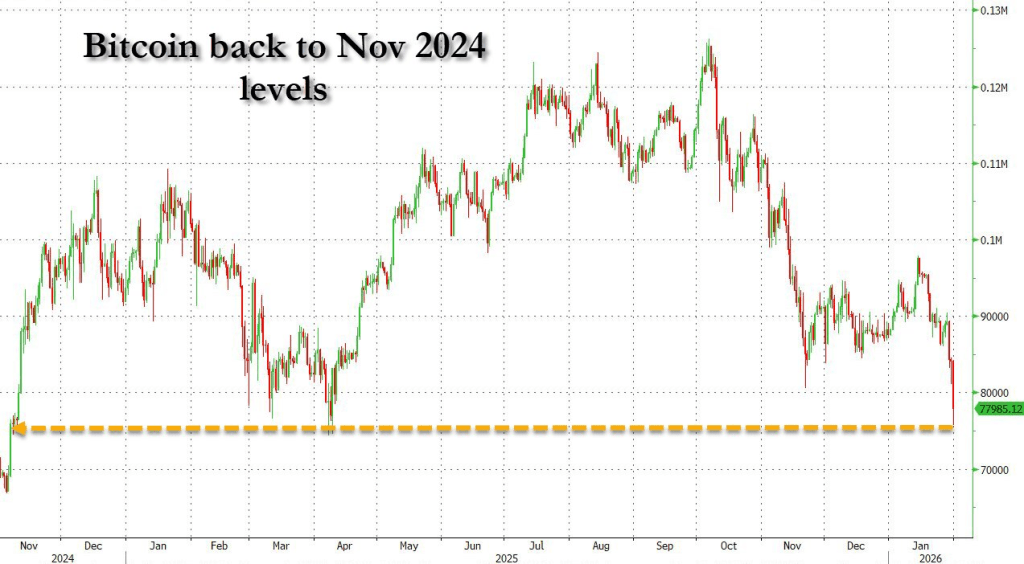
Collapsing crypto and metal prices coupled with a tanking stock market is pointing to EXTREME FEAR.
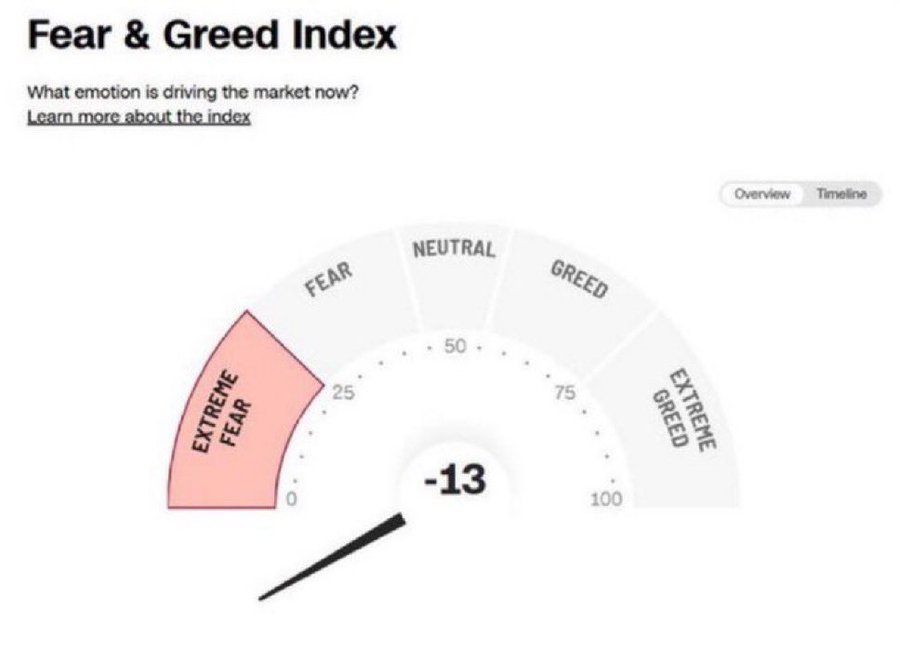
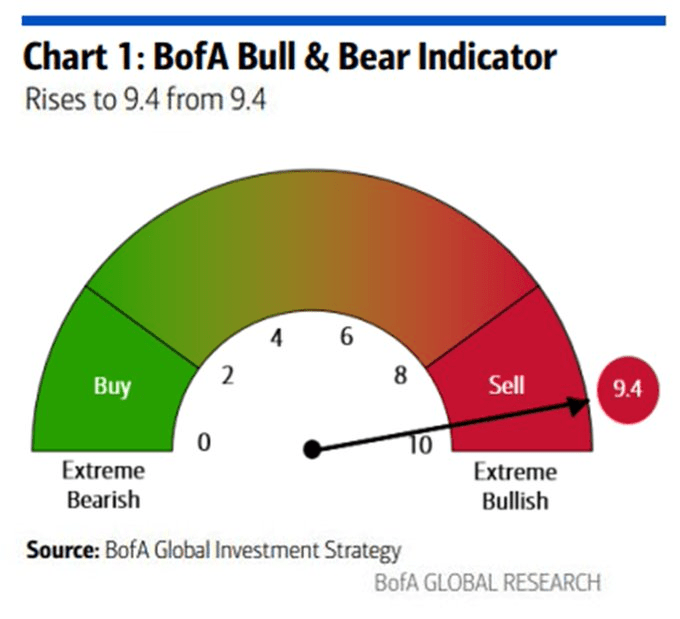
The BofA bull and bear indicator says the same thing.
The realization that government is just a money laundering operation for politicians and that The Fed is just a friend of the big banks says it all.

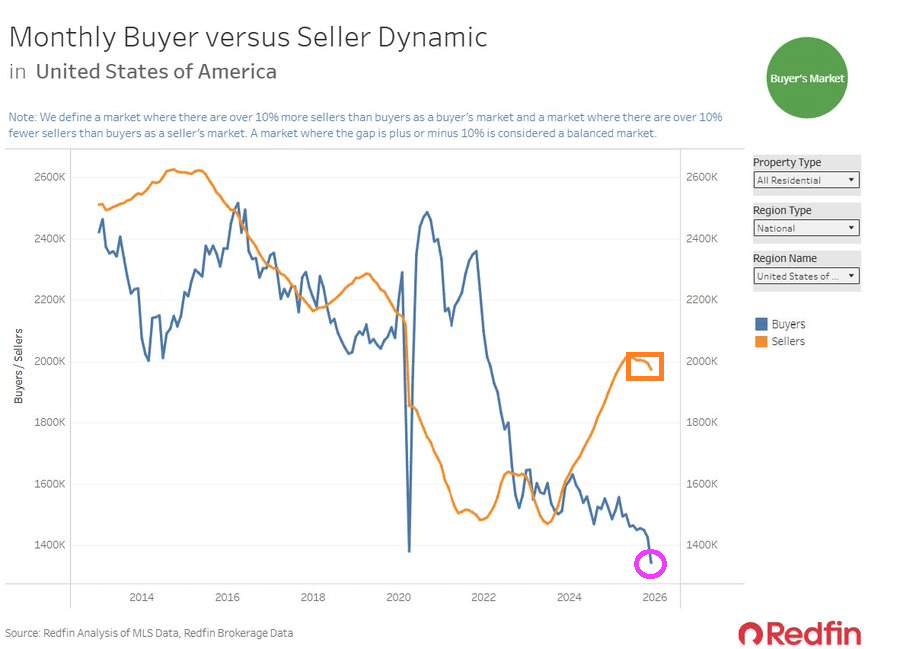
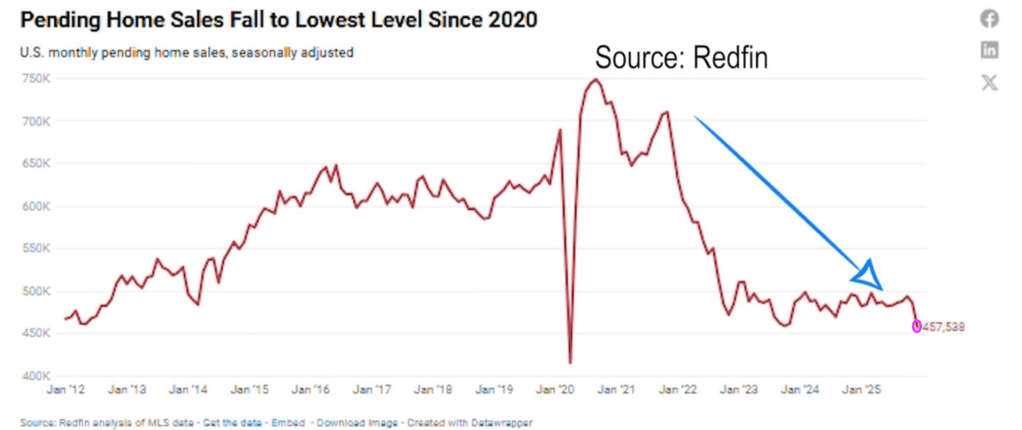
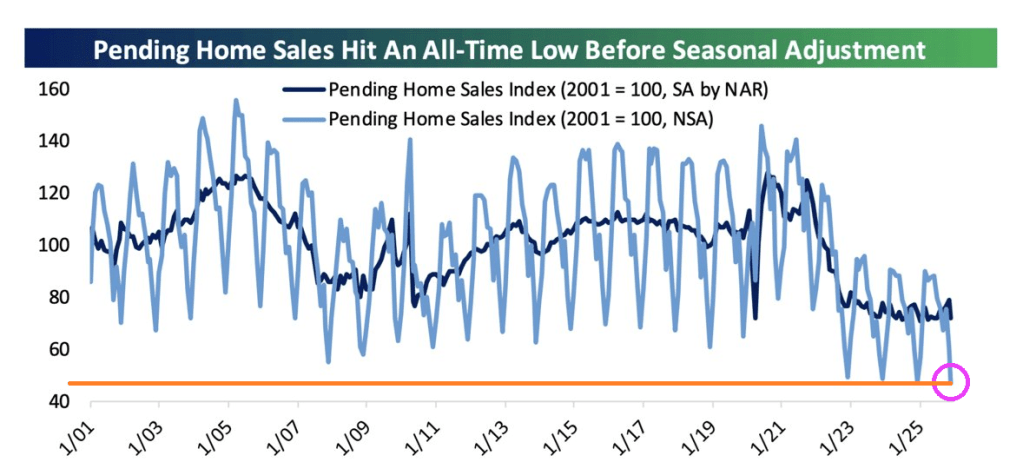
According to Redfin, US pending home sales fell to the lowest since the Covid epidemic of 2020.
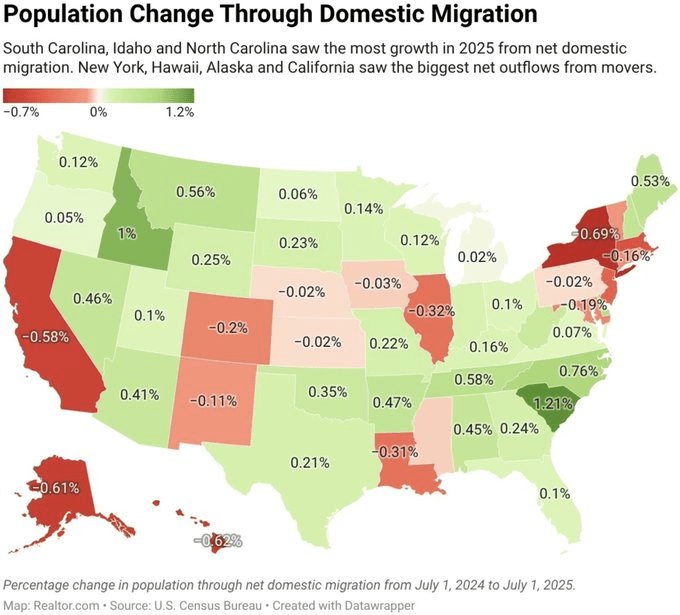
With the population change from state to state, like New York, California and Illinous to South Carolina and Idaho (home of Napolean Dynamite), it is no wonder that the housing market is in a state of turmoil.
Why leave New York? A scene from Mandami’s NYC.

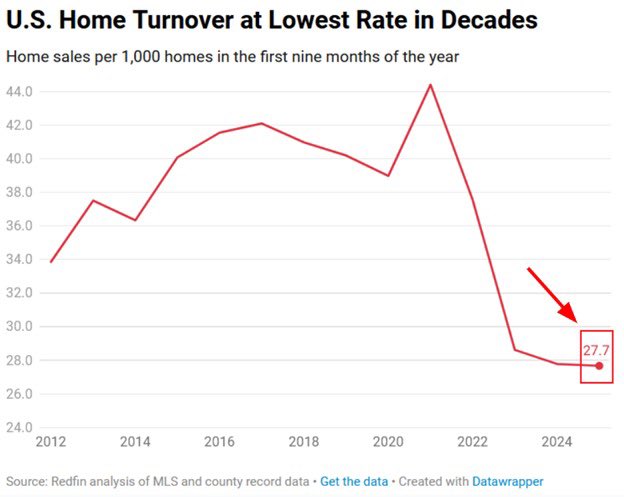
Home prices exploded under Biden and Covid Federal spending. Making housing unaffordable for millions. Now the turnover rates for homes is at its lowesst rate in decades.
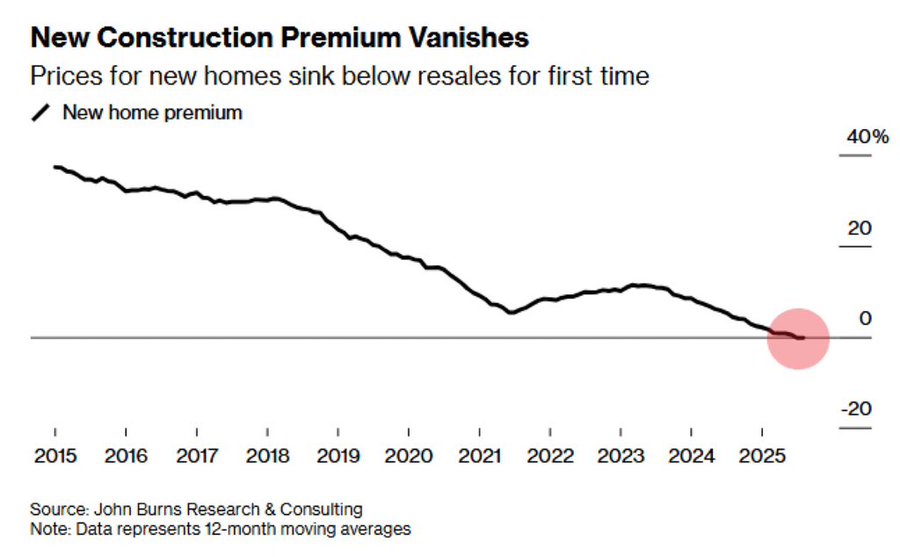
Existing homes are now more expensive than new homes.
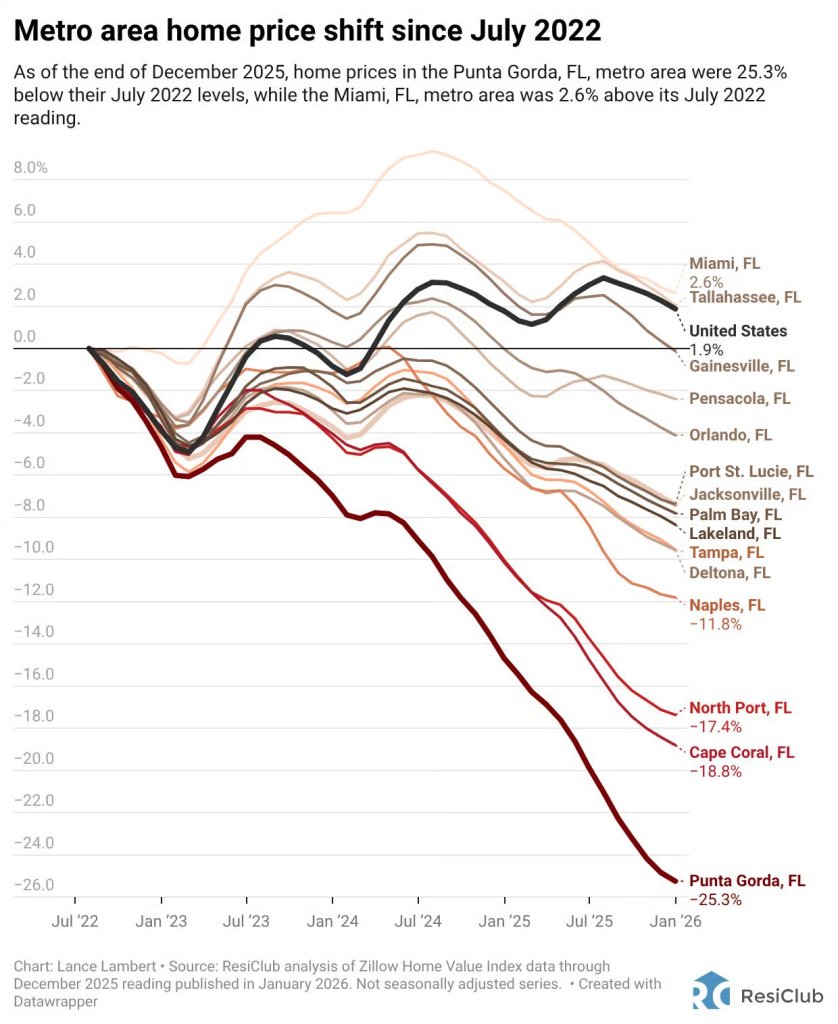
Florida housing is getting gut-punched from Naples to Punta Gorda.
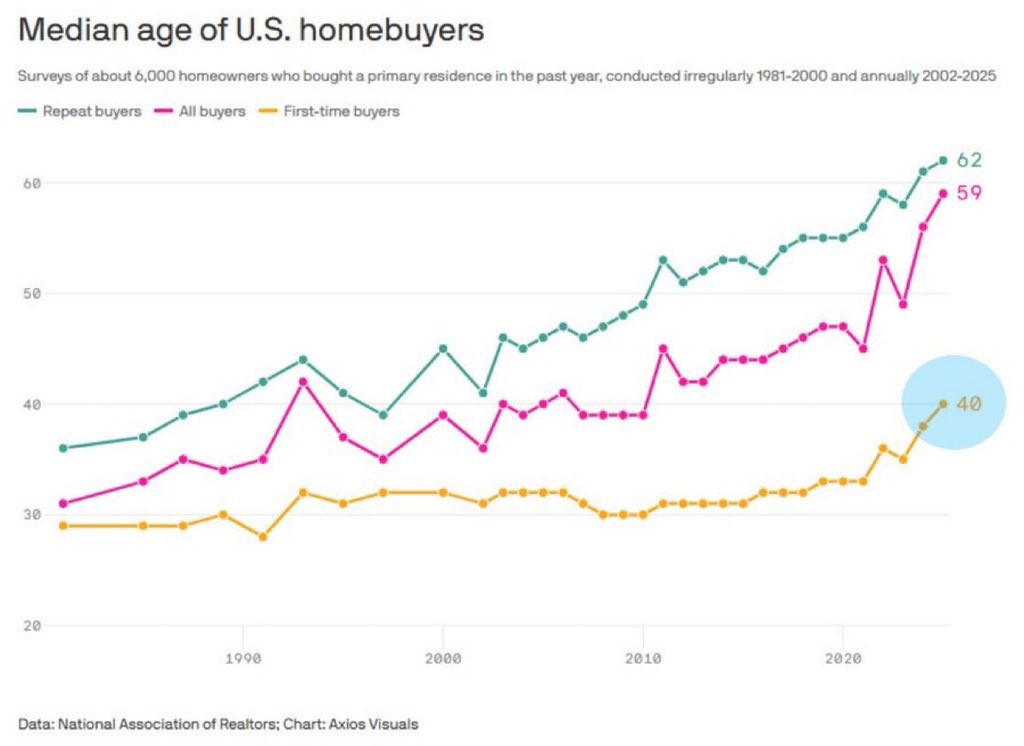
Yikes! Median age of first time homebuyers is 40.
Fortunately, Joe Biden is out of office. But Chuck Schumer may make a comeback and restart the insane Covid-era spending. Schumer, the penultimate knucklehead in Congress, approved Ketanji Brown Jackson to sit on the Supreme Court of the USA.

Keep on printing money. It seems that home price growth requires The Fed to keep printing money.
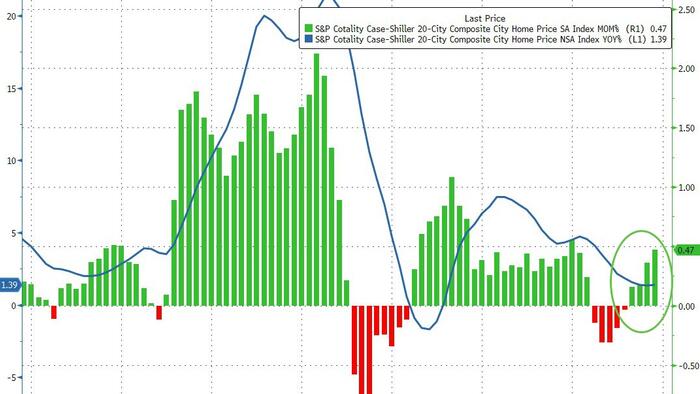
S&P/Case-Shiller released the monthly Home Price Indices for November (“November” is a 3-month average of September, October and November closing prices). September closing prices include some contracts signed in July, so there is a significant lag to this data. Here is a graph of the month-over-month (MoM) change in the Case-Shiller National Index Seasonally Adjusted (SA).
From S&P S&P Cotality Case-Shiller Index Reports Annual Gain In November 2025
From S&P S&P Cotality Case-Shiller Index Reports Annual Gain In November 2025
The S&P Cotality Case-Shiller U.S. National Home Price NSA Index posted a 1.4% annual gain for November, in line with the previous month.
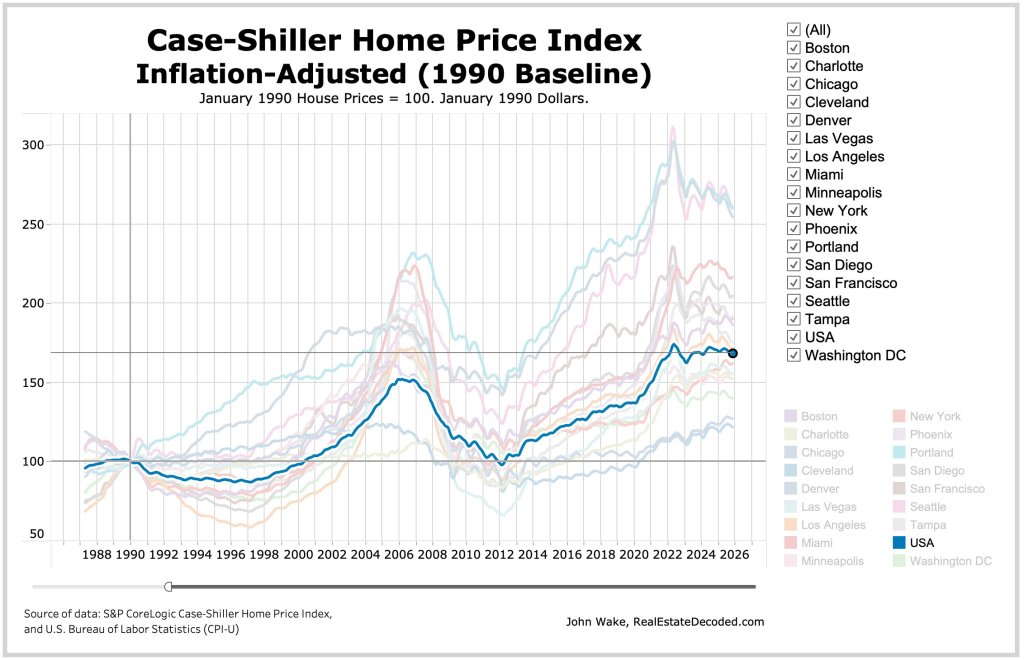
Real home values declined as consumer inflation (2.7%) outpaced the National Index gain (1.4%) by 1.3 percentage points.
Regional divergence persisted: Midwestern and Northeastern markets led by Chicago (+5.7%) and New York (+5.0%) posted gains, while Sun Belt cities including Tampa (–3.9%), Phoenix (–1.4%), Dallas (–1.4%), and Miami (–1.0%) saw declines.
…
“Regional patterns continue to illustrate a stark divergence. Chicago leads all cities for a second consecutive month with a 5.7% year-over-year price increase, followed by New York at 5.0% and Cleveland at 3.4%. These historically steady Midwestern and Northeastern markets have maintained respectable gains even as overall conditions cool. By contrast, Tampa home prices are 3.9% lower than a year ago – the steepest decline among the 20 cities, extending that market’s 13-month streak of annual drops. Other Sun Belt boomtowns remain under pressure as well: Phoenix (-1.4%), Dallas (-1.4%), and Miami (-1.0%) each continue to see year-over-year declines, a dramatic turnaround from their pandemic-era strength.
“Monthly price changes were mixed but leaned negative in November, underscoring persistent softness. On a non-seasonally adjusted basis, 15 of the 20 major metro areas saw prices decline from October (versus 16 declines in the previous month). Only a handful of markets – including Los Angeles, San Diego, Miami, New York, and Phoenix – eked out slight gains before seasonal adjustment. After accounting for typical seasonal slowing, the National Index inched up just 0.4% for the month, indicating that price momentum remains muted.
…
The S&P Cotality Case-Shiller U.S. National Home Price NSA Index, covering all nine U.S. census divisions, reported a 1.4% annual gain for November. The 10-City Composite showed an annual increase of 2.0%, up from a 1.9% increase in the previous month. The 20-City Composite posted a year-over-year increase of 1.4%, up from a 1.3% increase in the previous month.
…
The pre-seasonally adjusted U.S. National Index saw a drop of 0.1% and the 20-City Composite Index fell 0.03%, while the 10-City Composite Index increased 0.1%.
After seasonal adjustment, the U.S. National Index reported a monthly increase of 0.4%, and both the 10-City Composite and 20-City Composite Indices posted month-over-month gains of 0.5%.
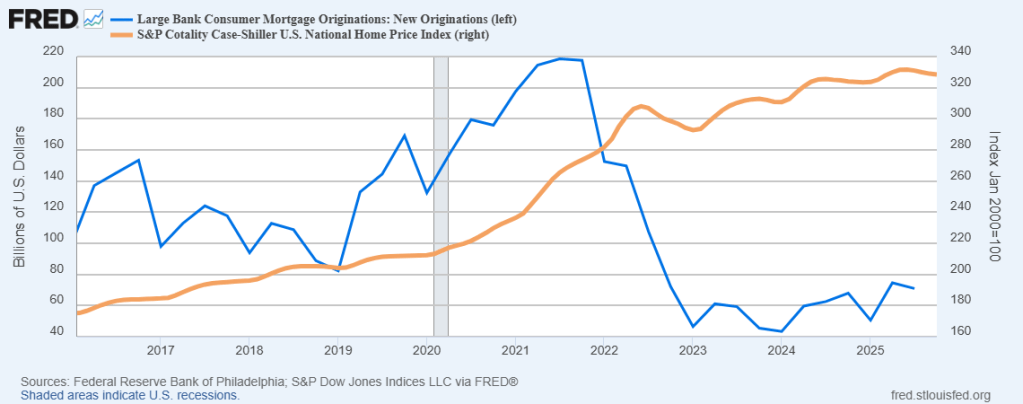
Like The Talking Heads song “Life During Wartime,” we are dealing with the mortgage market affer Covid. What happened? Mortgage originations plunged after mortgage rates (red line) soared.
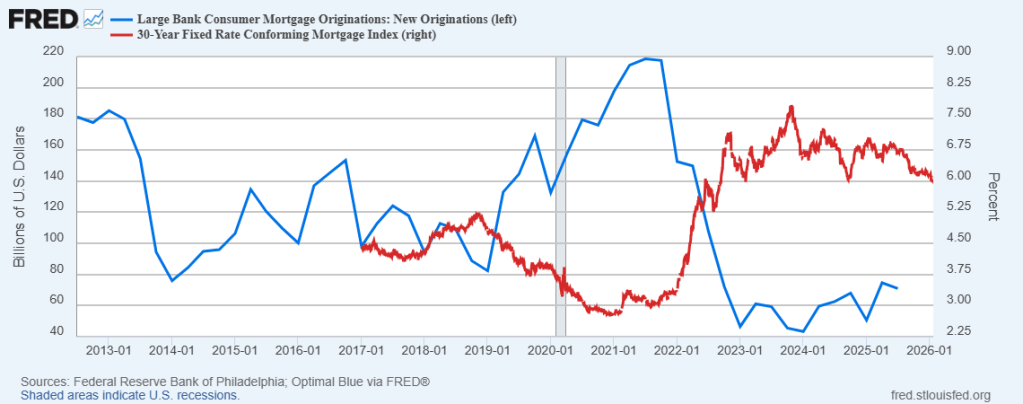
In addition, insane Federal spending levels caused housing prices to soar.
‘Stay warm!

Whip it! Will Powell and The Fed whip rates lower?
Bill Pulte has failed so far in making housing affordable. And don’t get me started on The Feral Reserve.
As a consequence of high home prices and relatively high mortgage rates, pending home sales have hit an all-time low.
Gone are the days of Janet Yellen and ZIRP (zero interest rate policies).


You must be logged in to post a comment.