Tavi Costa at Crescat Capital (founded by my former MBA student at University of Chicago Kevin Smith) produced this excellent chart of silver prices showing the cup and handle of silver prices.
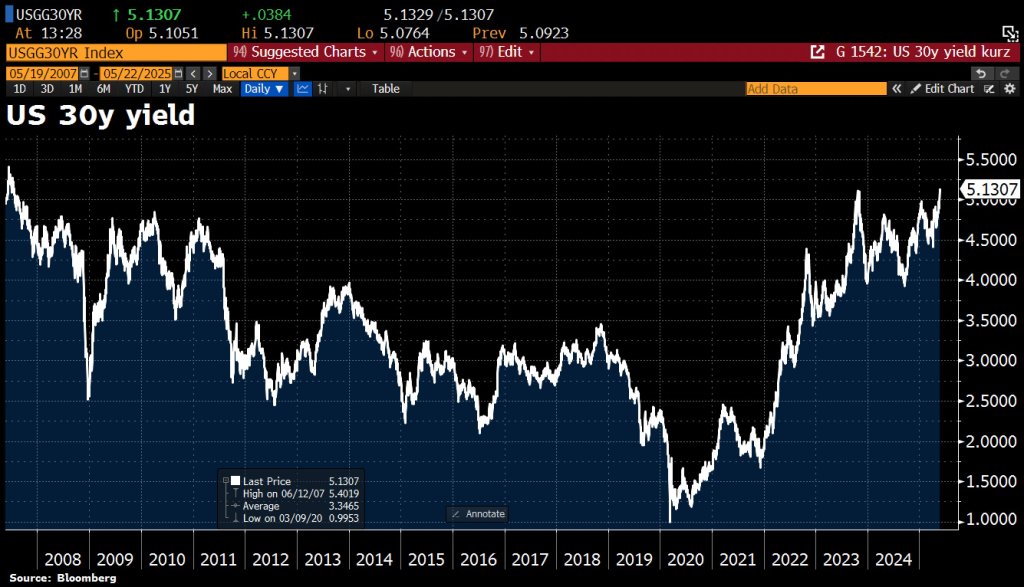
The rise in silver prices corresponds with a deterioration of the US bond market. Look at Treasury futures courtesy of Bravos Research.
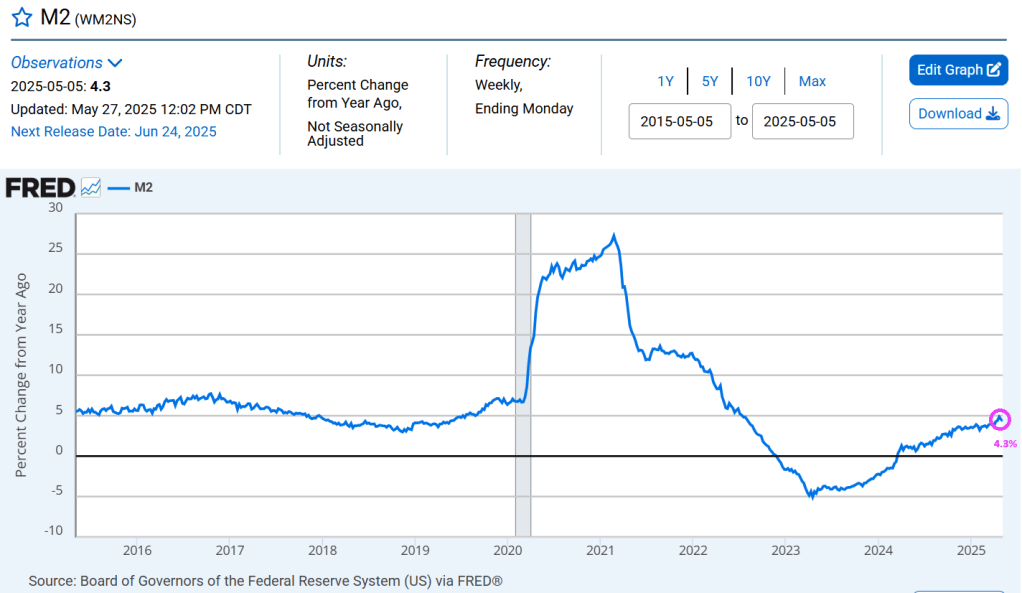
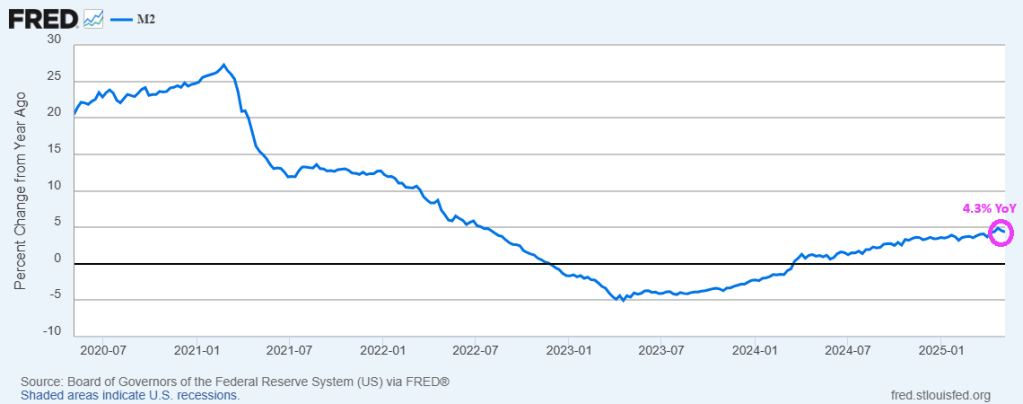
Of course, Washington DC’s insane spending has led to insane money printing by The Feral Reserve.
Everyone in Washington DC deserves a “Silver Cup of Failure” for uncontrolled government waste and spending and mismanagement by The Feral Reserve.
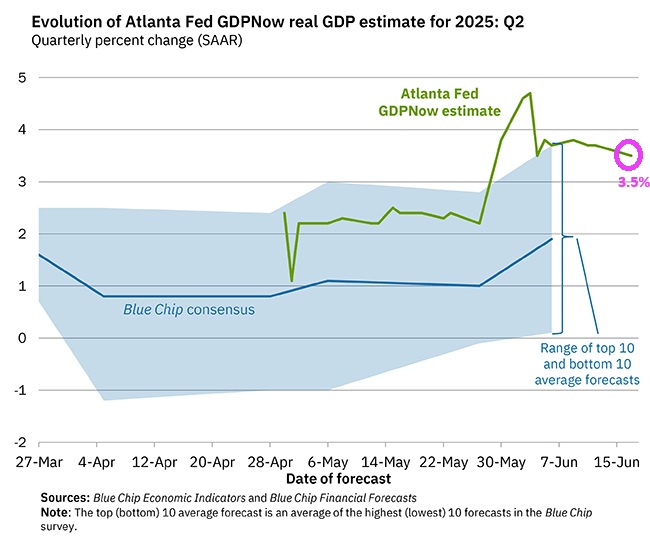
So much for the doom porn from the media about the US economy collapsing due to Trump’s tariffs! The US economy (real GDP) in Q2 is still growing at 2.9%.
The GDPNow model estimate for real GDP growth (seasonally adjusted annual rate) in the second quarter of 2025 is 2.9 percent on June 27, down from 3.4 percent on June 18. After recent releases from the US Census Bureau and the US Bureau of Economic Analysis, an increase in the nowcast of the contribution of net exports to second-quarter real GDP growth from 2.07 percentage points to 3.49 percentage points was more than offset by a decrease in the nowcasted GDP growth contribution of inventory investment from -0.42 percentage points to -2.22 percentage points.
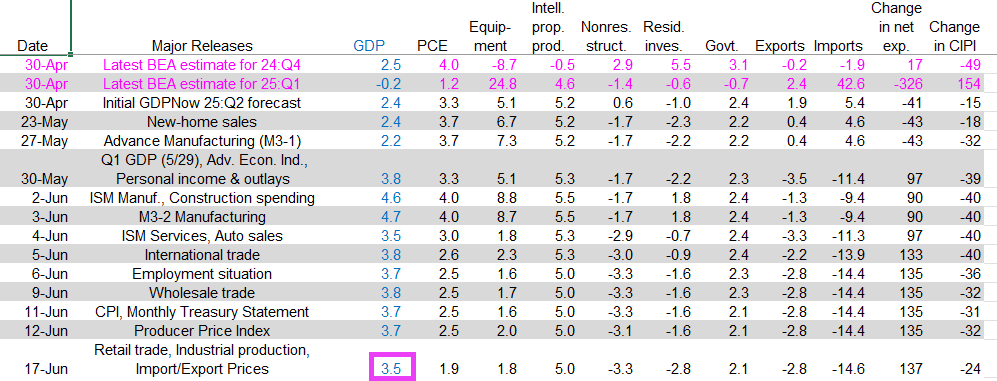
Here is the data.
And with Democratic Socialist (aka, Communist) Zohran Mamdani winning the Democratic nomination for mayor, New York City will likely become the new Detroit.
The GDPNow model estimate for real GDP growth (seasonally adjusted annual rate) in the second quarter of 2025 is 3.5 percent on June 17, down from 3.8 percent on June 9. After recent releases from the US Census Bureau, the US Bureau of Labor Statistics, the Federal Reserve Board of Governors, and the Treasury’s Bureau of the Fiscal Service, the nowcasts of second-quarter real personal consumption expenditures growth and second-quarter real government expenditures growth decreased from 2.5 percent and 2.3 percent, respectively, to 1.9 percent and 2.1 percent, while the nowcast of second-quarter real gross private domestic investment growth increased from -1.9 percent to -1.4 percent.
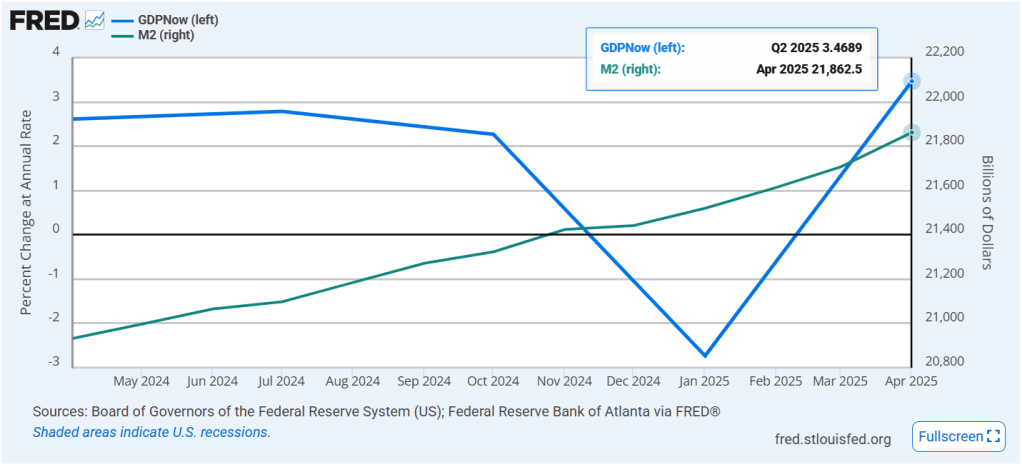
GDP growth corresponds to Fed money printing.
Here is the breakdown. True, real GDP growth has been slowing over June.
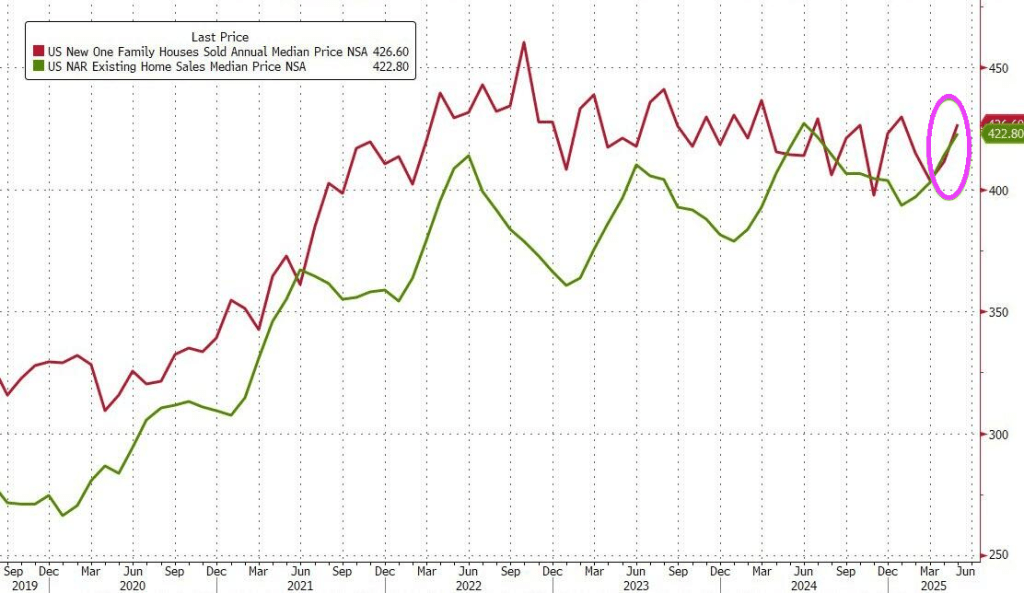
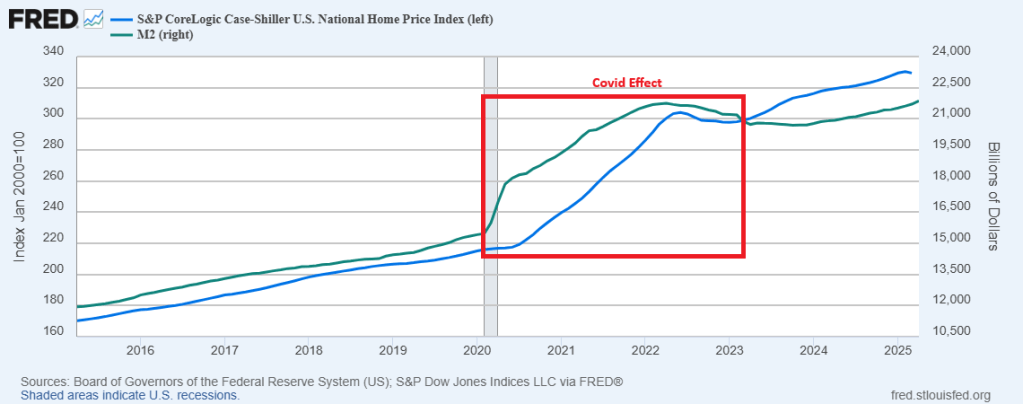
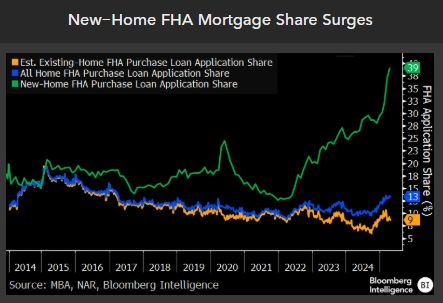
Thanks a lot Fed! Home prices rose dramatically after Covid as The Fed printed billions of dollar of currency (M2). Making housing unaffordable for much of America.
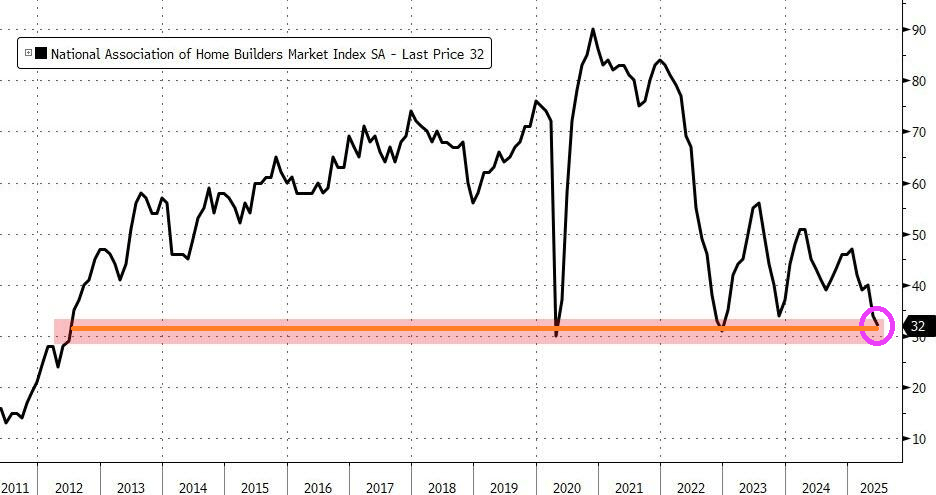
As a result of higher mortgage rates and higher home prices, homebuilder confidence is at a 13 year low (back to 2012).
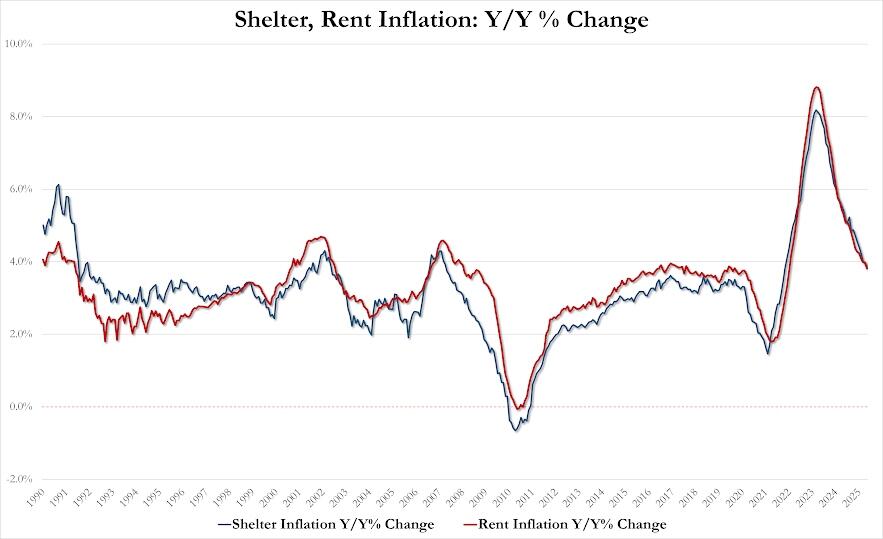
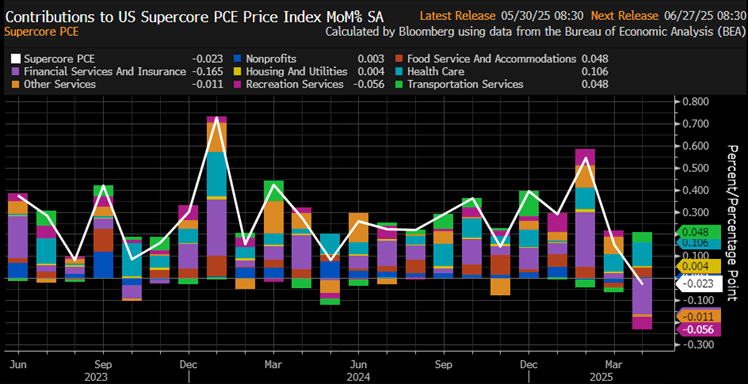
May Rent inflation 3.81% YoY, down from 3.98% in April, lowest since Jan 2022.
May Shelter inflation 3.86% YoY, down from 3.99% in April, lowest since Nov 2021
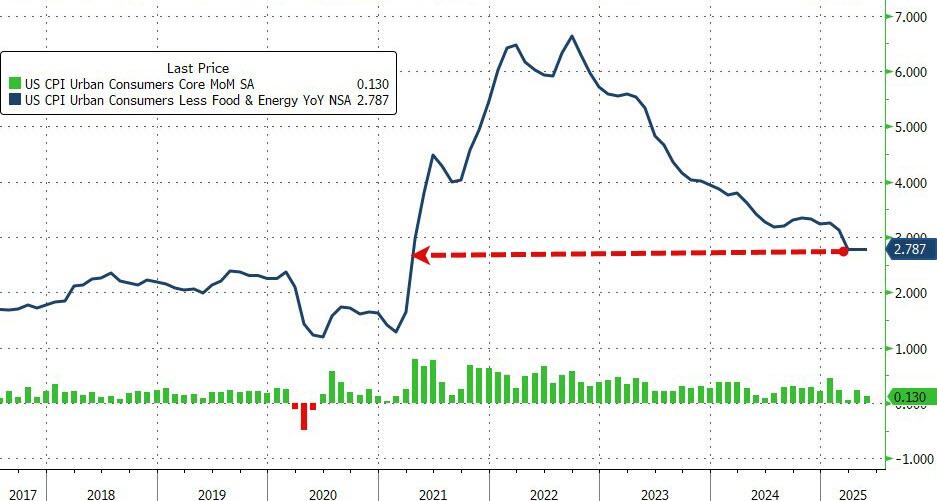
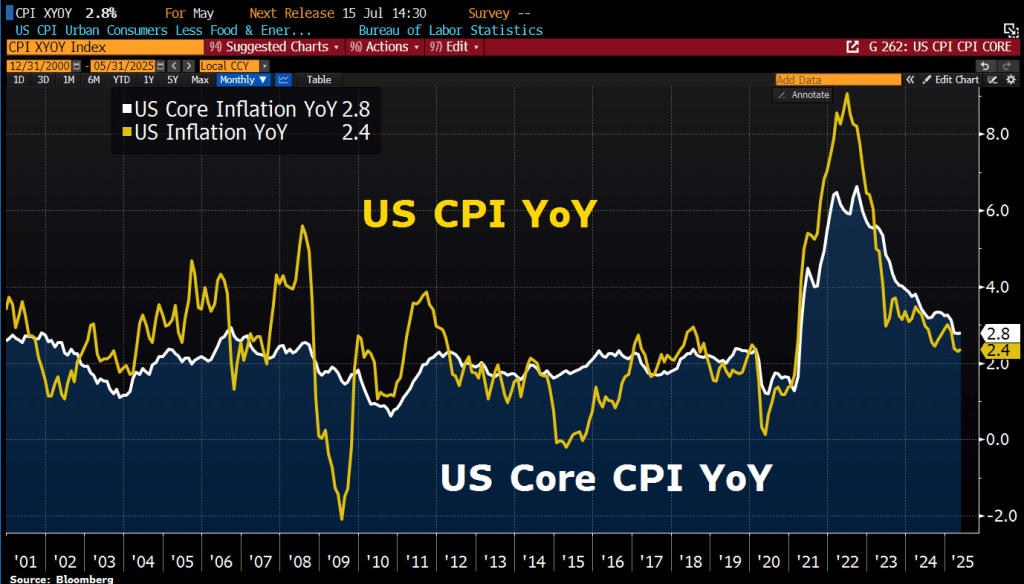
In general, CPI increased 0.1% MoM after rising 0.2 percent in April; Over the last 12 months, the all items index increased 2.4 percent before seasonal adjustment. The index for all items less food and energy rose 0.1% in May, following a 0.2% increase in April.
The index for shelter rose 0.3% in May and was the primary factor in the all items monthly increase. The food index increased 0.3% as both of its major components, the index for food at home and the index for food away from home also rose 0.3% in May.
In contrast, the energy index declined 1.0% in May as the gasoline index fell over the month.
Indexes that increased over the month include medical care, motor vehicle insurance, household furnishings and operations, personal care, and education.
The indexes for airline fares, used cars and trucks, new vehicles, and apparel were among the major indexes that decreased in May.
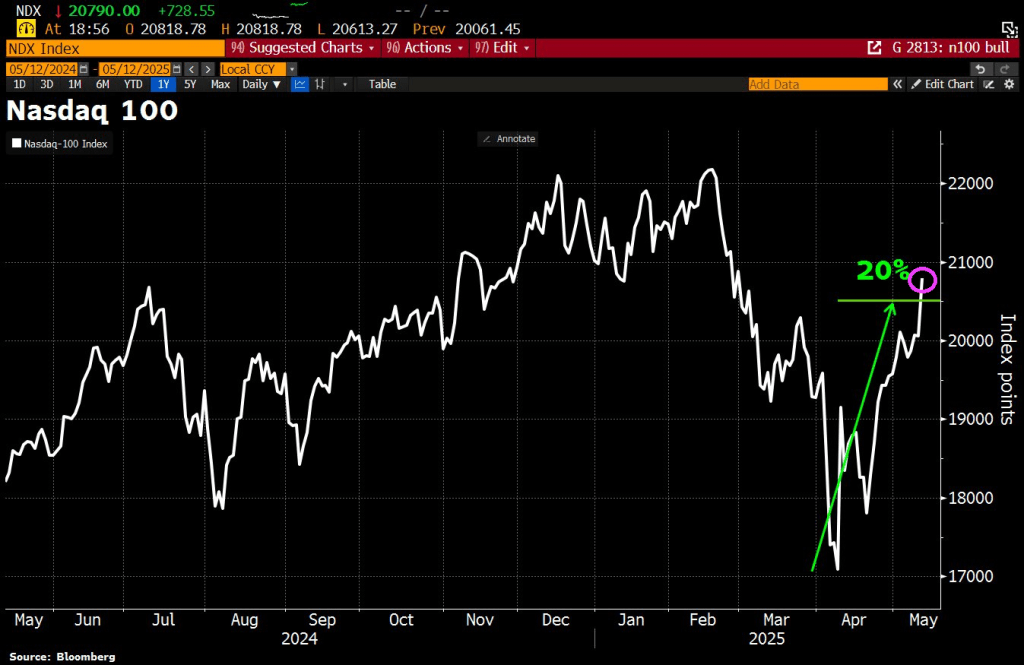
Well, U.S. and China reached an agreement to lower tariffs in a 90-day cool-off period. Despite China claiming they would NEVER agree to tariffs! The result? The NASDAQ 100 rose to its highest level since mid-February.


You must be logged in to post a comment.