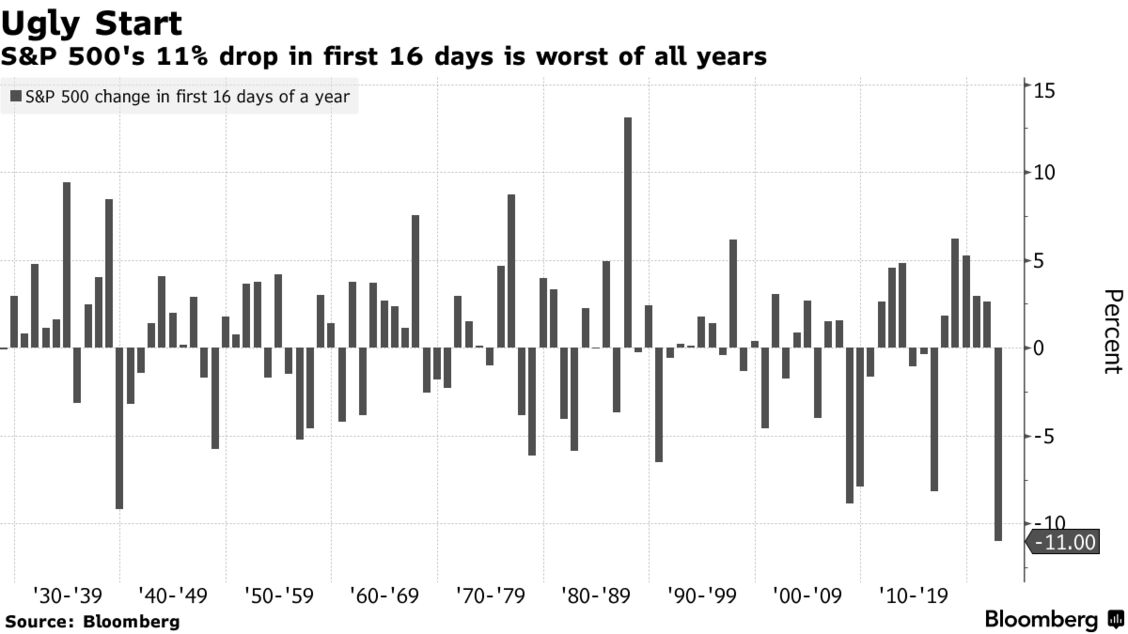
The stock market has never started a year falling as quickly as it is now.
The S&P 500 has dropped 11% — heading into correction territory — in the first 16 trading days of 2022 in its worst-ever start to a year, according to Bloomberg data that goes back over nine decades.
The downturn comes as traders brace for the Federal Reserve to tighten monetary policy and a surge in U.S. Treasury yields weighs on the outlook for stocks. A host of technical signals also suggest that more volatility may be coming up ahead.
“The Fed pulled the punchbowl, liquidity has evaporated, and the S&P and NDX broke below their 200dma for the first time since the Covid outbreak,” said Rich Ross, technical strategist at Evercore ISI.
A bear market down to the 3,800 level is likely for the S&P 500, Ross said, given “the dramatic erosion of the technical backdrop, in conjunction with the highest inflation, tightest policy, and most uncertain political and geopolitical condition in years” — not to mention its historic rally since 2020.
The Shiller CAPE ratio is extremely high …. not surprising how much air The Fed pumped into the market tires.
2021 has been a very weird year. Inflation has boomed (highest in 40 years) after the election of Joe Biden as President of the USA (call it Bidenflation). Then we have The Federal Reserve barely acting on the booming inflation (keeping rates at 25 basis points while withdrawing the COVID-related monetary stimulus).
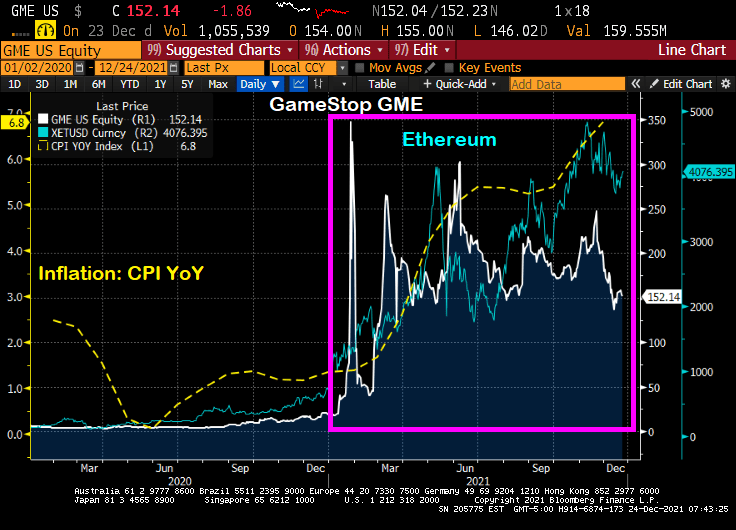
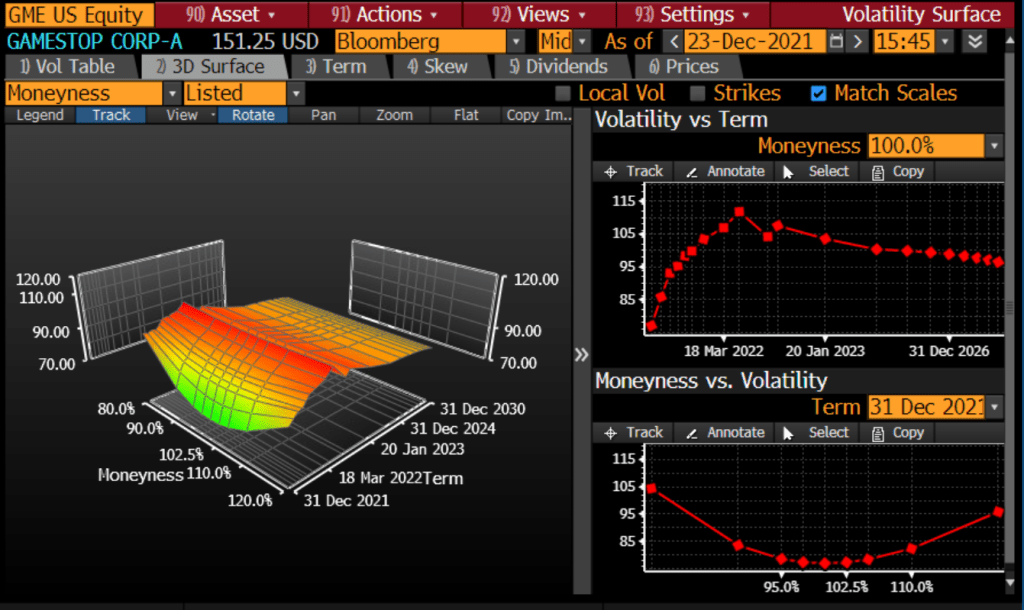
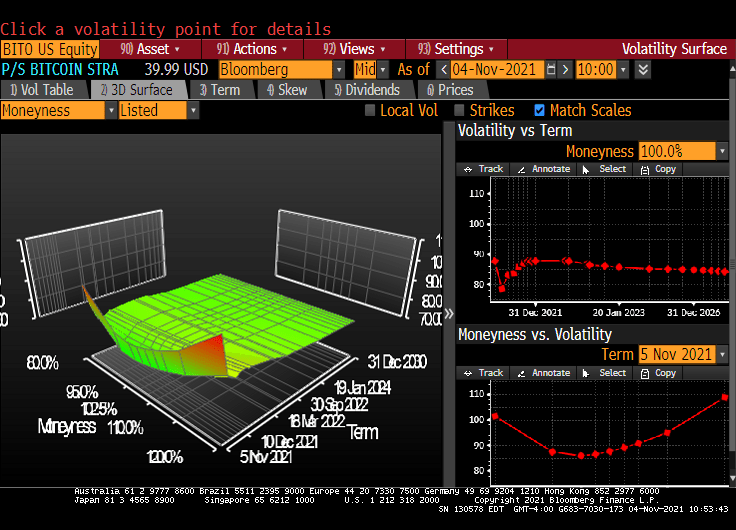
Given the volatility of GameStop (Reddit-inspired), you can see the strange shape of GameStop’s volatility surface.
By contrast, gold is now where it was was at the beginning of 2021 and the surge of Bidenflation.
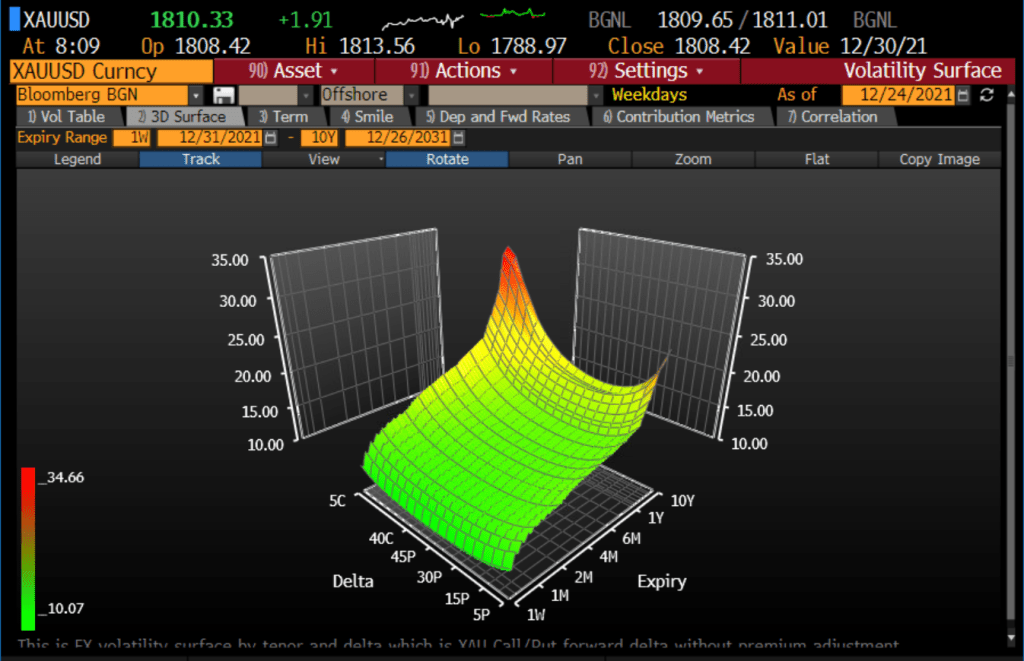
Here is volatility surface for gold.
So, there are a number of meme stocks (GameStop is just one example), gold, silver, cryptos such as Bitcoin and Ethereum. But gold seems to be placid with respect to inflation, but the meme stocks and cryptos seem to be motoring. Or is it rage against the financial machine? Or rage against Bidenflation??
The US stock and bond markets are closed today and tomorrow, Christmas day.
Have a Merry Christmas! And celebrate the “Santa Pause” as Powell refuses to raise rates to combat inflation until 2022.
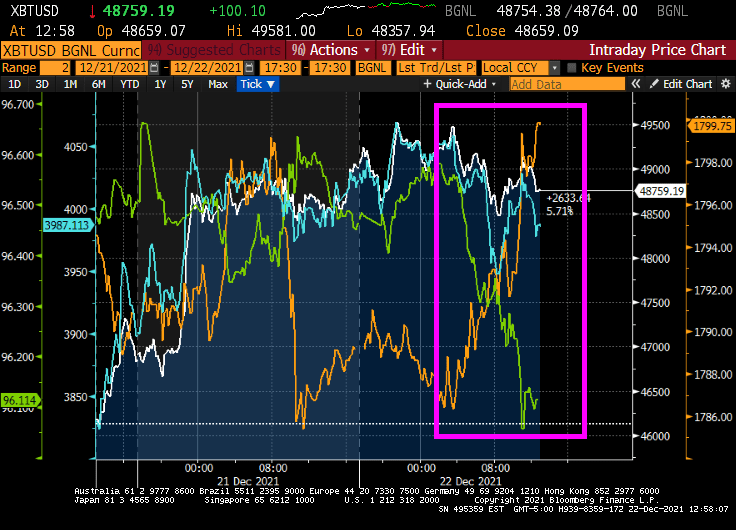
With just three days until Christmas, we are seeing gold (gold line) rise, the US Dollar (green line) fall and the major Crytos Bitcoin and Ethereum remain quiet.
And the US Treasury 10Y-2Y slope is back to where is started when Biden was elected.
The University of Michigan consumer survey numbers are out tomorrow. Let’s see how they look. Or will they simply be anticipating Michigan playing Georgia in the Orange Bowl??
The U.S. is poised to enter Year Three of the pandemic with both a booming economy and a still-mutating virus. But for Washington and Wall Street, one Covid aftershock is starting to eclipse almost everything else.
Already-hot inflation is forecast to climb even further when November data comes out on Friday, to 6.8%. That would be the highest rate since Jimmy Carter was president in the early 1980s — and in the lifetimes of most Americans.
And the CPI change since last year, according to the Federal Reserve of St Louis FRED is a staggering 16.262%.
And with U.S. Jobless Claims plunge to 52-year low, its about time that The Fed begins removing the humongous monetary stimulus.
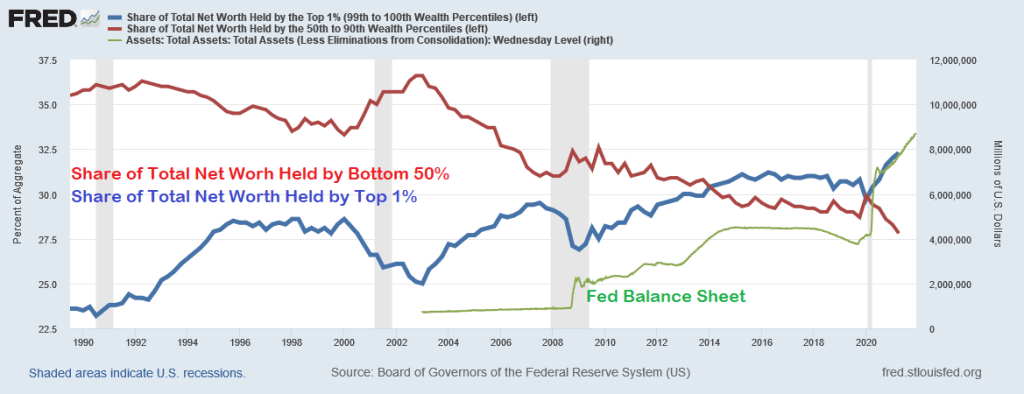
After all, largely thanks to Federal Reserve policies, we have seen the greatest wealth redistribution in US history … to the top 1%.
As The Federal Reserve tries to drain-off the extraordinary growth in its balance sheet since COVID without raising its target rate (good luck with that!), it is time to appraise where we are sitting. First, liquidity.
(Bloomberg) Buying and selling large quantities of U.S. government debt without substantially moving the market is about the hardest it’s been since the pandemic sent markets reeling in March 2020. Volatility has jumped, failed trades have increased — and Wall Street analysts warn that the Federal Reserve’s exit from bond-buying is set to make matters worse.
When markets seized up last year, liquidity in most Treasuries vanished, forcing the Fed to embark on massive asset purchases and other measures to avert a full meltdown. Now, the U.S. central bank is scaling back that buying, which has targeted the least-liquid Treasuries, and is poised to quicken the wind-down. At the same time, new government borrowing is ebbing, with the combination setting the stage for more fireworks.
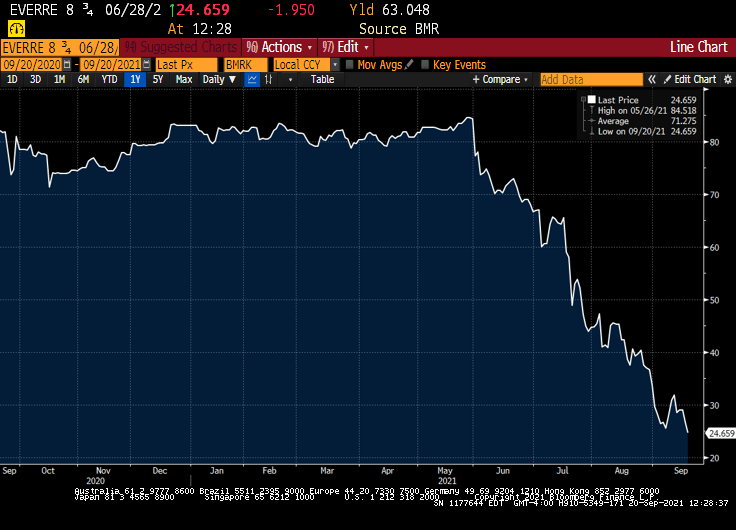
OK, liquidity isn’t as bad as COVID and March 2020, but it is near the highest level since March 2020. The question is … will the numerous asset bubbles around the globe burstLet’s look at the ongoing saga of Chinese conglomerate Evergrande (mainly known as a large real estate developer). Their 8.25% bond has plunged to $23.481 on speculation of a catastrophic default on their bond payments. Then we have Invesco’s Golden Dragon China ETF (measuring a diversified market cap of US-listed companies headquartered or incorporated in China & derive a majority of their revenues from the People’s Republic of China). This ETF has crashed and burned back to pre-COVID (and Stimulytpo) levels.
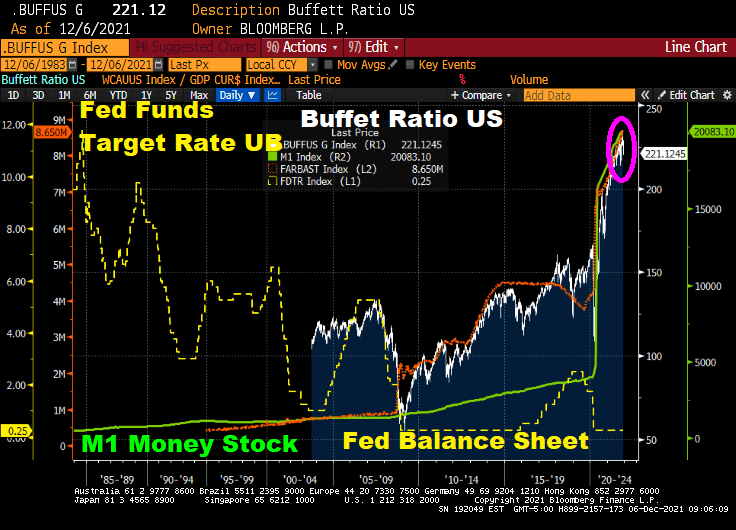
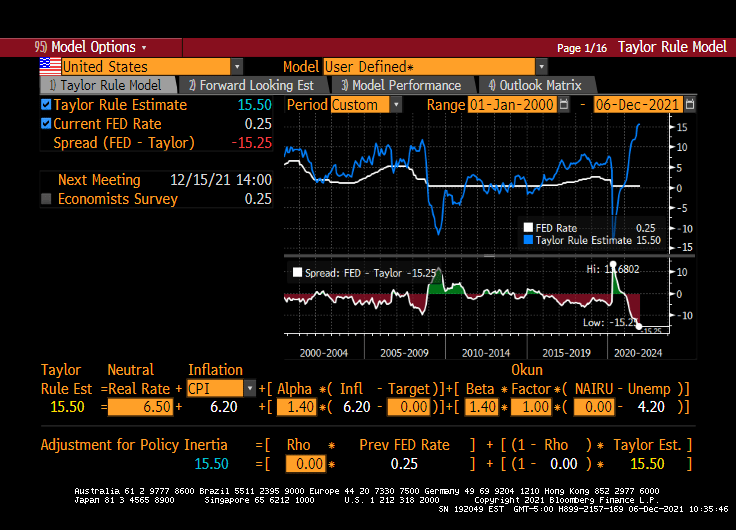
Speaking of cracks, how will the Buffett Ratio US react to a reduction in The Fed’s balance sheet (orange line) and M1 and M2 Money stock? Given that the Fed Funds target rate is WAY below where it should be (according to the Taylor Rule).
As I mentioned yesterday, the Shiller CAPE ratio is at its highest level since the Dot.com debacle of 2000. How will the Shiller CAPE ratio react to The Fed’s tapering?
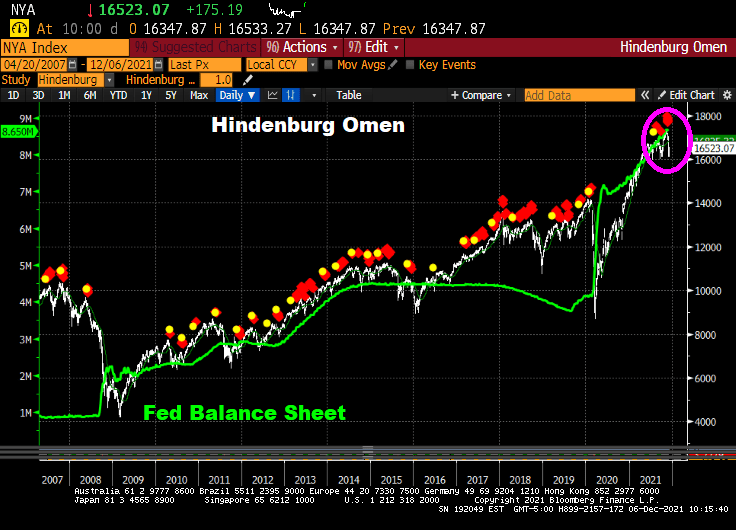
Even the Hinderburg Omen is flashing red … again.
Now, the Dow is up 600 points today, primarily on the news that the Omicron Variant is about as harmful as the common cold.
A major shift is underway at the Federal Reserve to begin to remove the central bank’s massive pandemic easing policies, and could see it hike rates sooner than is priced in by markets.
Comments by Fed officials suggest the central bank is likely to decide to double the pace of its taper to $30 billion a month at its December meeting next week. Initial discussions could also begin as soon as the December meeting about when to raise interest rates and by how much next year with Fed officials set to submit a fresh round of economic forecasts and projections for the fed funds rate.
There is no consensus yet on when to begin hikes, but it’s clear that the faster taper is designed to give the Fed flexibility to raise rates as soon as the spring. The markets do not appear to expect the first rate hike until the summer of 2022.
Uh-huh. Let’s see what happens when and if The Fed starts to taper. Is economic growth so strong that it can continue without Federal Stiumulypto? THAT is the right question.
Look at the above charts and tell me if The Fed will actually raise their target rate more than twice. Despite the Taylor Rule suggest a target rate of 15.50% to cool inflation.
The latest scare hitting financial markets is the Omicron Variant (or Oh! Macron! Variant in France). While it caused an initial decline in global equity markets {Dow fell 900 points on early reports on Omicron), the Treasury market has been relatively unscathed.
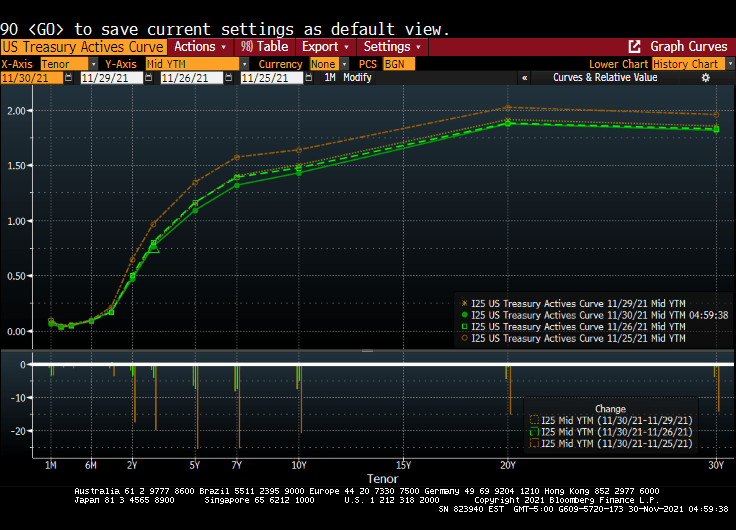
For example, the US Treasury Actives curve dropped last Friday (the orange line represents the Wednesday before Thanksgiving), while the remaining three lines represent last Friday, Monday and Tuesdays (today). In other words, the US Treasury Actives curve has been quiet so far this week after Friday’s flattening.
The US Dollar Swaps curve shows the same dynamics. The dark blue line is last Wednesday, while the remaining lines are last Friday, this Monday and today. Not a lot happening after the initial Omicron fear factor was priced in.
Federal Reserve Chairman Jerome Powell believes that the omicron variant of Covid-19 and a recent uptick in coronavirus cases pose a threat to the U.S. economy and muddle an already-uncertain inflation outlook.
“The recent rise in COVID-19 cases and the emergence of the Omicron variant pose downside risks to employment and economic activity and increased uncertainty for inflation,” Powell said in remarks he plans to deliver to Senate lawmakers on Tuesday. “Greater concerns about the virus could reduce people’s willingness to work in person, which would slow progress in the labor market and intensify supply-chain disruptions.”
Do I detect FEAR in Powell’s voice? The odds of rate increases for next year just fell to one rate increase at the September 2022 meeting.
On the equity side, it seems to be all about whether The Fed will withdraw its support. Back in early 2018, then Fed Chair Janet Yellen and the FOMC started to shrink the Fed balance sheet (green line). This resulted in the “Smart Money Index” declining. The S&P 500 index received a jolt with the Fed stimulus around the COVID outbreak and have taken off like a jackrabbit. Despite the Smart Money Flow index being lower than in 2017.
So, is Omicron the “planet killer” or just another mild flu-like outbreak? The data is pointing towards the latter, but FEAR may cause it to be a bigger deal than is warranted.
Federal Reserve Chair Jerome Powell sounded a note of heightened concern over persistently high inflation as he made clear that the central bank will begin tapering its bond purchases shortly but remain patient on raising interest rates.
“The risks are clearly now to longer and more persistent bottlenecks, and thus to higher inflation,” Powell said Friday during a virtual panel discussion hosted by the South African Reserve Bank and moderated by Bloomberg’s Francine Lacqua.
“I would say our policy is well-positioned to manage a range of plausible outcomes,” he said. “I do think it’s time to taper and I don’t think it’s time to raise rates.”
Good luck with that, Jay! You are going to raise the short-end of the yield that will lead to a flattening of the Treasury yield curve. But you are going to continue to buy Treasuries and Agency MBS in order to monetize the rampant spending by Congress and the Biden Administration? C’mon man!
You can see where Powell spoke today. It is when gold tanked along with the 10-year Treasury yield. Both rebounded a bit, but the 10-year Treasury yield continue its fall to 1.6324%.
The US dollar (green) fell when Powell opened his pie-hole. But Bitcoin (blue) fell in advance as if they knew what Powell was going to say.
(Bloomberg) — The S&P 500 Index extended its decline past 2% Monday afternoon amid growing investor jitters about China’s real estate crackdown potentially sparking a financial contagion. And the Hang Seng fell 3.30% overnight.
The benchmark gauge was down 2.1% as of 12:08 p.m. in New York. All of the 11 major industry groups declined, with the energy, financials and materials sectors leading the losses. The tech-heavy Nasdaq 100 index slumped 2.4%, while the blue-chip Dow Jones Industrial Average retreated 1.9%.
By 2:33pm, the Dow is down 2.55%, NASDAQ down 3.15%.
Volatility also soared, with the Cboe Volatility Index — often called Wall Street’s “fear index” — jumping as much as 29% to 26.75, the highest level in over four months.
“While the Evergrande situation is front and center, the reality is, stock market valuations are overstretched and the market has enjoyed too long of a break from volatility and Monday’s stock market declines are not surprising,” said David Bahnsen, chief investment officer at the Bahnsen Group, a wealth management firm.
As Evergrande bonds continue to tank.
Meanwhile, most commodity prices are falling … except for UK Natural Gas Futures which are up 16.5%!
Since the original model of The Federal Reserve was to purchase Treasuries and Agency MBS in an effort to push down interest rates, it will be quite difficult to delink the two: taper the balance sheet while not raising short-term rates.
(Bloomberg) — Bond investors may not wait long to start pushing back against Federal Reserve Chair Jerome Powell’s efforts to delink the start of asset-purchase tapering from the countdown to eventual policy-rate hikes.
Since Powell last week said the central bank could begin reducing its monthly bond buying this year, traders have stuck with early 2023 as the likely timing for the Fed’s liftoff from zero interest rates, and Treasury yields have barely budged.
But that calm faces a test starting Friday. The potential for volatility comes from the fact that when Fed officials gather this month, they will release fresh projections for the fed funds rate for the next few years. And with the labor market pivotal for Fed policy now, Friday’s August jobs report is seen as laying the foundation for these forecasts — collectively known as the dot plot — especially as some Fed officials have already been pushing for an early taper.
The upshot is that a robust reading Friday could have investors pulling forward tightening bets regardless of Powell’s efforts last week in his virtual speech at the Fed’s Jackson Hole symposium. The risk is traders will prepare for a repeat of June, when a hawkish signal via the dot-plot took markets by surprise and triggered an abrupt unwinding of wagers on a steeper yield curve.
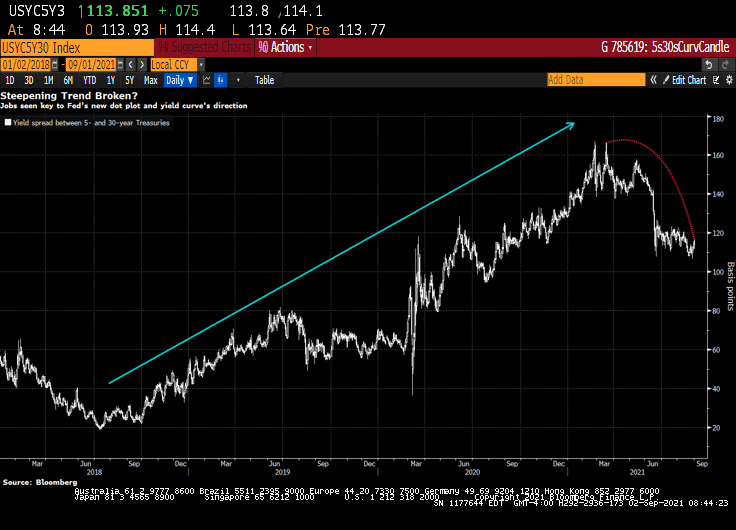
If the employment report is “even deemed acceptable, regional presidents will be back on the tape in a flash,” sounding hawkish again, said Jim Vogel, an analyst at FHN Financial. “And you may have more officials penciling in a 2022 hike. And that would have to flatten the yield curve.”
Expectations for a hawkish shift would lift 5-year Treasury yields in particular, shrinking the gap with 30-year rates, Vogel said. That spread was around 114 basis points Wednesday, down from about 140 just before the Fed met in mid-June.
Dots Math
Officials’ June quarterly forecasts not only showed a median funds rate projection of two hikes in 2023 — after the March dot plot indicated no tightening until at least 2024 — but that seven participants saw at least one increase next year. This time around, it will take just three officials to raise their dots for 2022 for a full hike to be the new median for next year, assuming everyone else keeps their projections where they were.
Traders responded to the Fed’s June rate projections by driving 5-year yields up the most in almost four months. That was even as Powell said in his press conference that the dot plot should be taken with a “big grain of salt” and discussion about raising rates would be “highly premature.”
Powell last week said “the timing and pace of the coming reduction in asset purchases will not be intended to carry a direct signal regarding the timing of interest rate liftoff, for which we have articulated a different and substantially more stringent test.”
But the leadup to the Fed decision on Sept. 22 may culminate in a dot-plot unveiling that yet again presents a communication challenge for policy makers, as has been seen several times since the Fed introduced the projections in 2012.
“There’s information in the dots, and generally it’s good information,” said Shahid Ladha, head of Group-of-10 rates strategy for the Americas at BNP Paribas SA. It makes sense for the Fed, regarding tapering and rate hikes, “to try to separate them, but I don’t think they’ll be ultimately successful in separating them.”
Trouble Ahead
Even some Fed officials are wary of being able to disentangle the tapering from rate hikes, minutes from the July Fed meeting showed.
Kevin Flanagan, head of fixed-income strategy at WisdomTree Investments Inc., which runs exchange-traded funds with assets of $75 billion, sees trouble for the Fed.
His view is that the labor market will keep gaining ground in its rebound from the pandemic, and that the median September dot may show a hike in 2022. That bodes for higher yields, a flatter curve and makes floating-rate notes appealing, he said.
The median of economists’ projection is for a gain of 725,000 jobs in August, a slowdown from June and July but well above the average for 2021. Of course, with millions still out of work relative to pre-pandemic levels, the Fed may prove to take longer to lift rates than traders expect, especially given the central bank’s “broad and inclusive” maximum-employment goal. But the market may be about to challenge that approach.
Note: Yesterday’s ADP jobs gain was forecast to be 625k jobs added in August, but only 374k jobs were actually added.
Fed Faces ‘Ugly Fight’ Over Jobs Goal in Next Big Policy Debate
“We are going to be all of a sudden talking about rate hikes potentially next year, and that is where the focus of the bond market is going to go,” Flanagan said. “The dot plot will be the Fed’s initial message for its forward guidance on rates. And then it will begin to come from Fedspeak — which is when the rubber will really meet the road.”
And with the stock market, particularly technology stocks, rising with Fed asset purchases, I wonder if The Fed forecasts that assets prices will keep going if they withdraw the punch bowl?
Let’s see if Powell and The Gang can forecast the stock market if they taper the balance sheet and raise rates.


You must be logged in to post a comment.