Fed’s Ability to Set Rates Floor Is Weakening on Cash Deluge (“Charming” Powell Had At Least 350 Meetings, Dinners Or Phone Calls With Members Of Congress)

Powell and The Fed’s policies have veered from their mandate requiring Chairman Powell to meet 350 times with Congress to sell The Fed’s policies.

Bloomberg) — The Federal Reserve’s floor for overnight funding markets is proving to be no match for the deluge of cash. 

Money-market securities ranging from Treasury bills to repurchase agreements continue to trade below 0.05% — the offering rate on the overnight reverse repo facility, which is supposed to act like a floor for the front end. The Fed at its June meeting had raised the rate by five basis points to help support the smooth functioning of short-term funding markets.

Still, usage of the tool climbed to a record $1.136 trillion on Monday, eclipsing the previous high of $1.116 trillion on Aug. 18. 
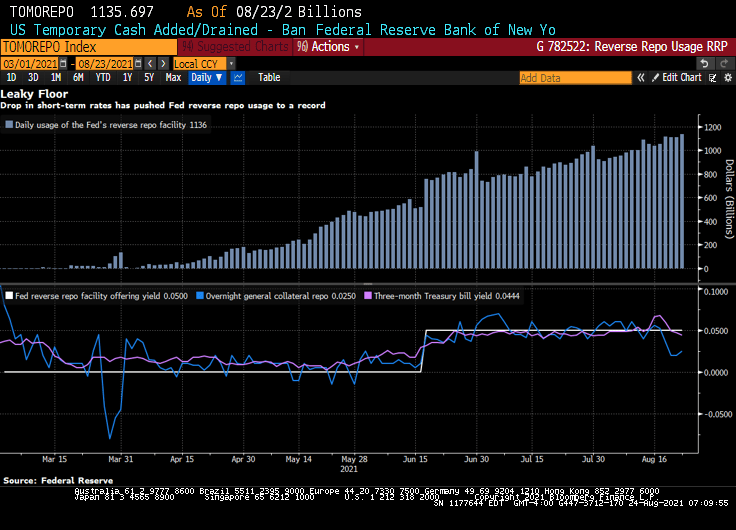
Demand for the so-called RRP facility has surged as a flood of dollars threatens to overwhelm funding markets. That’s in part a result of the central bank’s long-standing asset purchases and drawdowns of the Treasury’s cash account, which is pushing reserves into the system. As a result, liquidity has been swelling, especially as the Treasury cuts supply to create more borrowing room under the debt ceiling.

The pressure pushing down overnight rates toward zero is proving a major headache for money-market funds. It hampers their ability to invest profitably, and can lead to further disruptions as they begin to waive fees to avoid passing on negative rates to shareholders. A number of firms including Vanguard Group shut down prime money-market funds last year after struggling to cover operating costs in the low-interest-rate environment.

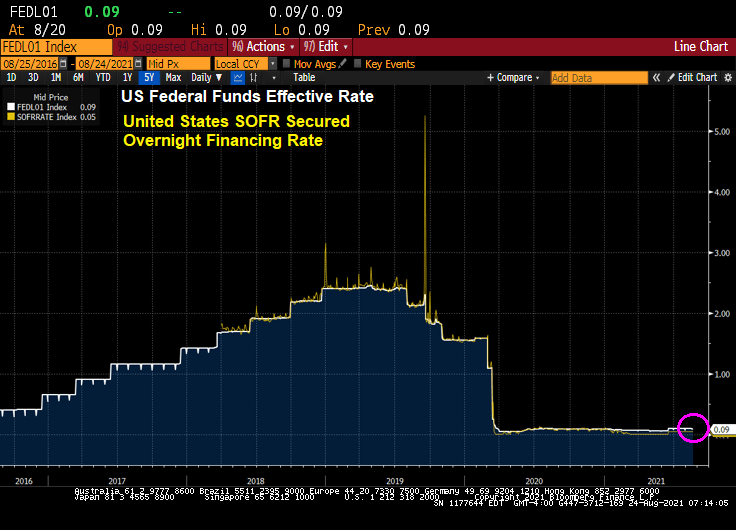
Yes, overnight rates such as the US SOFR rate, are near zero.
Powell’s Charm Offensive in Congress Positions Him to Keep Job

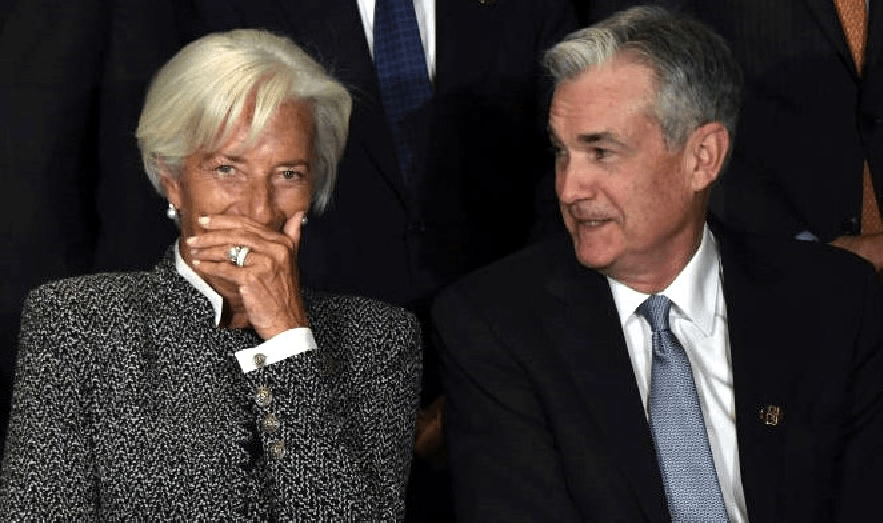
Perhaps that is why Federal Reserve Chair Jerome Powell is acting as a lobbyist with Congress for The Fed’s nontraditional approach to monetary policy.

(Bloomberg) Since he took the helm of the Fed in February 2018, through June of this year, he’s held at least 350 meetings, dinners or phone calls with members of Congress, according to his monthly calendars. That’s almost nine per month, and many of those included more than one lawmaker. The tally doesn’t count at least 16 appearances as chair before numerous congressional committees.

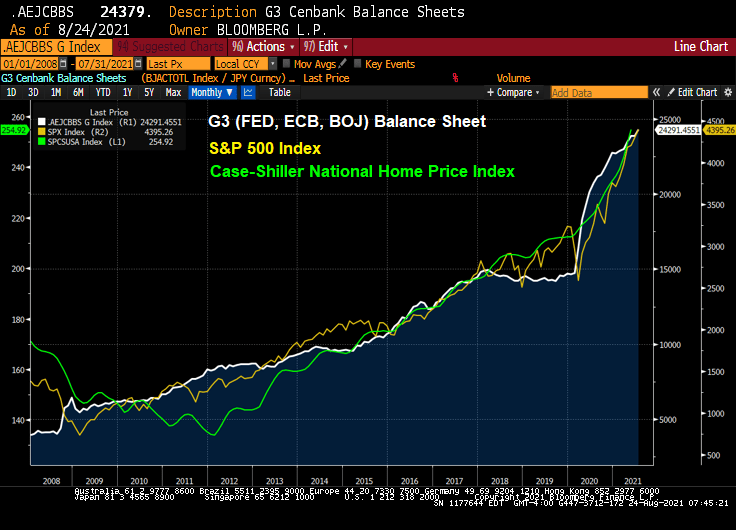
Well, the stock market has zoomed-up since Bernanke and The Fed adopted zero-interest rate (ZIRP) policies and the now famous quantitative easing (QE) policies in late 2008.
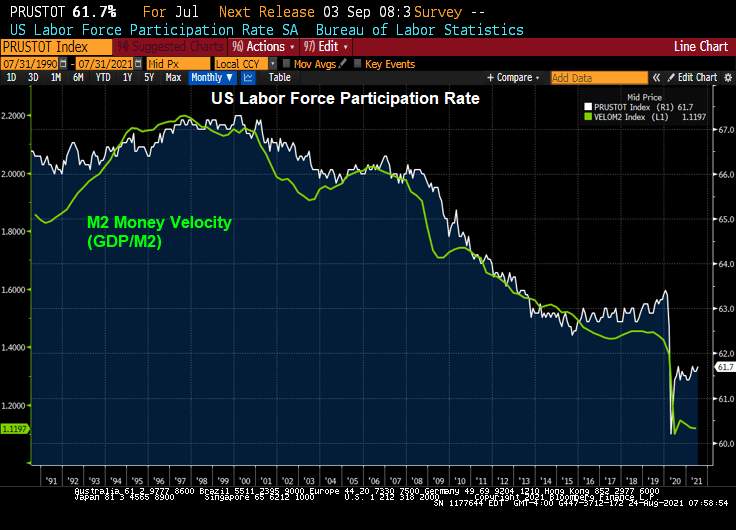
Congress member Alexandria Ocasio-Cortez asked Fed Chair Powell about the Fed helping with US unemployment. We are already at zero rates (on the short-end), and Congress should look at their policies on why labor force participation is slow to recover from the Covid epidemic.
Powell is sounding more and more like Parks and Recreation’s Tom Haverford in terms of schmoozing Congress for support.

Update: The Mises Stationarity Index is flashing “BUBBLE.”
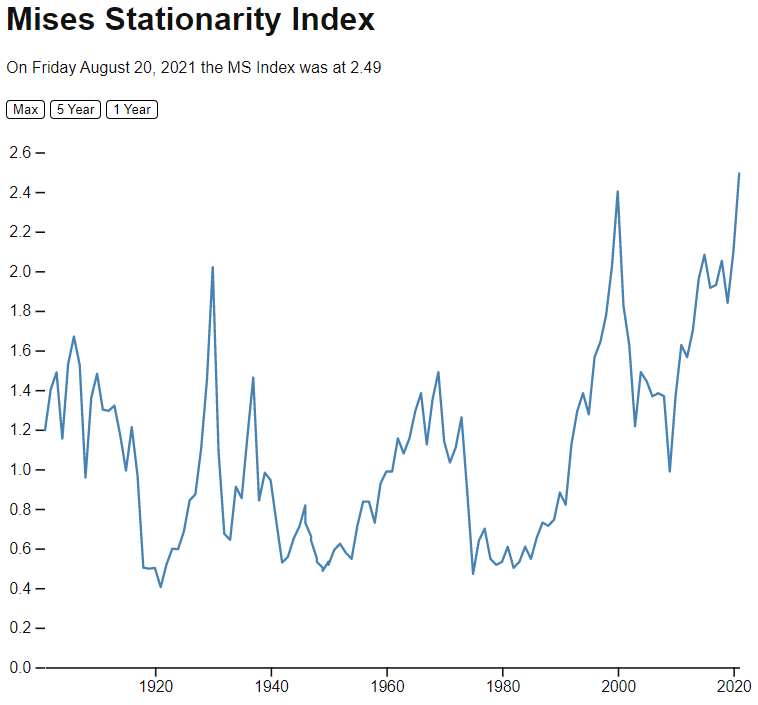

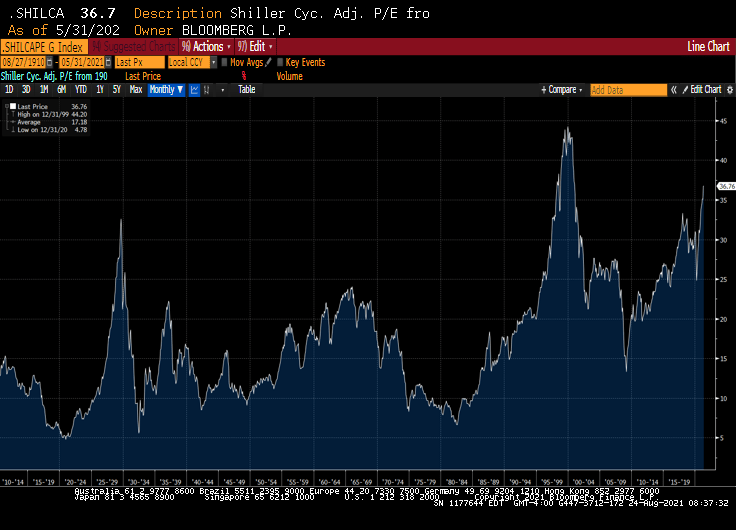
The Mises Stationarity Index is different than the Shiller CAPE index, which is showing equities as being overpriced, but not yet in dot.com bubble zone.

Treasury And Mortgage Rates In A Never-Ending Balance Sheet World (REAL Mortgage Rates NEGATIVE With Skyrocketing Home Prices)

Headline! “Fed’s Kaplan says delta variant could cause him to rethink his tapering view”

Face it, the Federal Reserve may alter its growth path on asset purchases of Treasuries and Agency Mortgage-backed Securities, but it is doubtful that they will pare back their balance sheet. Call it “A Never-ending balance sheet for you” world.

Why? Seemingly never-ending Covid crisis, etc.

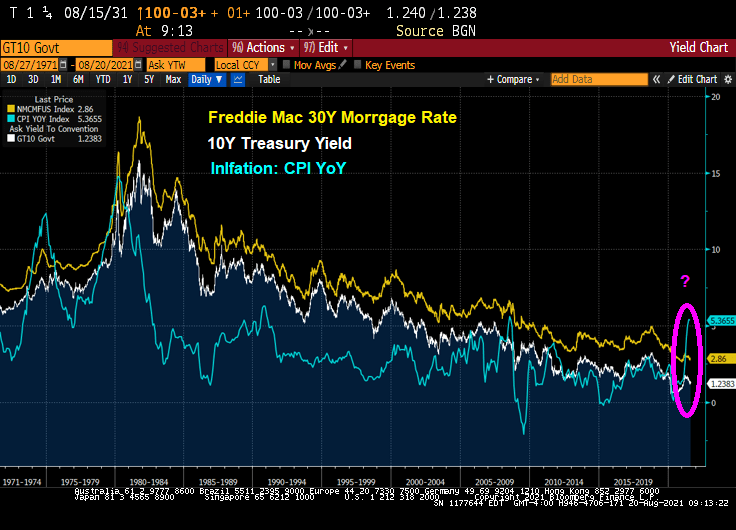
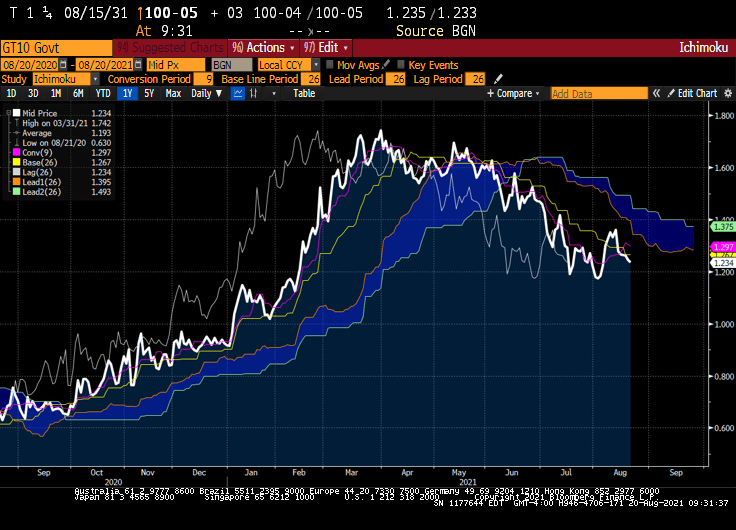
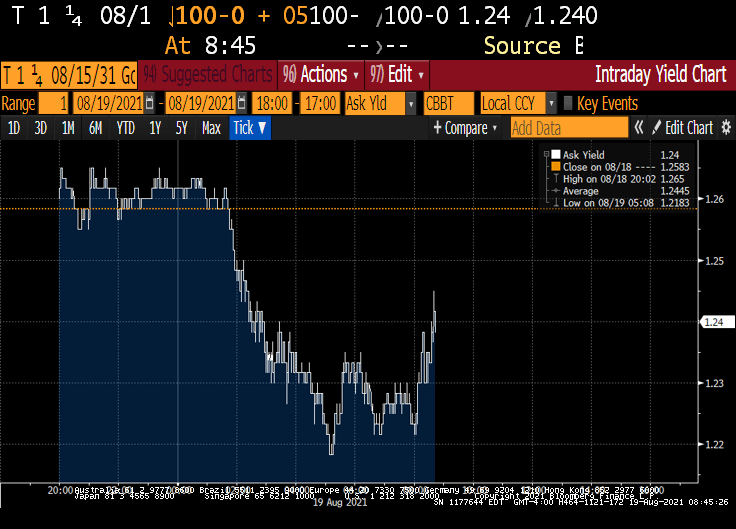
Let’s look at US Treasury yields today. The 10-year Treasury yield is up slightly to 1.25% as of 10am EST.

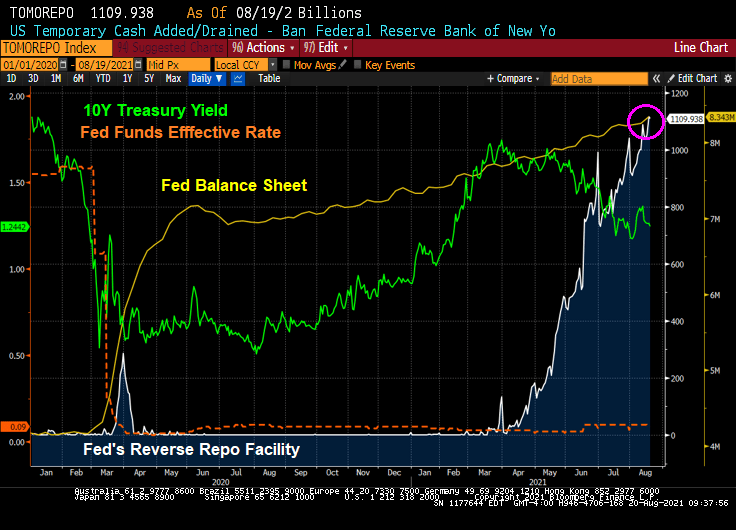
Here is a chart of the 10-year Treasury yield, Fed Funds effective rate, Fed Balance sheet and reverse repos since the Covid outbreak and Fed massive intervention. Bottom line, the have repressed the short-term interest rates and put downward pressure on the 10-year Treasury yield.

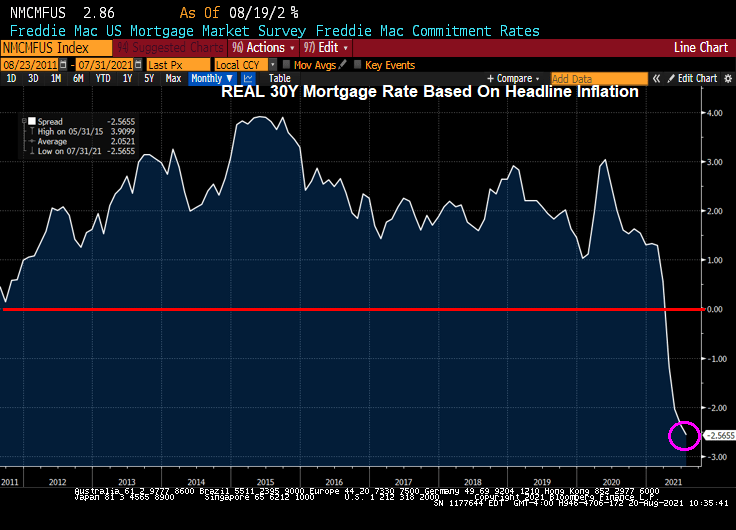
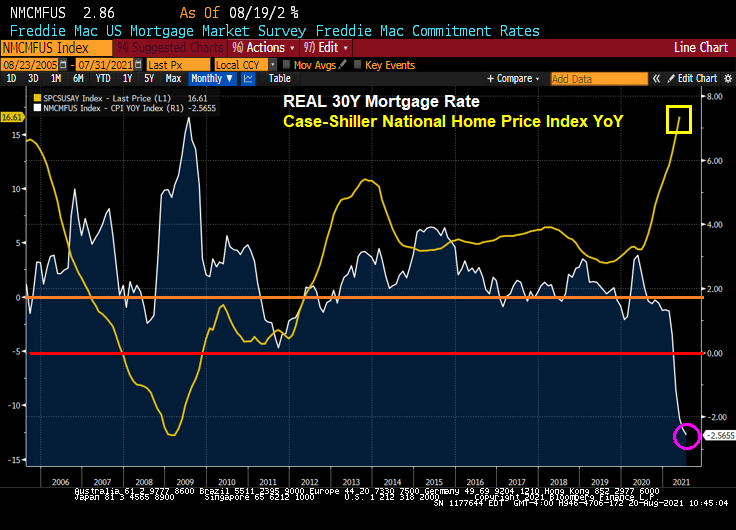
As the 10-year Treasury yield remains repressed DESPITE HIGHEST INFLATION RATE SINCE 2008, the Freddie Mac 30-year mortgage rate remains repressed as well. Yes, that mean NEGATIVE REAL MORTGAGE RATES.

This produces a REAL mortgage rate of -2.56%.

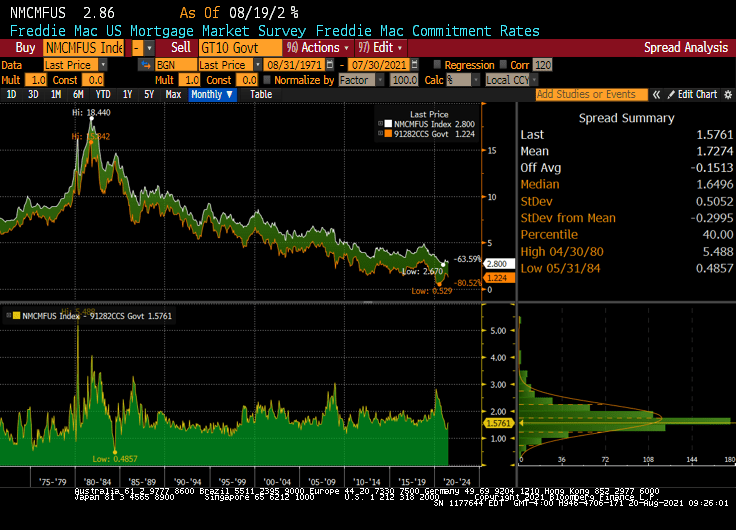
The spread of mortgage rates over the 10-year Treasury yield is about 173 basis point since 1971.

Where will Treasury yields go from hear? If we believe technical analysis like the Ichimoku Cloud, the 10-year Treasury rate will likely rise.

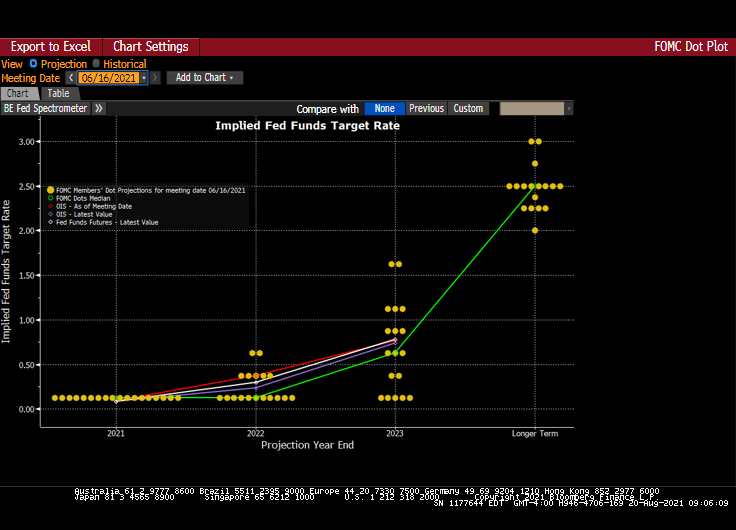
And The Fed’s Dots project also see rates rising (at least on the short-end.

Negative real mortgage rates and blistering home price growth?

Will the attendees at the KC Fed Jackson Hole conference discuss these matters? Or will it just be a Federal Reserve Soul Shake (dance)?

Fed Minutes: Taper Begins IFF Covid Doesn’t Harm Economy, Or An Arquillian Battle Cruisier Or (Fed Reverse Repos Keep Climbing)

To quote Tommy Lee Jones from the film Men In Black “There’s always an Arquillian Battle Cruiser, or a Corillian Death Ray, or an intergalactic plague that is about to wipe out all life on this miserable little planet, and the only way these people can get on with their happy lives is that they DO NOT KNOW ABOUT IT!”

That is what The Fed essentially said in their minutes, but not in so many words.

The minutes of the July Fed meeting suggest officials may signal an impending start to asset purchase tapering at the September gathering — provided jobs numbers remain on track in the interim — and make an announcement in November.

Rising infections counts have not spurred an uptick in new jobless claims. High-frequency data show some customers are shying away from eating out, but the overall impact on restaurant reservations is limited. The bigger challenge for many companies is retaining and hiring enough workers to meet strong demand, evident in low layoff counts and persistent mention of labor shortages.

In other words, IFF Covid doesn’t cause further economic damage (or governments don’t shut down economies), then The Fed will consider a mild taper of their balance sheet.

But as of this morning, The Fed’s reverse repo facility keeps on rising along with The Fed’s balance sheet. At least M2 Money Supply growth has leveled off.

That should result in an increase in Treasury yields and mortgage rates, all things being equal. And assuming the Biden Administration and governors don’t panic and go into economic lockdown … again.

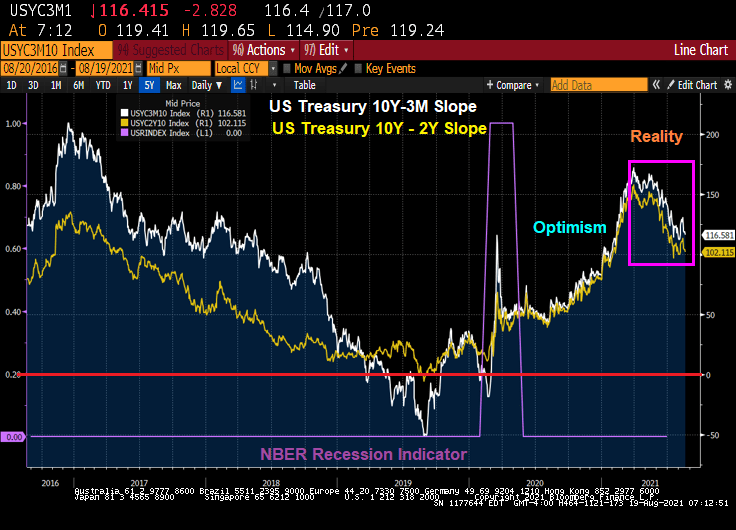
The US Treasury curves since the Covid recession of 2020 have shown optimism in recovery … then reality dawned.

The Federal Reserve Board of Governors meeting

Initial Jobless Claims And Continuing Claims Fall (Little Sign Of Covid Impacting Employment) Let The Taper Begin?

Well, it looks like The Fed will start tapering after all.

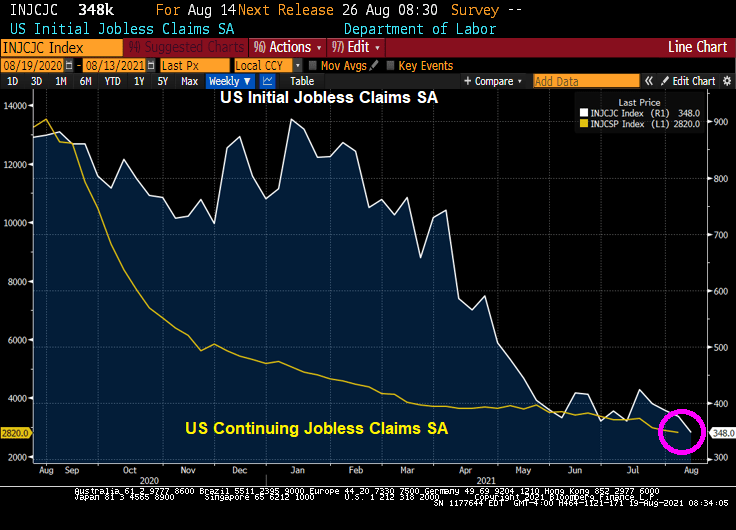
Initial jobless claims fell again to 348K and continuing jobless claims fell to 2,820K.

Unless Biden’s disastrous Afghanistan withdrawal sends shock waves through the global economy (or Covid Delta/Lamba variant strains get worse and hurt the economy), we should see The Fed start tapering their balance sheet.

The 10Y Treasury yield rose slightly on the jobs report.

The Tapir, the symbolic mascot of The Fed’s tapering programs.

S&P 500 Bubble Views: Buffett Indicator, Shiller CAPE, Ichimoku, Bollinger, Gold To SPX, SPX Versus Average Hourly Earnings (All Roads Point To Bubble)

There are a variety of measures of an asset bubble. And each one points to an unsustainable bubble in the stock market.

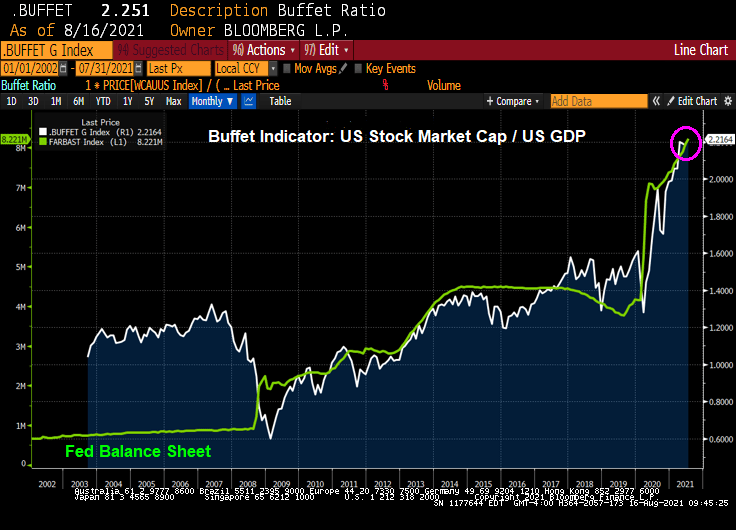
Let’s start with the Buffett Indicator. The ratio of Total Market Capitalization of all US stocks (WCAUUS ) to total nominal GDP of the United States (GDP CUR$ ).

There is also the GLOBAL Buffett ratio produced by Holger Zschäpitz. Global market cap now equal to 139% of global GDP, way above Buffett’s 100% bubble threshold.

Shiller’s Cyclically-adjusted Price-earnings ratio? Still climbing and resembles the Dot.com bubble of 2000.

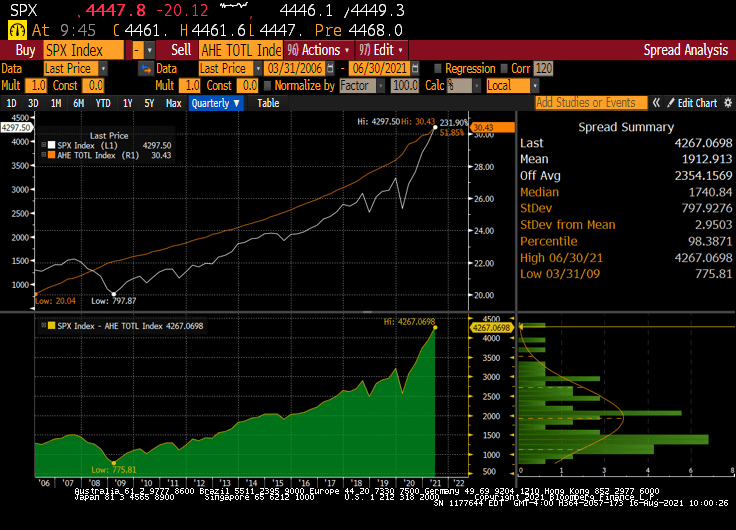
How about gold to Average Hourly Earnings (similar to the Bichler and Nitzan “Power” measure. The spread (bottom chart) sees the S&P 500 index soaring away from average hourly earnings.

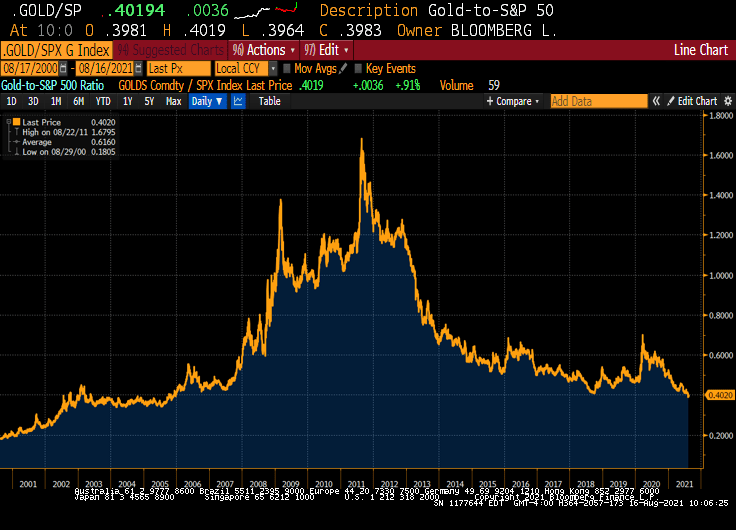
We also have the Gold to SPX ratio that is now back to pre-financial crisis levels.

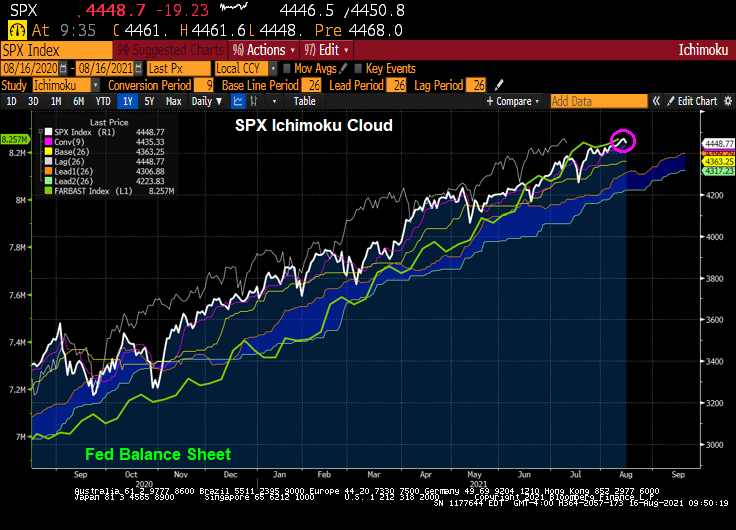
How about the Ichimoku cloud, where the SPX is currently ABOVE the cloud?

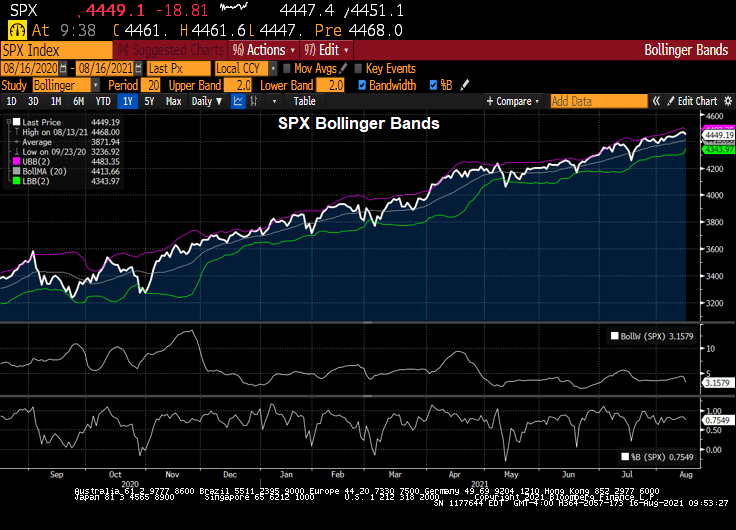
SPX and Bollinger Bands? The SPX index is close to the upper band.

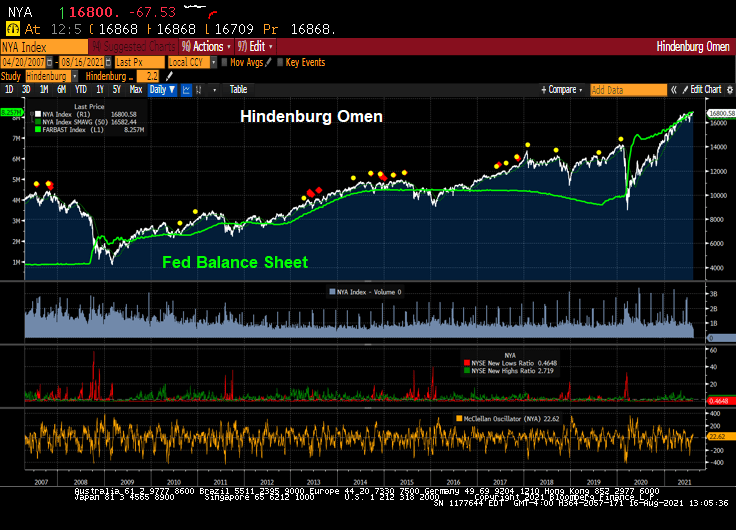
How about The Hindenburg Omen, a technical indicator that was designed to signal the increased probability of a stock market crash. It compares the percentage of new 52-week highs and new 52-week lows in stock prices to a predetermined reference percentage that is supposed to predict the increasing likelihood of a market crash.

So it looks like a have a bubble in the stock market.

Fed Chair Jerome Powell sees the ghost of the Dot.com bubble.

New York City MSA Rents Fall YoY For First Time Since 1958 (And Ike!) Northern NJ And Long Island Too

Rents in the New York City metropolitan statistical area — which also encompasses northern New Jersey and Long Island — dropped in the 12 months through July for the first time since 1958, according to monthly data on consumer prices published Wednesday by the Labor Department. Before that, the series indicates rents in the region hadn’t fallen on a year-over-year basis since 1934. The figures underscore the historic nature of the pandemic and its impact on the U.S. economy.

On the other hand, New York City home prices are growing at a +15.3% YoY pace.

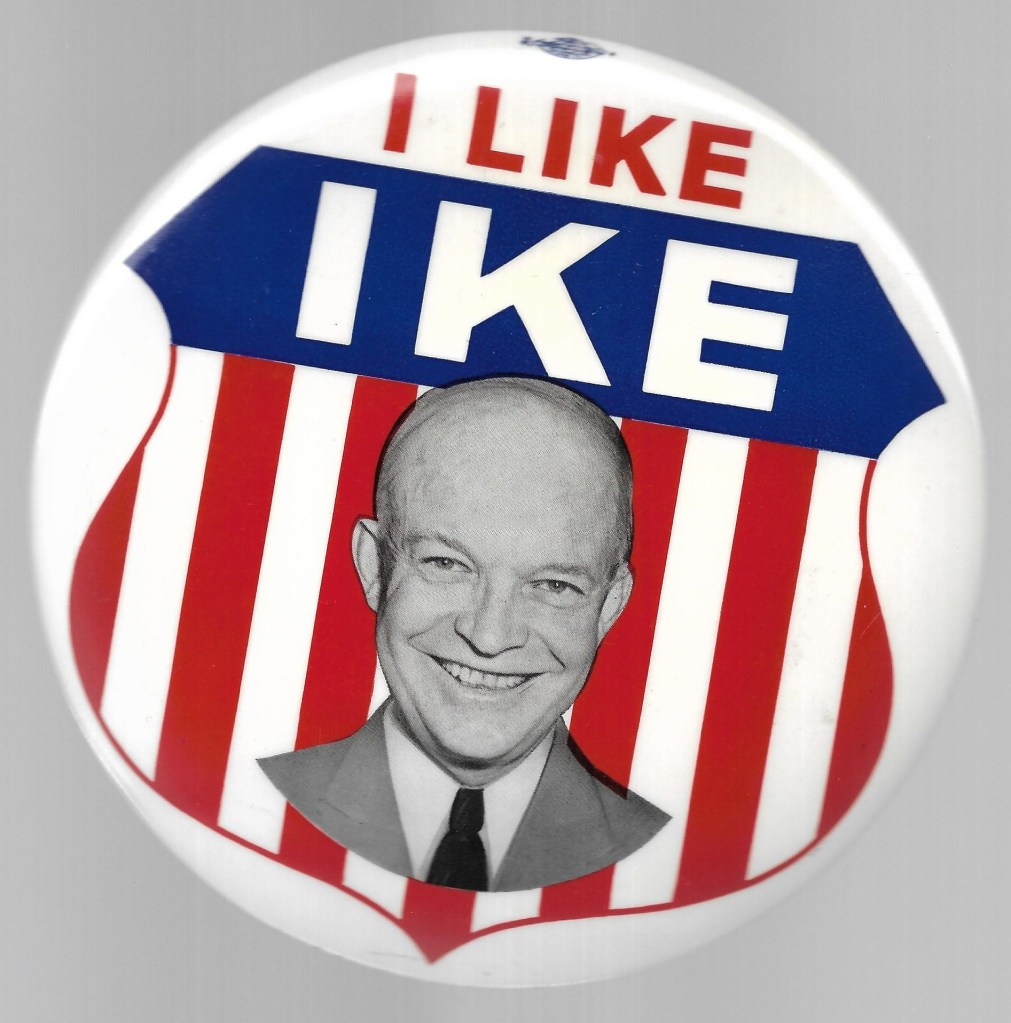
Apparently, in 1958 Americans liked Ike, but didn’t like living in New York City.

US Real Average Hourly Earnings “Rise” To -1.2% YoY While Core Inflation Decreases Slightly To 4.3% YoY

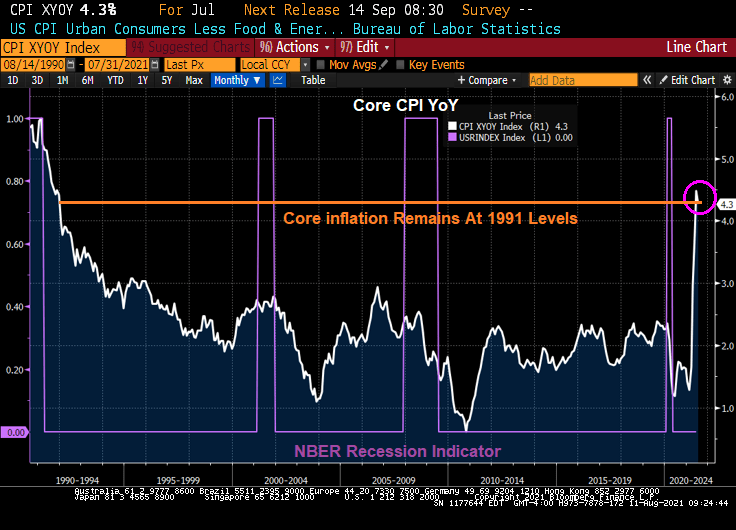
US inflation remains nears its highest level since 1991, but moderated slightly.

The Consumer Price Index for All Urban Consumers (CPI-U) increased 0.5 percent in July on a seasonally adjusted basis after rising 0.9 percent in June, the U.S. Bureau of Labor Statistics reported today. Over the last 12 months, the all items index increased 5.4 percent before seasonal adjustment.

The indexes for shelter, food, energy, and new vehicles all increased in July and contributed to the monthly all items seasonally adjusted increase. The food index increased 0.7 percent in July as five of the major grocery store food group indexes rose, and the food away from home index increased 0.8 percent. The energy index rose 1.6 percent in July, as the gasoline index increased 2.4 percent and other energy component indexes also rose.

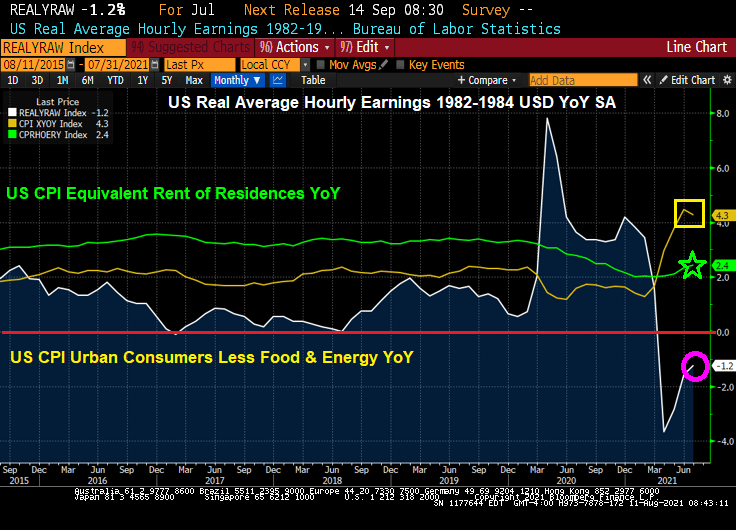
US Real Average Hourly Earning YoY “rose” to -1.2% as core inflation “moderated” to +4.3%, the second highest reading since 1991.

Core inflation remains at 1991 levels.

With core CPI growing at 4.3%, the baseline Taylor Rule model implies that the Fed Funds target rate should be 7.05%, not the current rate of 0.25%.

As The Fed keeps rolling the dice on zero-interest rate policies.