Longer-term inflation jumped to their highest since June 2008, according to the latest UMich Sentiment survey, while short-term inflation expectations dropped to four year lows…
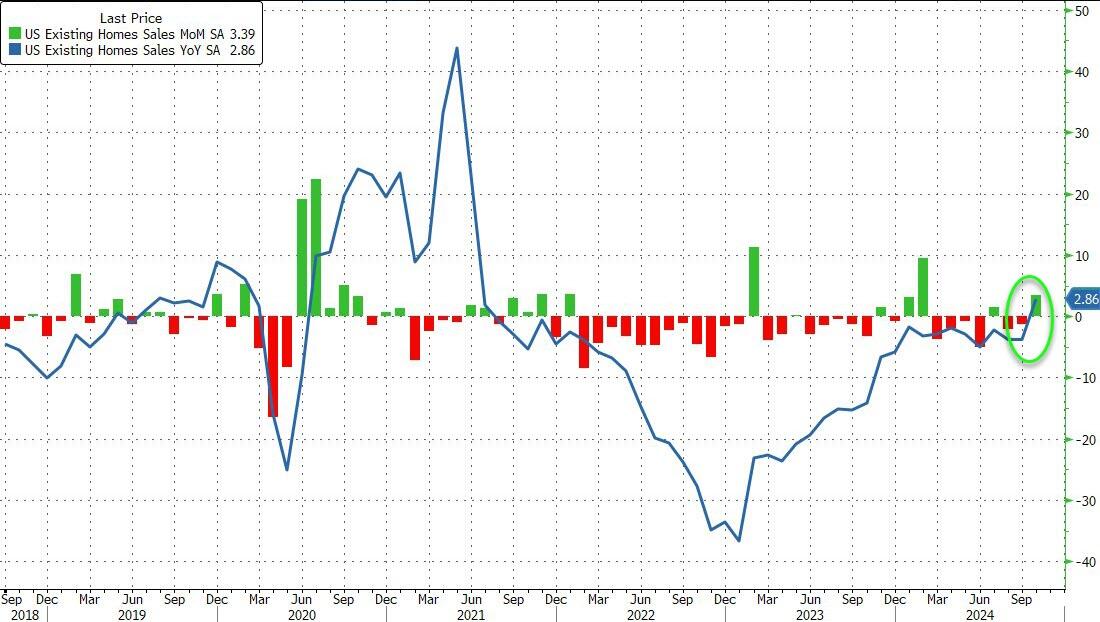
Housing sentiment (buying conditions for housing) remains depressed under Biden/Harris “Reign of (economic) error.”
Here is a picture depicting the assassination of the US housing market.
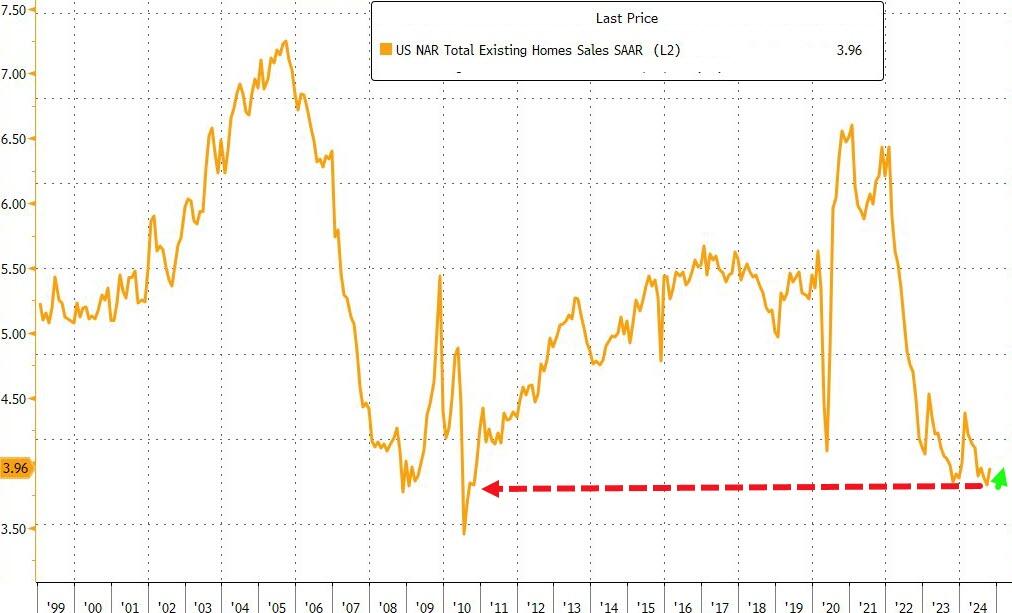
…but in context, that shift up to 3.96mm SAAR homes sold is nothing…
Source: Bloomberg
High borrowing costs have led to a shortage of previously owned homes on the market, discouraging many would-be home sellers from listing their properties for sale and having to part with their current low financing costs.
“Additional job gains and continued economic growth appear assured, resulting in growing housing demand,” NAR Chief Economist Lawrence Yun said in a prepared statement.
“While mortgage rates remain elevated, they are expected to stabilize.”
Last month, the inventory of available homes edged up 0.7% to 1.37 million, continuing to trend higher although well below pre-pandemic levels.
Despite the weakness in sales, tight inventory is keeping prices elevated, yielding one of the least affordable housing markets on record. The median sale price last month increased 4% from a year earlier to $407,200, the highest ever for any October, the NAR figures show.
Contract signings rose in all four US regions, led by a 6.7% jump in the Midwest.
Sales of single-family homes increased 3.5% in October; purchases of condominiums and co-ops were up 2.7%
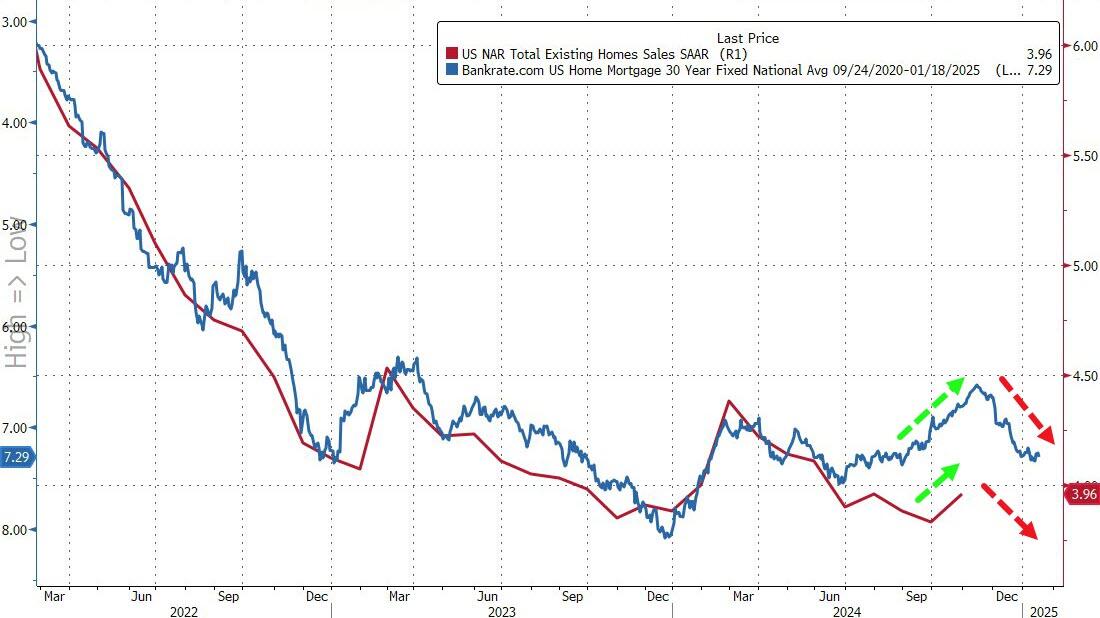
Finally, while that’s all very exciting – a scintilla of growth off almost record lows – the fecal matter is about to strike the rotating object as rising mortgage rates lagged impact threatens…
Source: Bloomberg
In October, 59% of homes sold were on the market for less than a month, compared with 57% in September, and 19% sold above the list price. Properties remained on the market for 29 days on average, compared with 28 days in the previous month. First-time buyers made up 27% of purchases, still historically low.
Fortunately, the Biden/Harris administration is winding down. On the mortgage side, the mortgage market is already gone under Biden/Harris where mortgage purchase applications are down a whopping 60%.
Mortgage applications increased 1.7 percent from one week earlier, according to data from the Mortgage Bankers Association’s (MBA) Weekly Mortgage Applications Survey for the week ending November 15, 2024.
The Market Composite Index, a measure of mortgage loan application volume, increased 1.7 percent on a seasonally adjusted basis from one week earlier. On an unadjusted basis, the Index decreased 1 percent compared with the previous week. The seasonally adjusted Purchase Index increased 2 percent from one week earlier. The unadjusted Purchase Index decreased 3 percent compared with the previous week and was 1 percent lower than the same week one year ago. And down -60% under Biden/Harris.
The Refinance Index increased 2 percent from the previous week and was 43 percent higher than the same week one year ago.
Slowing economy, rising rates, too expensive housing. Not a good sign for the mortgage market.
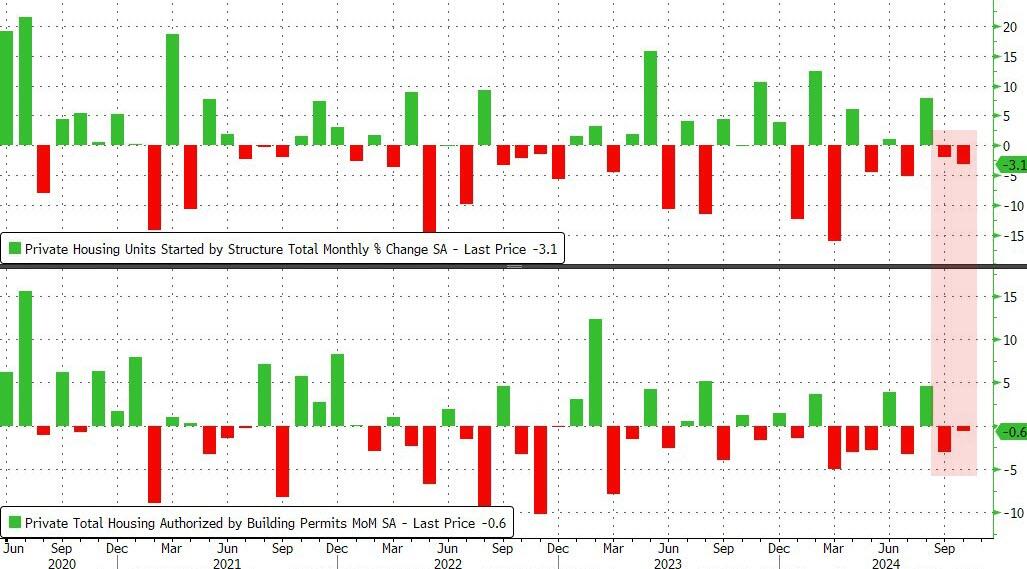
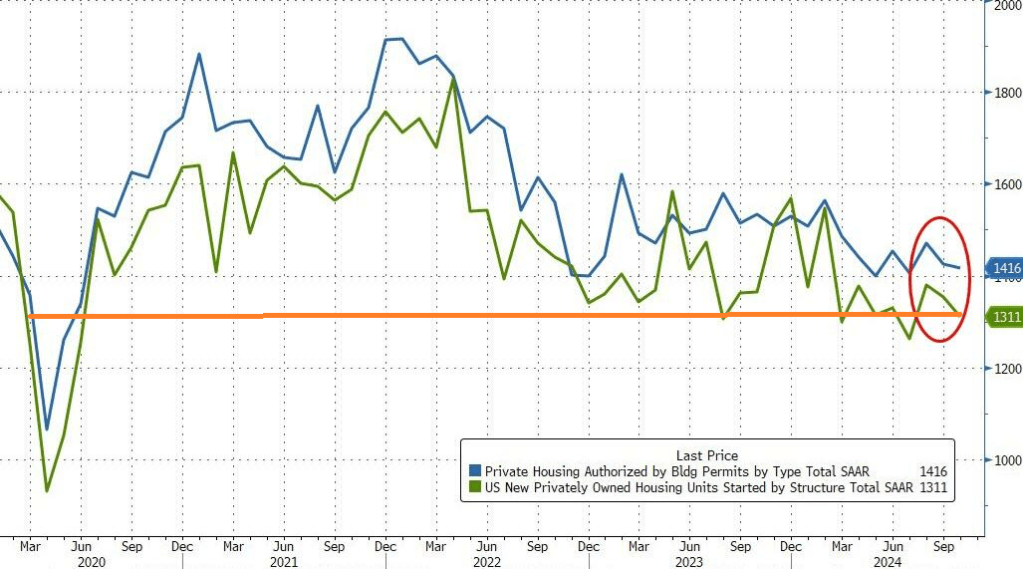
As Biden/Harris approve of Ukraine launching missiles against Russia risking nuclear war, we are witnessing a slow down in the US economy. This time, housing starts and permits.
US Housing Starts and Building Permits disappointed in October with the former dropping 3.1% MoM (-1.5% exp) and -0.6% MoM (+0.7% exp) respectively. This is the second straight month of declines for both measures of housing activity.
Source: Bloomberg
That pulled the SAAR totals down to four month lows – hovering just above COVID lockdown levels…
Source: Bloomberg
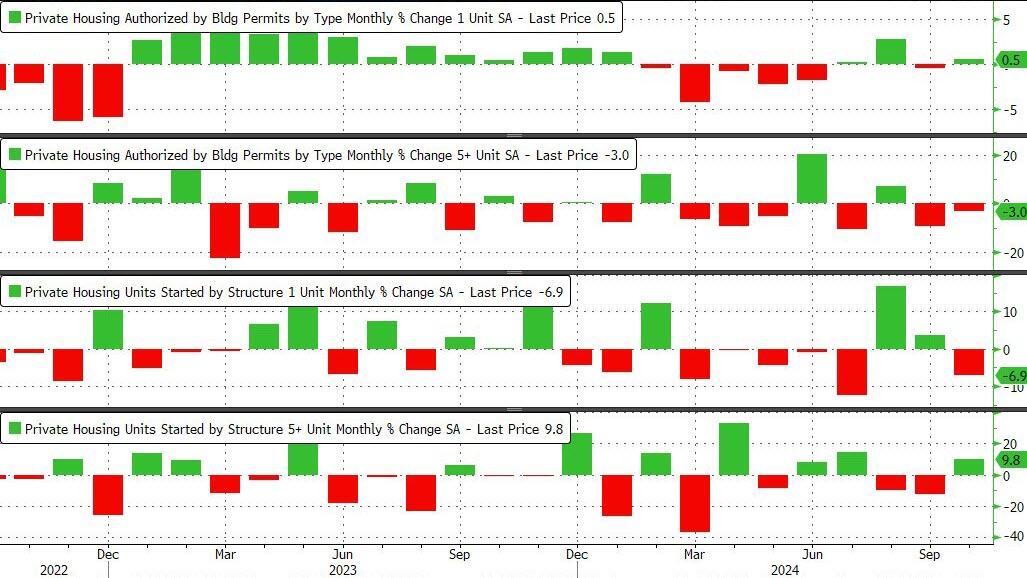
Under the hood, it was very mixed with Single-family permits rising and multifamily permits dropped. Single-family Starts plunged while multi-family Starts jumped…
Source: Bloomberg
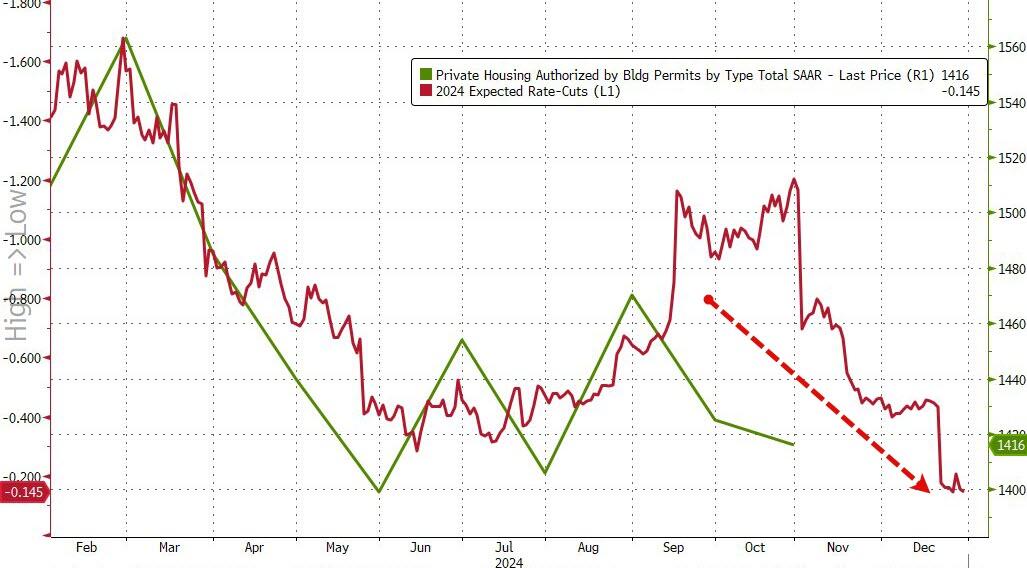
As rate-cut expectations have fallen, so have homebuilders actions it seems…
Source: Bloomberg
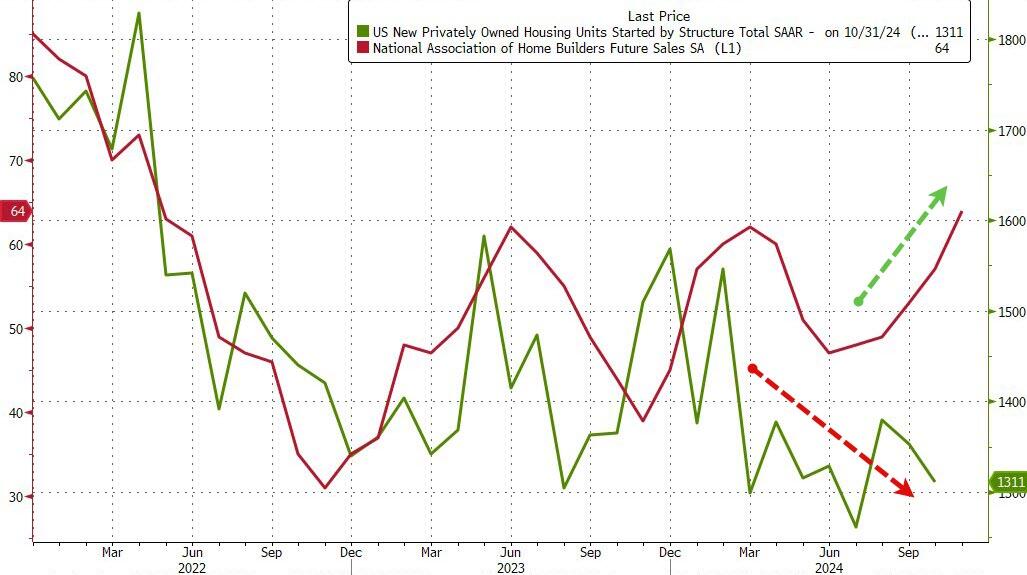
But homebuilder ‘hope’ remains high…
Source: Bloomberg
With Trump back in charge, how much will Powell and his pals really want to cut rates now?
There is one way out of the inflation trap. And it’s drill, baby, drill!
For the 53rd straight month, core consumer prices rose on a MoM basis in October with the YoY pace re-accelerating to +3.33%.
The shelter index increased 4.9 percent over the last year, accounting for over 65 percent of the total 12-month increase in the all items less food and energy index.
Thank goodness Harris can’t try to impliment her ridiculous plans to boost housing!
Glad to see Vivek Ramaswamy and Elon Musk (the NEW Two Bobs from Office Space) cleaning up the mess in Washington DC.
The US Treasury yield curve (10Y-2Y CMT) went negative on April 1, 2024. And remains positive.
The US Treasury 10Y-2Y CMT (constant maturity Treasury) peaked locally on March 29, 2024 and then fell, eventually turning negative on April 1, 2024. And remained negative until August 30, 2024 just prior to the election. It looks like the yield curve accurately predicted the election of Trump.
The 10-year Treasury yield is rising with a positive economic outlook under Trump. And with that optimism we see mortgage rates rising too.
The Market Composite Index, a measure of mortgage loan application volume, decreased 10.8 percent on a seasonally adjusted basis from one week earlier. On an unadjusted basis, the Index decreased 12 percent compared with the previous week. The seasonally adjusted Purchase Index decreased 5 percent from one week earlier. The unadjusted Purchase Index decreased 7 percent compared with the previous week and was 2 percent higher than the same week one year ago.
The Refinance Index decreased 19 percent from the previous week and was 48 percent higher than the same week one year ago.
“Ten-year Treasury rates remain volatile and continue to put upward pressure on mortgage rates. The 30-year fixed rate last week increased to 6.81 percent, the highest level since July,” said Joel Kan, MBA’s Vice President and Deputy Chief Economist. “Applications decreased for the sixth consecutive week, with purchase activity falling to its lowest level since mid-August and refinance activity declining to the lowest level since May. The average loan size on a refinance application dropped below $300,000, as borrowers with larger loans tend to be more sensitive to any given changes in mortgage rates.”
The refinance share of mortgage activity decreased to 39.9 percent of total applications from 43.1 percent the previous week. The adjustable-rate mortgage (ARM) share of activity increased to 7.0 percent of total applications.
The FHA share of total applications decreased to 15.5 percent from 16.4 percent the week prior. The VA share of total applications decreased to 12.5 percent from 14.6 percent the week prior. The USDA share of total applications increased to 0.5 percent from 0.4 percent the week prior.
The average contract interest rate for 30-year fixed-rate mortgages with conforming loan balances ($766,550 or less) increased to 6.81 percent from 6.73 percent, with points decreasing to 0.68 from 0.69 (including the origination fee) for 80 percent loan-to-value ratio (LTV) loans. The effective rate increased from last week.
The average contract interest rate for 30-year fixed-rate mortgages with jumbo loan balances (greater than $766,550) increased to 6.98 percent from 6.77 percent, with points increasing to 0.65 from 0.49 (including the origination fee) for 80 percent LTV loans. The effective rate increased from last week.
The average contract interest rate for 30-year fixed-rate mortgages backed by the FHA increased to 6.75 percent from 6.55 percent, with points decreasing to 0.87 from 0.94 (including the origination fee) for 80 percent LTV loans. The effective rate increased from last week.
The average contract interest rate for 15-year fixed-rate mortgages decreased to 6.21 percent from 6.27 percent, with points decreasing to 0.55 from 0.77 (including the origination fee) for 80 percent LTV loans. The effective rate decreased from last week.
The average contract interest rate for 5/1 ARMs decreased to 6.05 percent from 6.20 percent, with points increasing to 0.84 from 0.59 (including the origination fee) for 80 percent LTV loans. The effective rate decreased from last week.
The bond market is reacting to the election of Trump with a clear Bear Steepening.
Bear steepening happens when yields move up across tenors, but long-end yields move up even faster than short-end yields.
This isn’t going to help mortgage applications due to lowering rates.
Under Biden/Harris, native born workers lost -2.7 million jobs in 2014 while foreign-born workers gained 13.4 million jobs. THAT is the great replacement of American workers.
The US is the expensive tower of power … but it should be cheap. Getting rid of coal power was idiotic and The Left’s fear of nuclear power is laughable.
Europe’s fertilizer plants, steel mills, and chemical manufacturers were the first to succumb. Massive paper mills, soybean processors, and electronics factories in Asia went dark. Now soaring natural gas and electricity prices are starting to hit the US industrial complex.
On June 22, 600 workers at the second-largest aluminum mill in America, accounting for 20% of US supply, learned they were losing their jobs because the plant can’t afford an electricity tab that’s tripled in a matter of months. Century Aluminum Co. says it’ll idle the Hawesville, Kentucky, mill for as long as a year, taking out the biggest of its three US sites. A shutdown like this can take a month as workers carefully swirl the molten metal into storage so it doesn’t solidify in pipes and vessels and turn the entire facility into a useless brick. Restarting takes another six to nine months. For this reason, owners don’t halt operations unless they’ve exhausted all other options.
At least two steel mills have begun suspending some operations to cut energy costs, according to one industry executive, who asked not to be identified because the information isn’t public. In May, a group of factories across the US Midwest warned federal energy regulators that some were on the verge of closing for the summer or longer because of what they described as “unjust and unreasonable” electricity costs. They asked to be wholly absolved of some power fees—a request that, if granted, would be unprecedented.
Michael Harris, whose firm Unified Energy Services LLC buys fuel for industrial clients, says costs have risen so high that some are having to put millions of dollars of credit on the line to secure power and gas contracts. “That can be devastating for a corporation,’’ he says. “I don’t see any scenario, absent explosions at US LNG facilities’’ that trap supplies at home, in which gas prices are headed lower in the long term.
EIA Average Electricity Cost Cents
EIA cost data chart by Mish
EIA Cost Data January 2021 vs May 2022
Residential: 12.69 to 14.92
Commercial: 10.31 to 12.14
Industrial: 6.39 to 8.35
Transportation: 9.61 to 10.79
All: 10.36 to 12.09
Those prices are through May 2022. Much electrical energy comes from natural gas.
US Natural Gas Futures
US Natural Gas Futures courtesy of Trading Economics
US gas prices fluctuated wildly in June and July. I suspect the average price is 7.33 or so for both months. Things are decidedly worse in Europe.
EU Natural Gas Price
US Natural Gas Futures courtesy of Trading Economics
From 25 or even 50 to 200 is one hell of a leap. It’s somewhere between 300% and 700% depending on your starting point vs 100% or so for the US.
Let’s now check the latest PPI data for a look at where things are and more importantly headed.
PPI Electrical Power Index 2020-Present
PPI data from the BLS, chart by Mish
From pre-pandemic to January of 2021, the PPI electrical power index was flat. It has since surged on a relatively steady pace.
From May to July the index went from 231 to 238. That tacks on another three percentage points since the EIA report.
PPI Electrical Power Index 1991-Present
PPI data from the BLS, chart by Mish
Long Term Trend
The long-term trend does not exactly look pretty.
And as Bloomberg noted, Century Aluminum Co. says it’ll idle the Hawesville, Kentucky, mill for as long as a year, taking out the biggest of its three US sites.
The beer industry uses more than 41 billion aluminum cans annually, according to a Beer Institute letter to the White House dated July 1.
“These tariffs reverberate throughout the supply chain, raising production costs for aluminum end-users and ultimately impacting consumer prices,” according to the letter signed by the CEOs of Anheuser-Busch, Molson Coors, Constellation Brands Inc.’s beer division, and Heineken USA.
This letter to the president comes amid the worst inflation in more than 40 years and just months after aluminum touched a multi-decade high. Prices for the metal have since eased significantly.
Whatever victory beer makers and drinkers may have with aluminum prices may not last with US aluminum plants shutting down.
Then again, the cure for everything is likely to be a huge recession.
Zero Consumer Inflation
I am pleased to report there was no consumer inflation in July.
The CPI report resulted in a nonsensical Twitter debate on the meaning of zero. For the record, assuming you believe the numbers, there was indeed zero inflation month-over-month.
The accurate rebuttal is: One month? So what?
Moreover, zero is not as good as it looks. All of it was due to a 7.7 percent decline in the price of gasoline. And year-over-year inflation was a hot 8.5 percent.
Meanwhile, rent and food keep rising and the price of rent will be sticky. Gasoline is more dependent on recession and global supply chains.
The above reports and this one industrial costs puts a spotlight on the silliness of the Fed’s focus on consumer inflation as if that’s all that matters.
The Fed has blown three consecutive bubbles trying to produce two percent consumer inflation while openly promoting raging bubbles in assets and missing the boat entirely on industrial matters.
SF Woman. That is my name for Kamala Harris, the ultimate political changeling, taking full credit for the economy, then trying to distance herself from Biden. As the US economy continues to contract.
Weakness in factory new orders continued to be a major drag on the US LEI in September as the global manufacturing slump persists. Additionally, the yield curve remained inverted, building permits declined, and consumers’ outlook for future business conditions was tepid. Gains among other LEI components were not significant enough to offset weakness among the four gauges mentioned above. Overall, the LEI continued to signal uncertainty for economic activity ahead.
*Changeling, in European folklore, a deformed or imbecilic offspring of fairies or elves substituted by them surreptitiously for a human infant. According to legend, the abducted human children are given to the devil or used to strengthen fairy stock.


You must be logged in to post a comment.