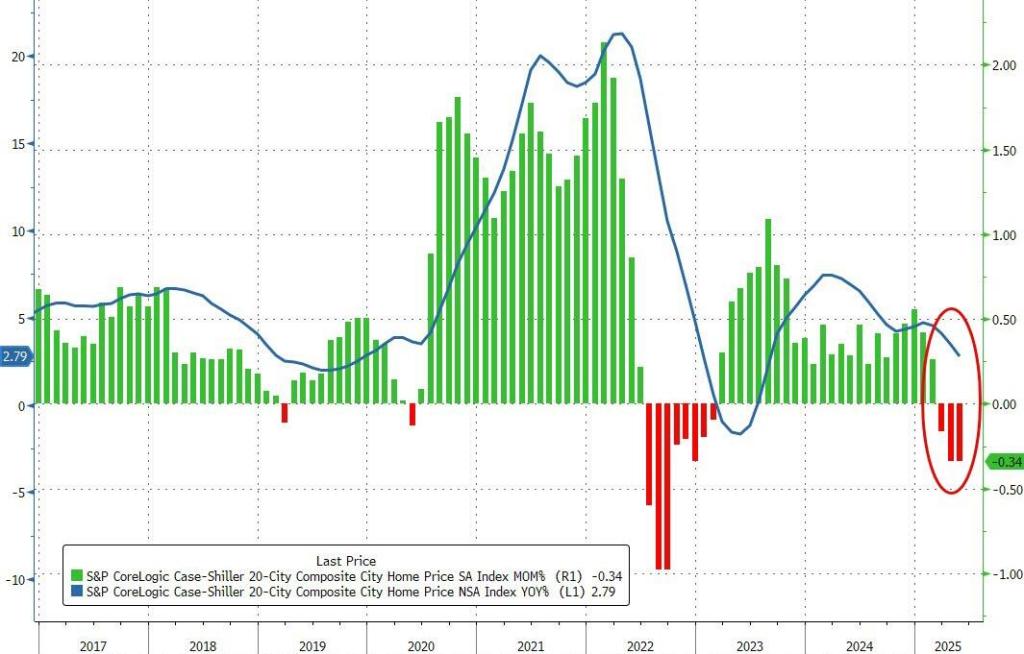
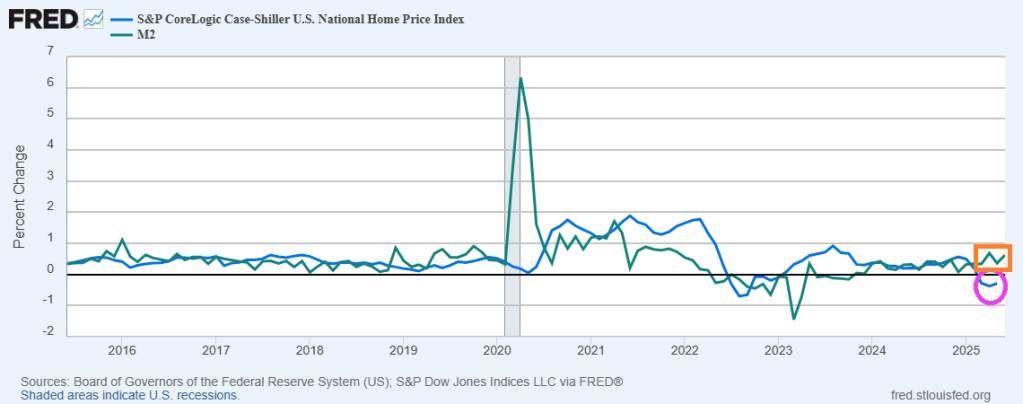
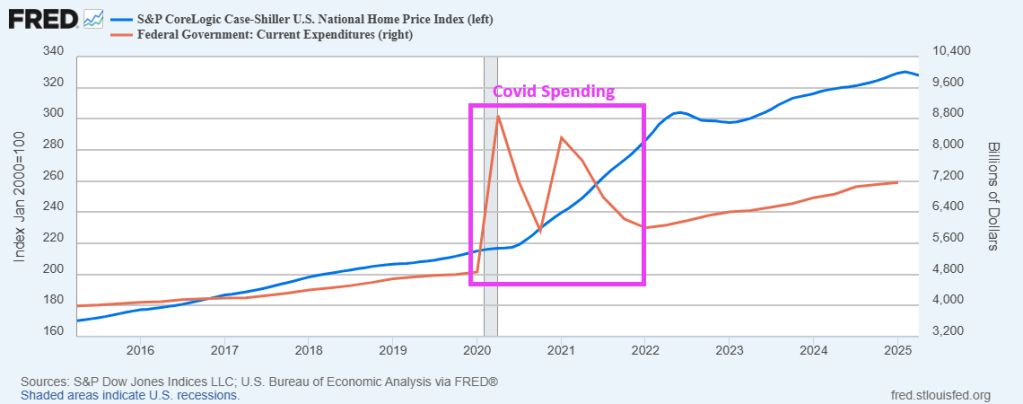
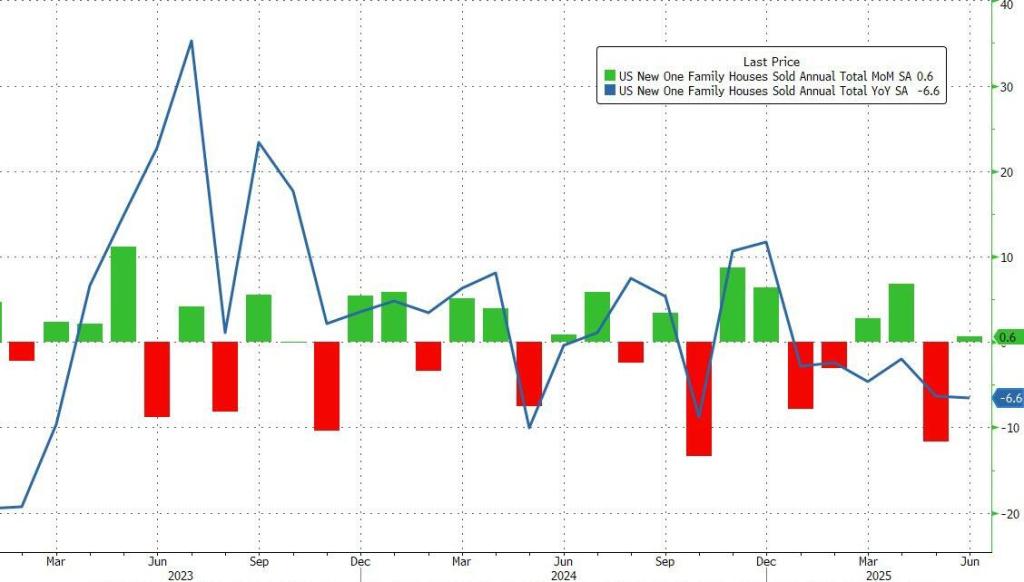
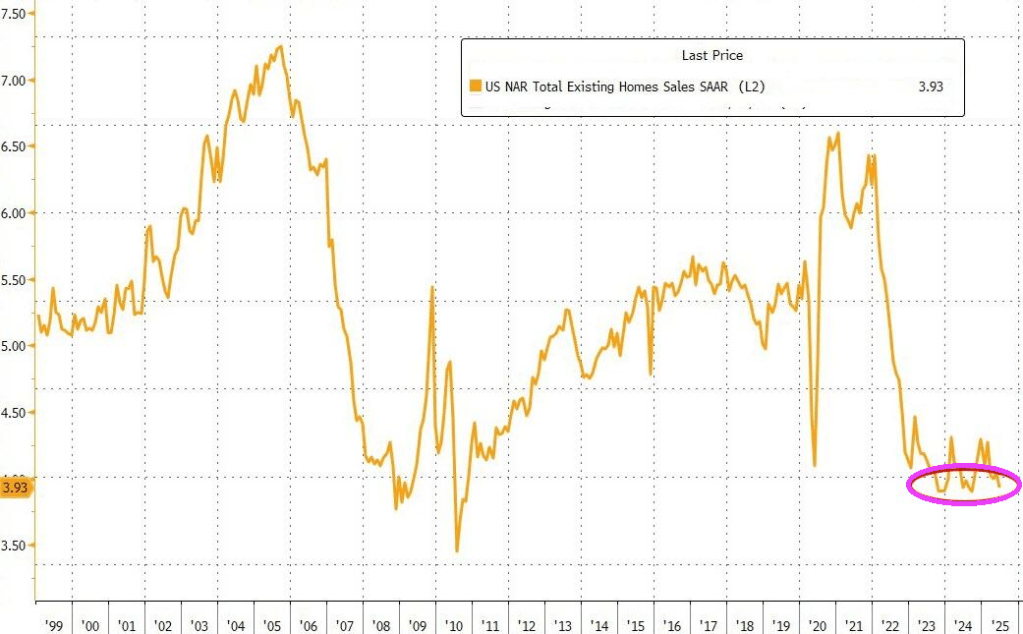
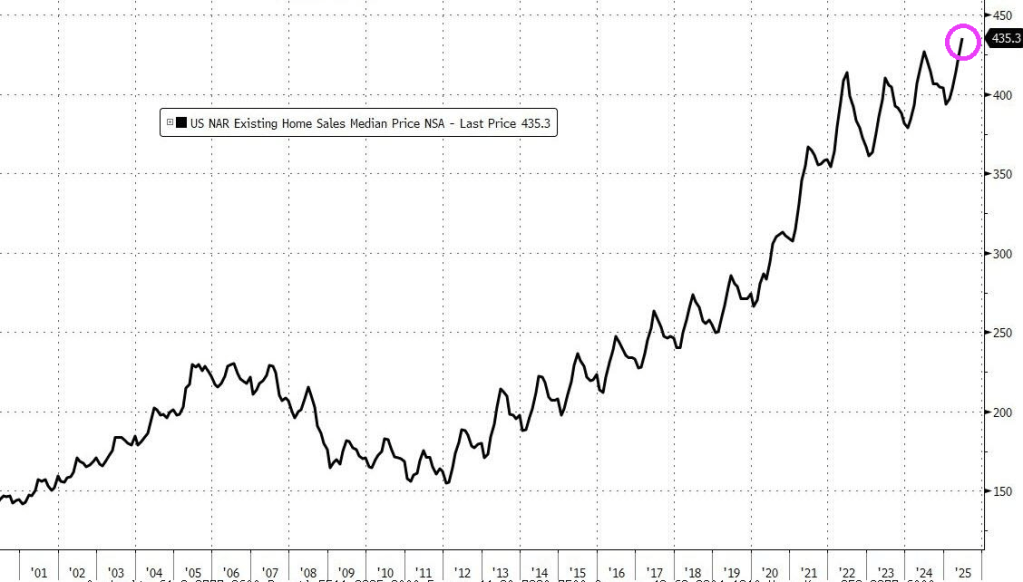
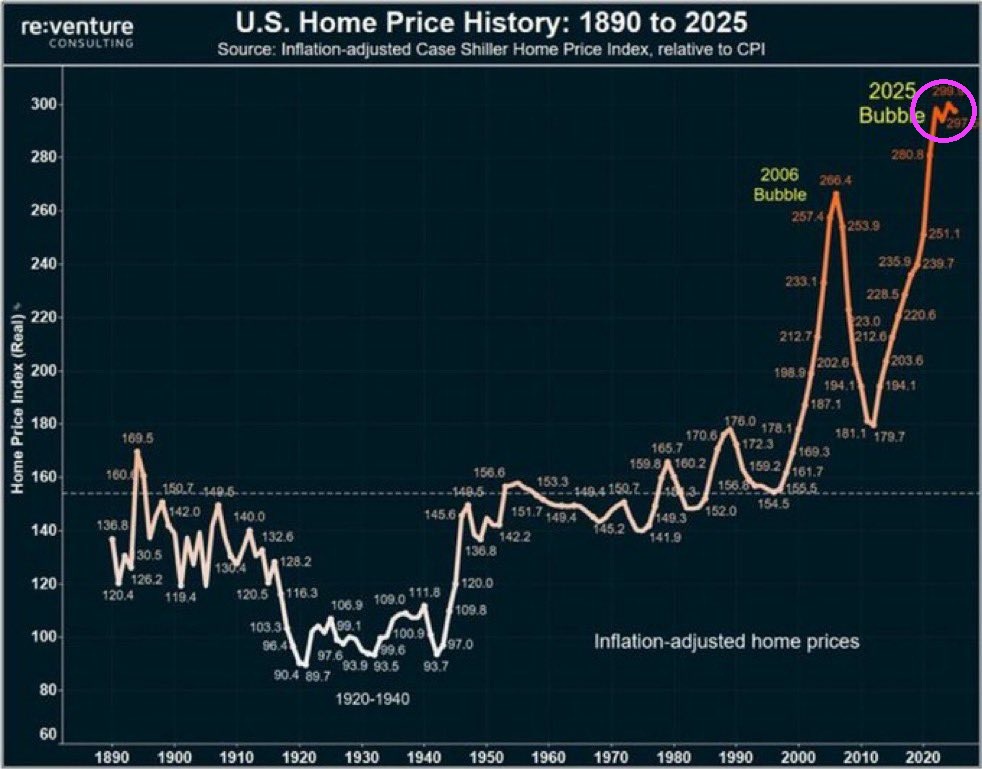
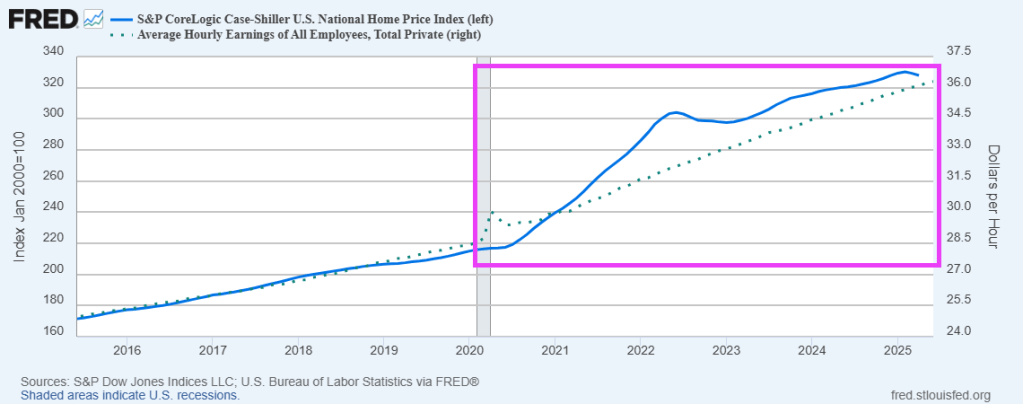
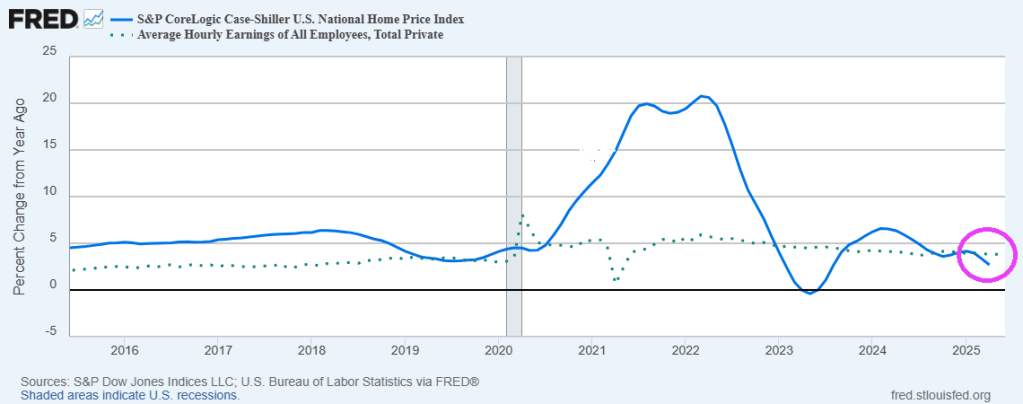
The US housing market is finally slowing down in terms of price growth. But this is after 3 Federal government-fueled house price bubbles.
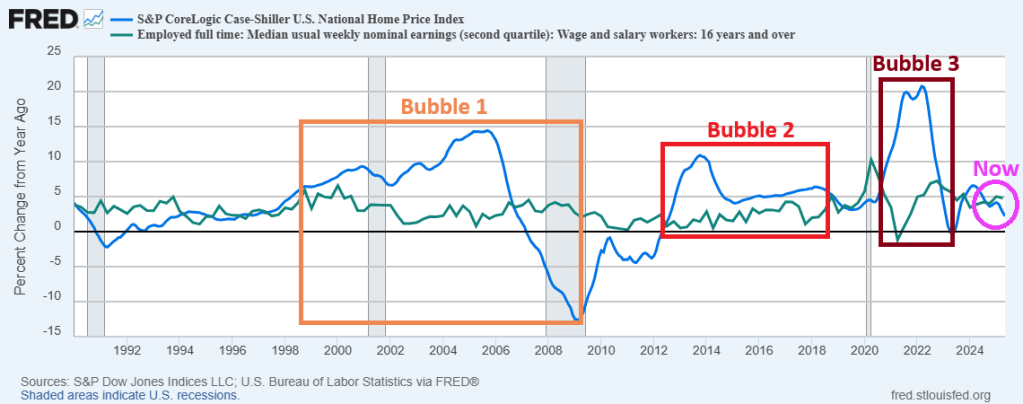
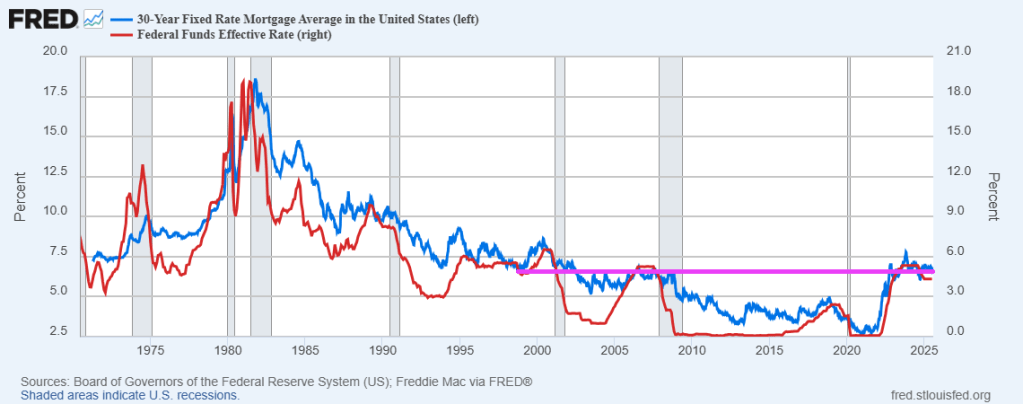
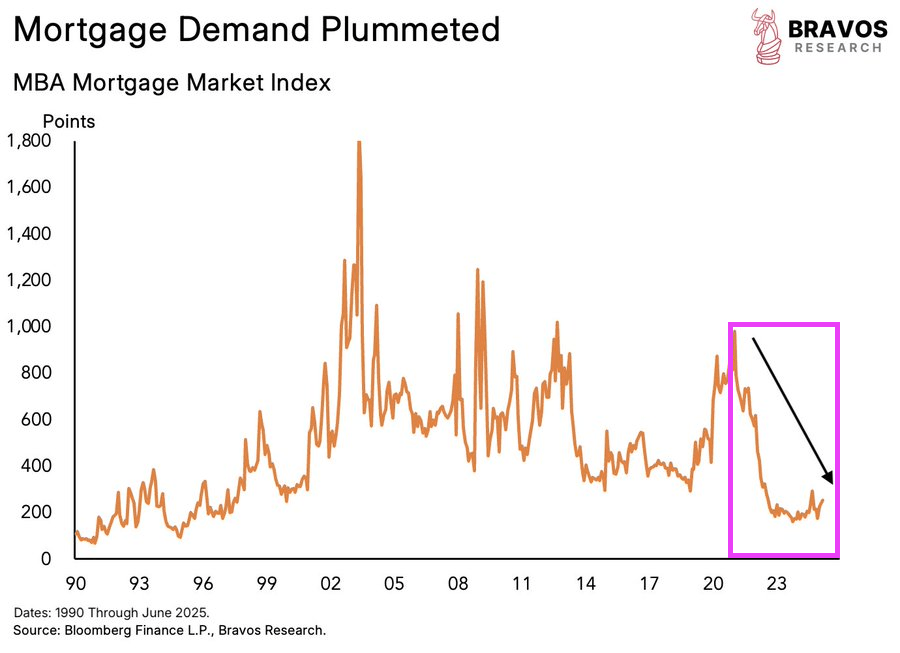
In addition to record-high housing prices, mortgage rates are higher than levels going back to 2006.
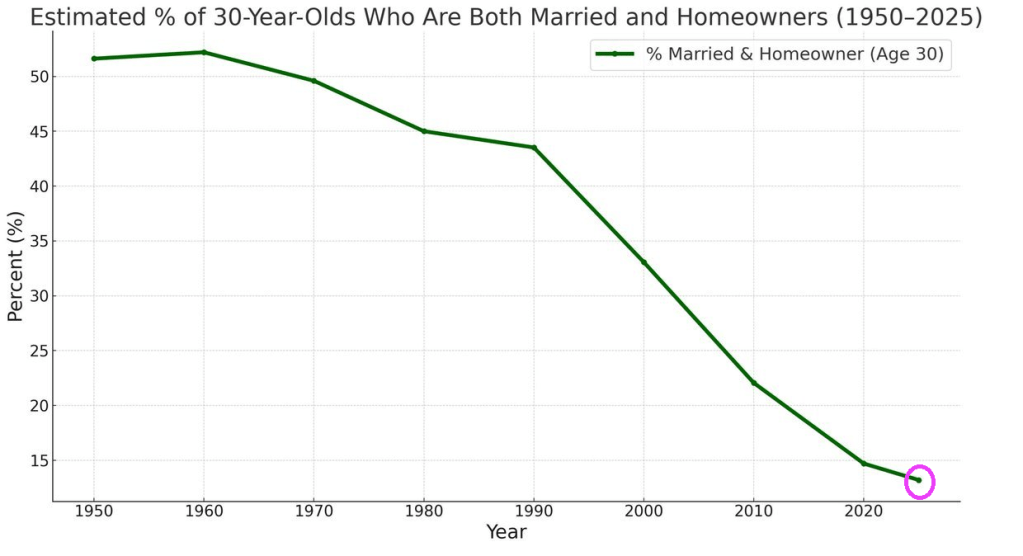
Throw in the “woke” movement, and we have a problem. The percentage of 30-year-olds who are both married and homeowners has plummeted to the lowest level since 1950.
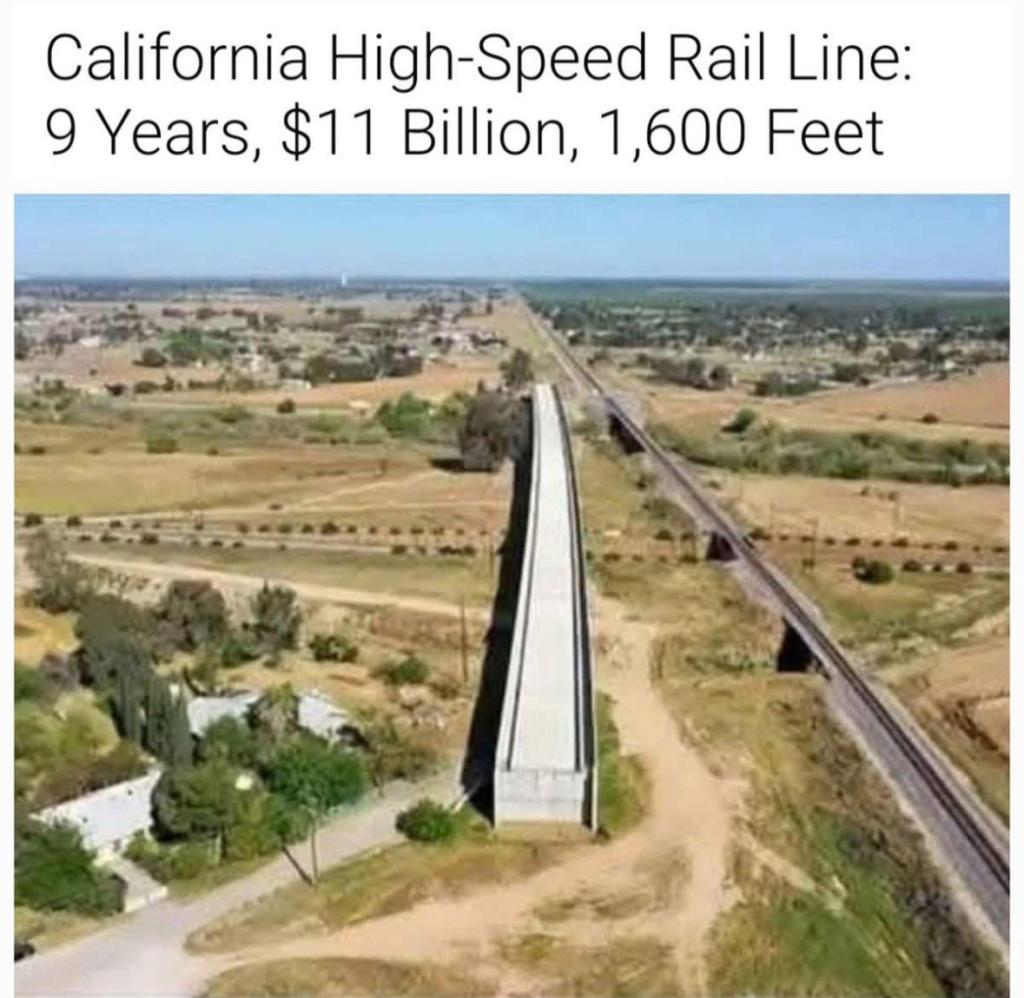
Simply lowering interest rates won’t fix this problem. Much of the housing “crisis” is due to local and state level politicians and their restrictive housing policies. Like LA Mayor Karen “Venceremos Brigade” Bass allocating the burnt-down Pacific Palisades area on the Pacific Ocean to “affordable housing.”


You must be logged in to post a comment.