US prices rose 0.3% MoM in June according to the Bureau of Labor Statistic (BLS). And on a YoY basis, inflation rose 2.7% while core inflation rose 2.9%.
Supercore inflation was up 3.017% YoY.
As of May, import prices rose a scant 0.0% MoM and 0.2% YoY.
Shelter rose 3.8% YoY in June while gas utilities rose 14.2%.
And on this news, the yield on 30-year Treasuries rose 5%.
Tavi Costa at Crescat Capital (founded by my former MBA student at University of Chicago Kevin Smith) produced this excellent chart of silver prices showing the cup and handle of silver prices.
The rise in silver prices corresponds with a deterioration of the US bond market. Look at Treasury futures courtesy of Bravos Research.
Of course, Washington DC’s insane spending has led to insane money printing by The Feral Reserve.
Everyone in Washington DC deserves a “Silver Cup of Failure” for uncontrolled government waste and spending and mismanagement by The Feral Reserve.
Thank goodness “Statist Joe” Biden is gone. Kamala Harris is still lingering around the edges, while the mortgage and housing markets are still suffering from the Biden/Harris regulatory overreach.
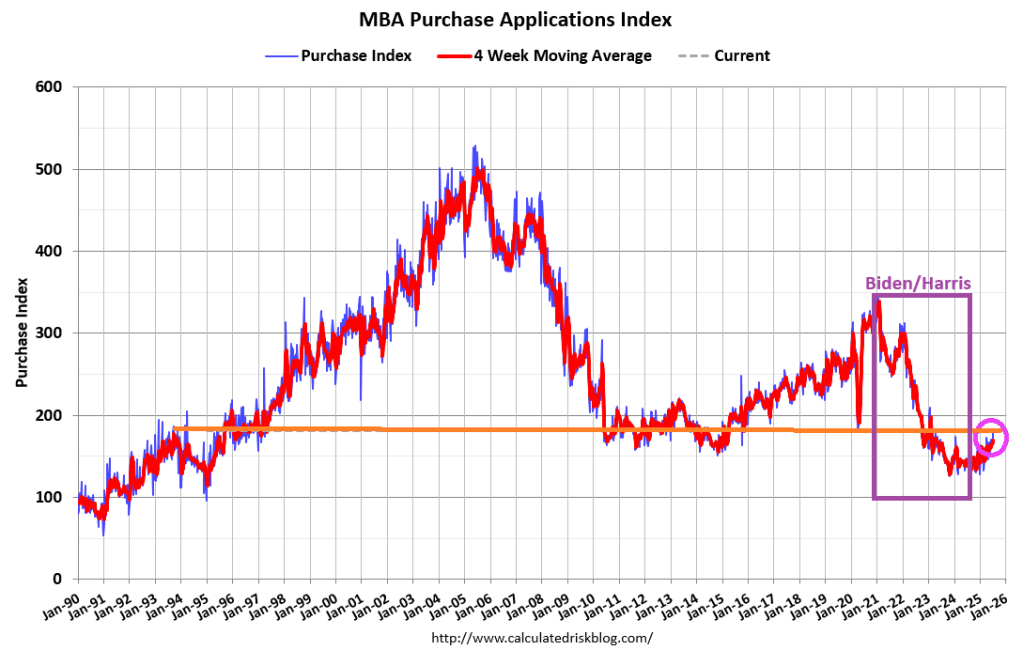
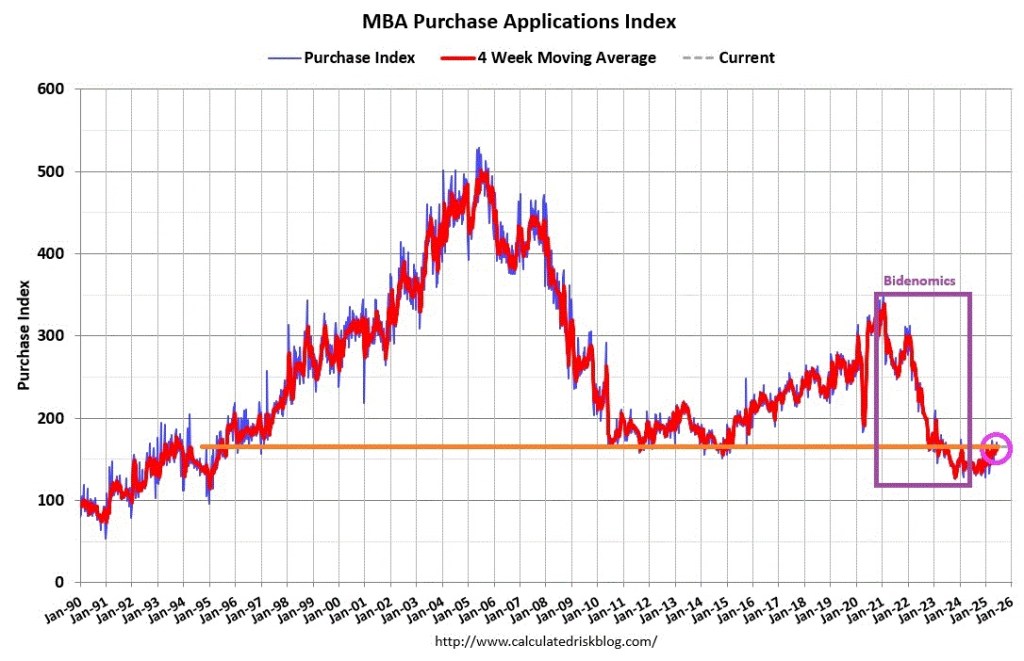
Mortgage applications increased 9.4 percent from one week earlier, according to data from the Mortgage Bankers Association’s (MBA) Weekly Mortgage Applications Survey for the week ending July 4, 2025. Last week’s results included an adjustment for the July 4th holiday.
The Market Composite Index, a measure of mortgage loan application volume, increased 9.4 percent on a seasonally adjusted basis from one week earlier. On an unadjusted basis, the Index decreased 13 percent compared with the previous week. The seasonally adjusted Purchase Index increased 9 percent from one week earlier. The unadjusted Purchase Index decreased 13 percent compared with the previous week and was 25 percent higher than the same week one year ago.
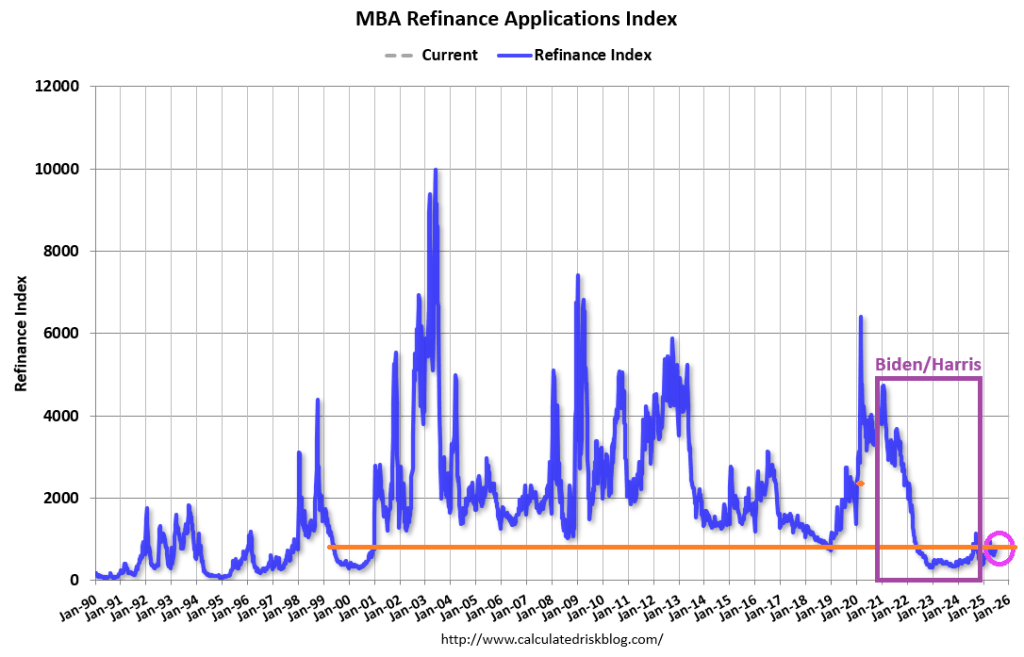
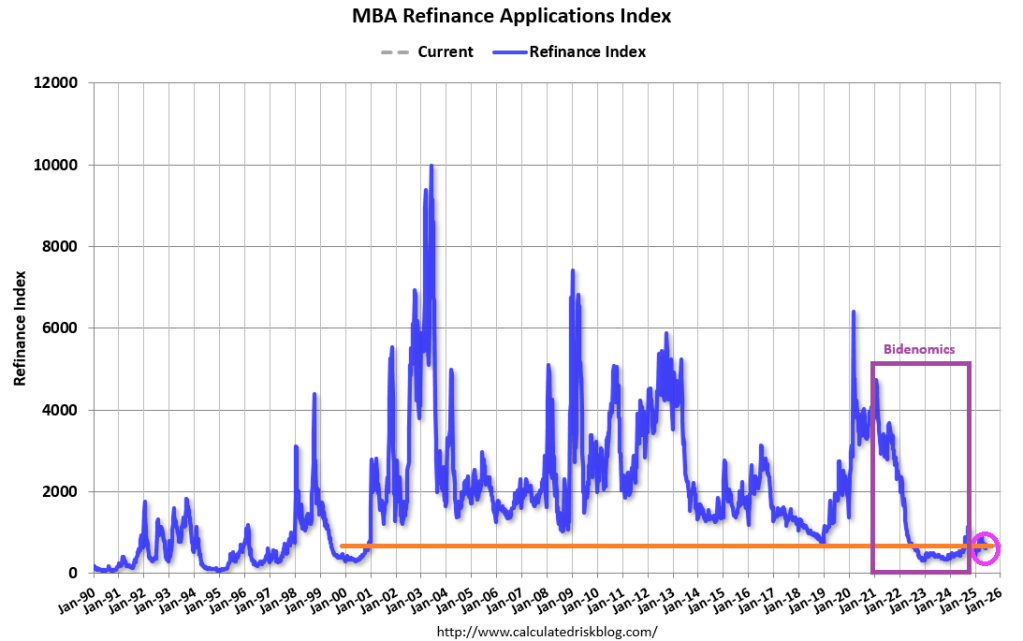
The Refinance Index increased 9 percent from the previous week and was 56 percent higher than the same week one year ago.
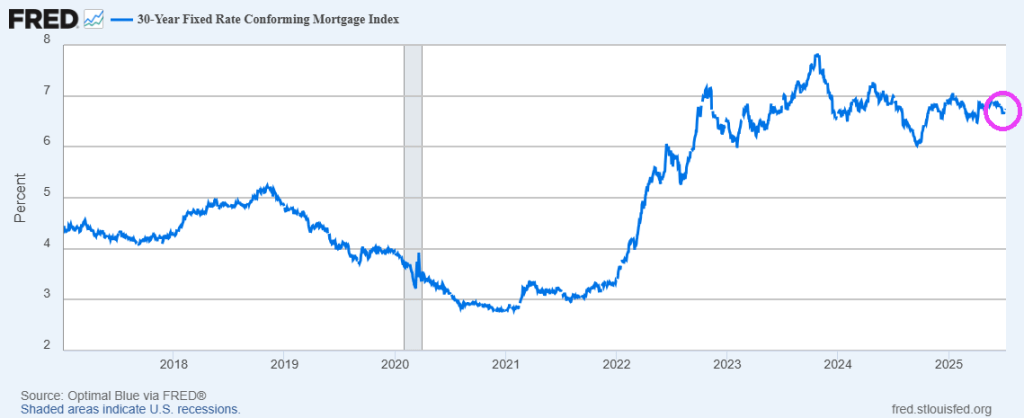
Mortgage rates moved lower last week, with the 30-year fixed rate decreasing to 6.77 percent, its lowest level in three months. After adjusting for the July 4th holiday, purchase applications increased to the highest level of activity since February 2023 and remained above year-ago levels.
Biden claims the foreign leaders have been calling him for advice. Here is one example.
It’s Gov’t Gone Wild! That includes The House, Senate, President and Federal Reserve.
The purchasing power of the US Dollar was $1004.4 on 1915-03-01. By 2025-05-01, the purchasing power fell to $31.1, a loss of 97%. Public debt since the last year of GW Bush, Obama/Biden (with a brief hiatus with Trump) rose 317% since January 2009.
Finally, US government debt growth (YoY) was approximately equal to US nominal GDP growth in Q1 2025.
Unfortunately, the BBB (Big Beautiful Bill) is projected to add $3.9 trillion of debt. Unfortunately, there are insufficient spending cuts in the BBB. And the Senate just nixed kicking illegal immigrants off of Federal healthcare programs.
Unfortunately, GDP growth is only expected to be modest with debt growth once again rising faster than GDP growth. As Diane Feinstein once said, politicians are elected to spend money. This, of course, was a ridiculous statement embraced by spend-crazy Democrats and RINOs.
So, Congress has committed American taxpayers to debt slavery.
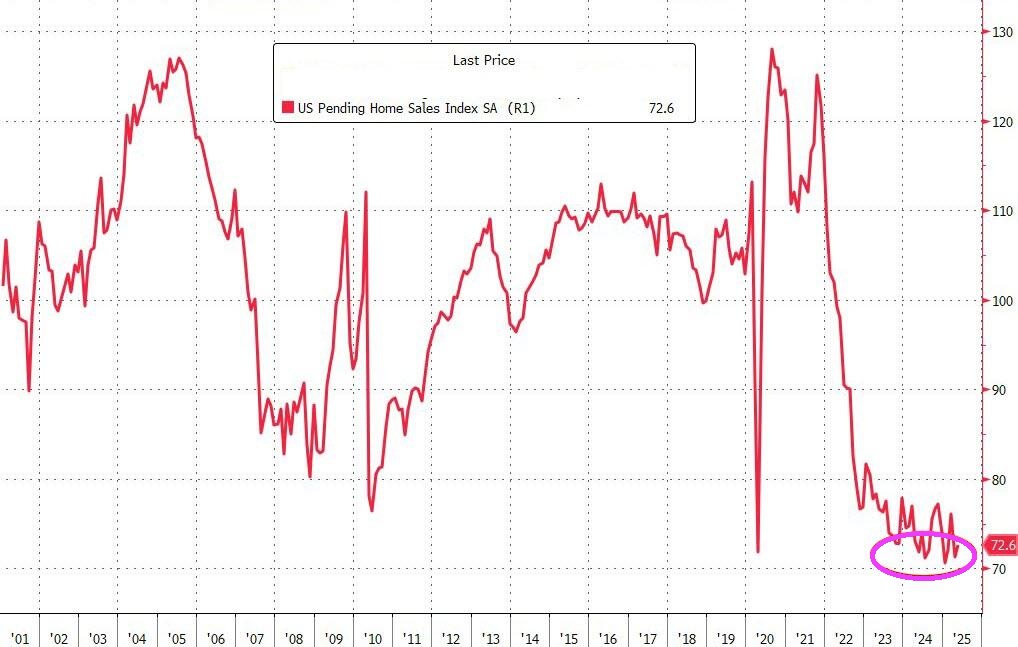
I sure hope this isn’t a repeat of the financial crisis! But new homes for sale have ballooned to financial crisis levels.
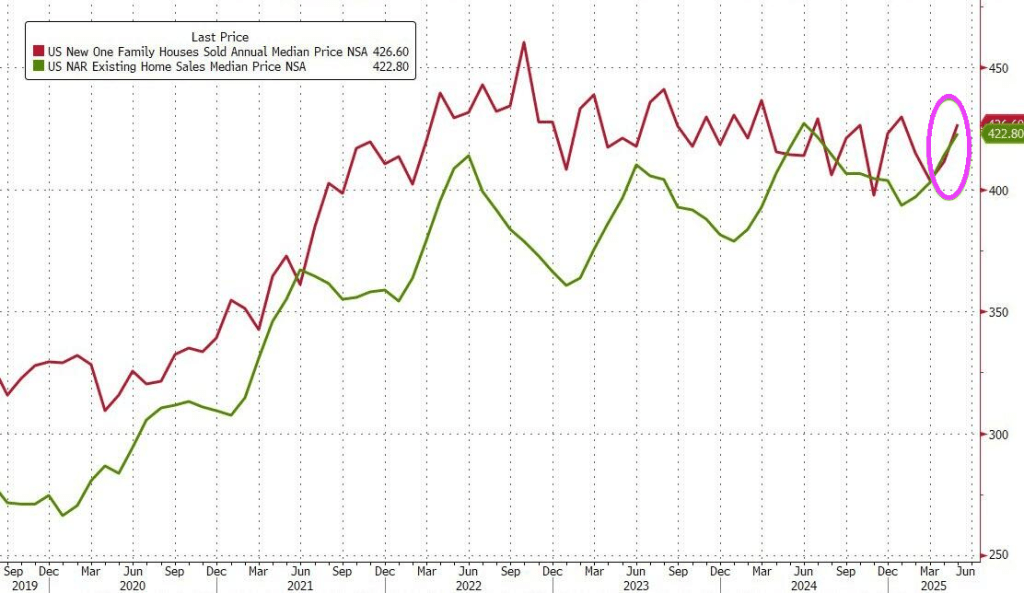
Home sales have dropped below year-ago levels, presaging likely declines in mortgage supply and turnover. With completed-home inventories hitting post-global financial crisis (GFC) highs, regional surpluses are emerging as key home-price factors, setting the stage for widening pockets of price weakness in the months ahead.
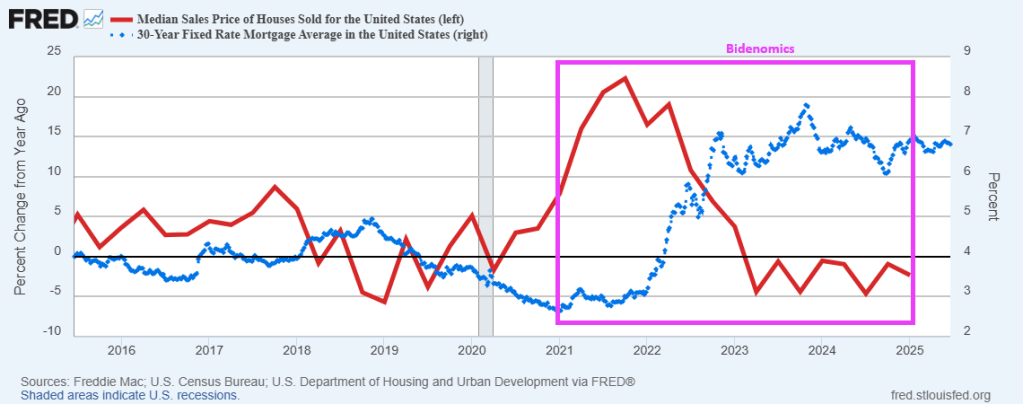
Contributing to the glut of new homes for sale is the rising prices AND higher mortgage rates.
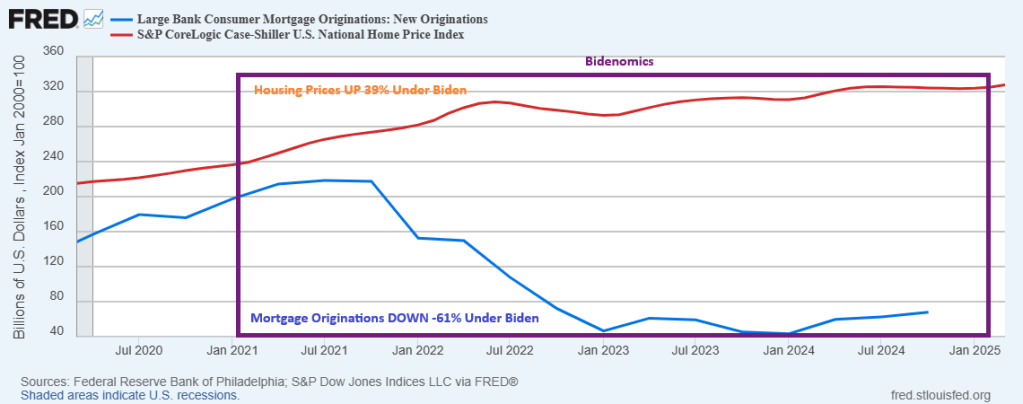
All aboard! The crazy mortgage train! Home prices rose 39% under Biden while mortgage originations at large banks fell -61%. The mortgage market is still recovering from Bidenomics!
Mortgage applications decreased 2.6 percent from one week earlier, according to data from the Mortgage Bankers Association’s (MBA) Weekly Mortgage Applications Survey for the week ending June 13, 2025.
The Market Composite Index, a measure of mortgage loan application volume, decreased 2.6 percent on a seasonally adjusted basis from one week earlier. On an unadjusted basis, the Index decreased 4 percent compared with the previous week. The seasonally adjusted Purchase Index decreased 3 percent from one week earlier. The unadjusted Purchase Index decreased 5 percent compared with the previous week and was 14 percent higher than the same week one year ago.
The Refinance Index decreased 2 percent from the previous week and was 25 percent higher than the same week one year ago.
Home prices rose 39% under Biden while mortgage originations at large banks fell -61%.


You must be logged in to post a comment.