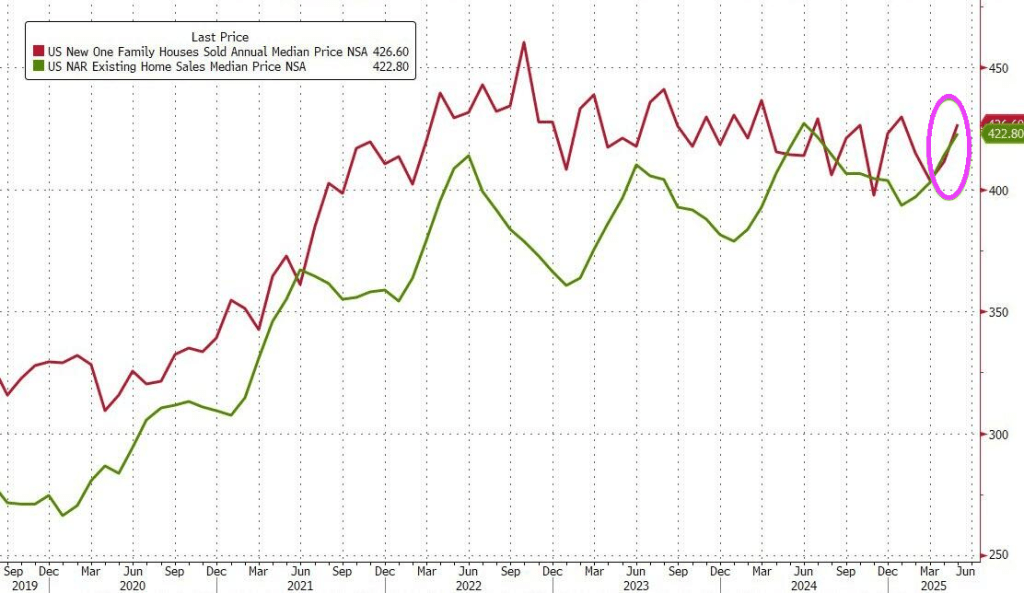
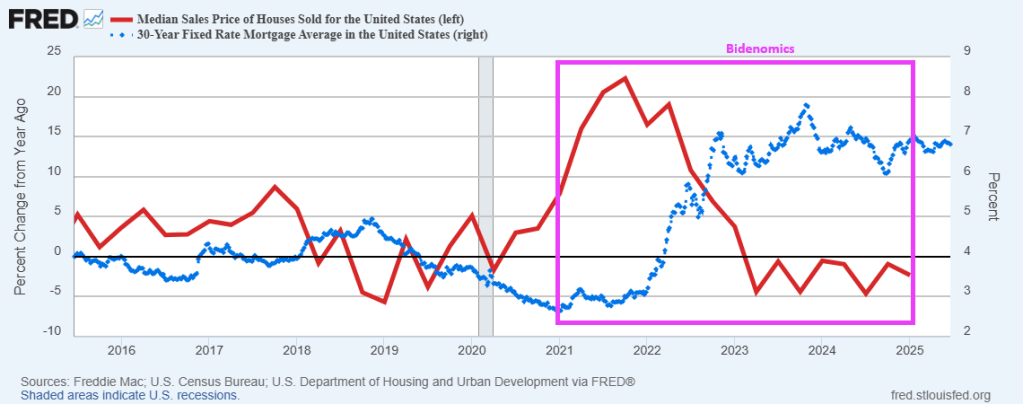
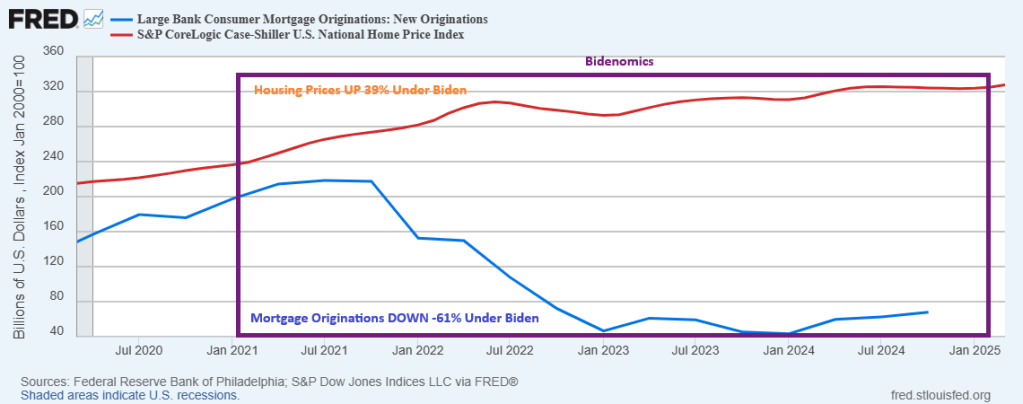
All aboard! The crazy mortgage train! Home prices rose 39% under Biden while mortgage originations at large banks fell -61%. The mortgage market is still recovering from Bidenomics!
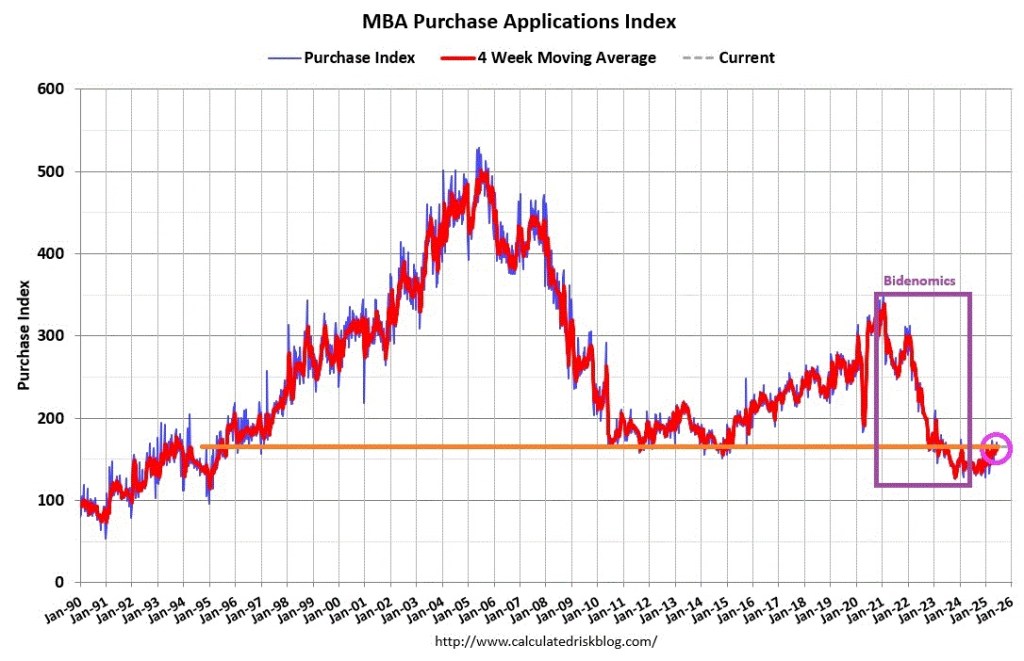
Mortgage applications decreased 2.6 percent from one week earlier, according to data from the Mortgage Bankers Association’s (MBA) Weekly Mortgage Applications Survey for the week ending June 13, 2025.
The Market Composite Index, a measure of mortgage loan application volume, decreased 2.6 percent on a seasonally adjusted basis from one week earlier. On an unadjusted basis, the Index decreased 4 percent compared with the previous week. The seasonally adjusted Purchase Index decreased 3 percent from one week earlier. The unadjusted Purchase Index decreased 5 percent compared with the previous week and was 14 percent higher than the same week one year ago.
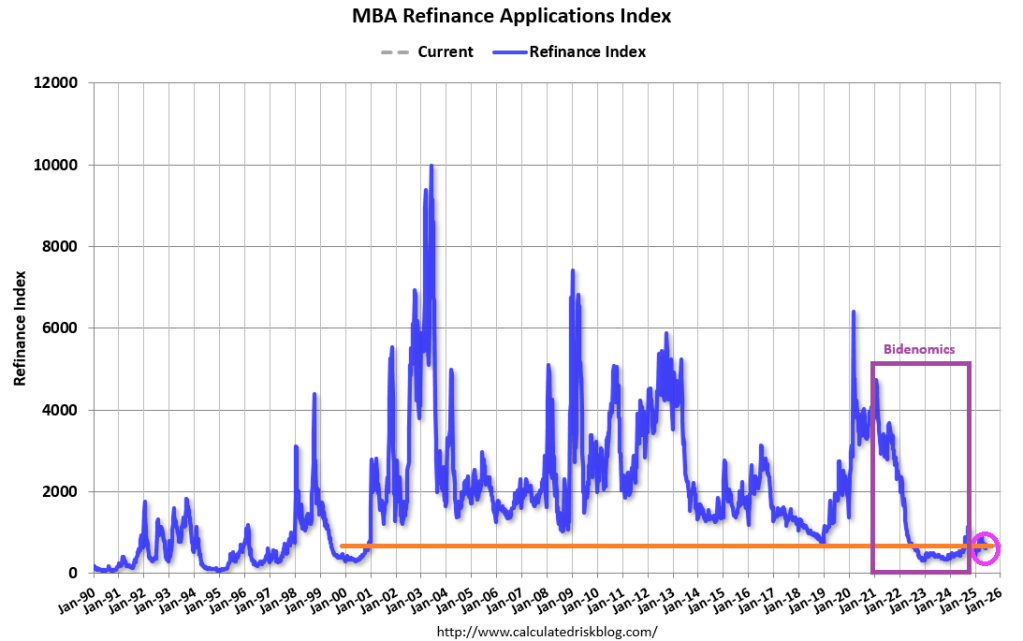
The Refinance Index decreased 2 percent from the previous week and was 25 percent higher than the same week one year ago.
Home prices rose 39% under Biden while mortgage originations at large banks fell -61%.
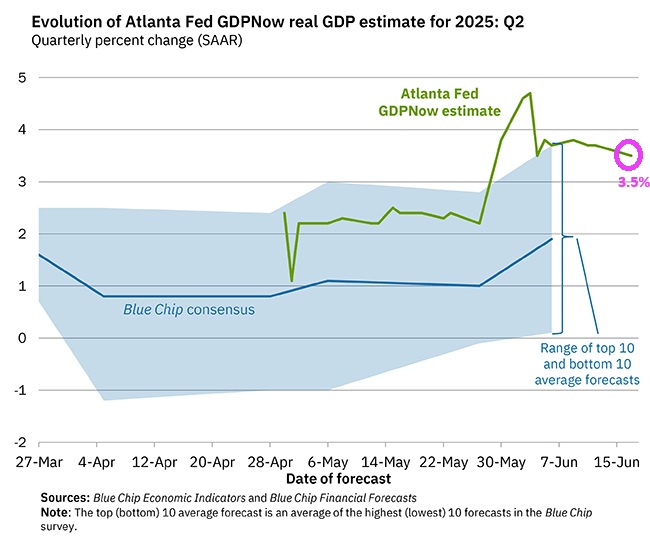
The GDPNow model estimate for real GDP growth (seasonally adjusted annual rate) in the second quarter of 2025 is 3.5 percent on June 17, down from 3.8 percent on June 9. After recent releases from the US Census Bureau, the US Bureau of Labor Statistics, the Federal Reserve Board of Governors, and the Treasury’s Bureau of the Fiscal Service, the nowcasts of second-quarter real personal consumption expenditures growth and second-quarter real government expenditures growth decreased from 2.5 percent and 2.3 percent, respectively, to 1.9 percent and 2.1 percent, while the nowcast of second-quarter real gross private domestic investment growth increased from -1.9 percent to -1.4 percent.
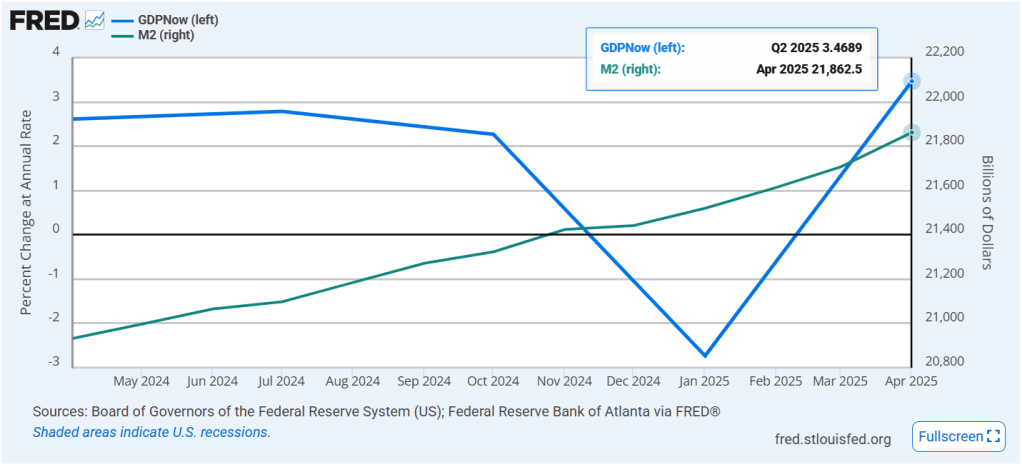
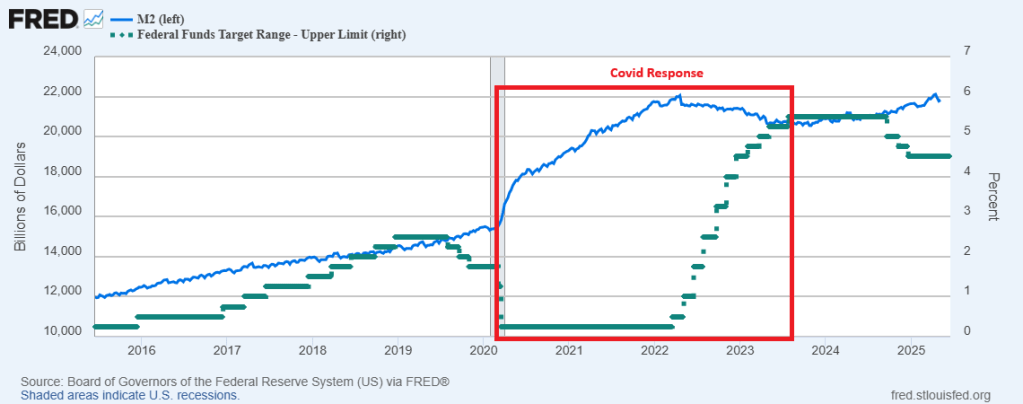
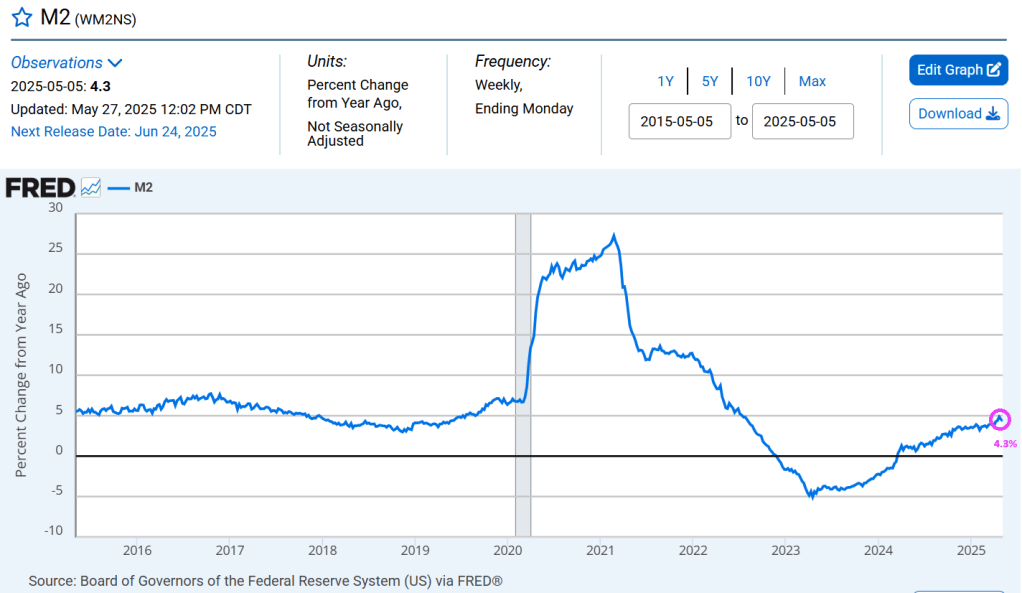
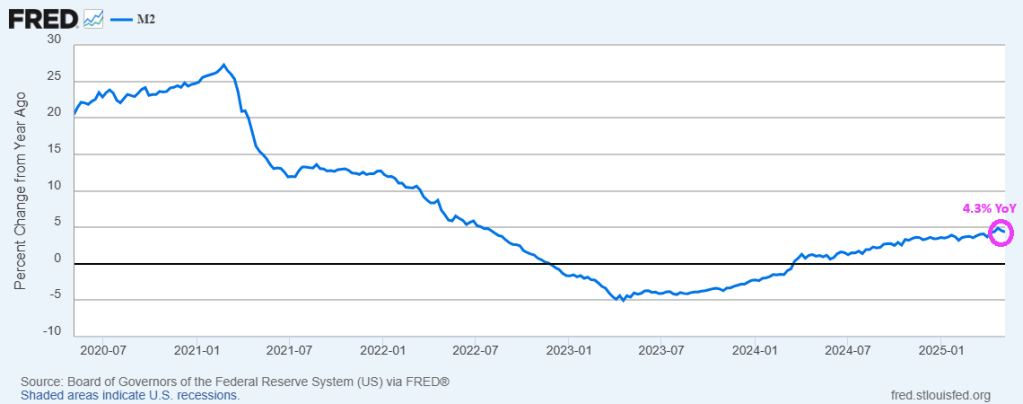
GDP growth corresponds to Fed money printing.
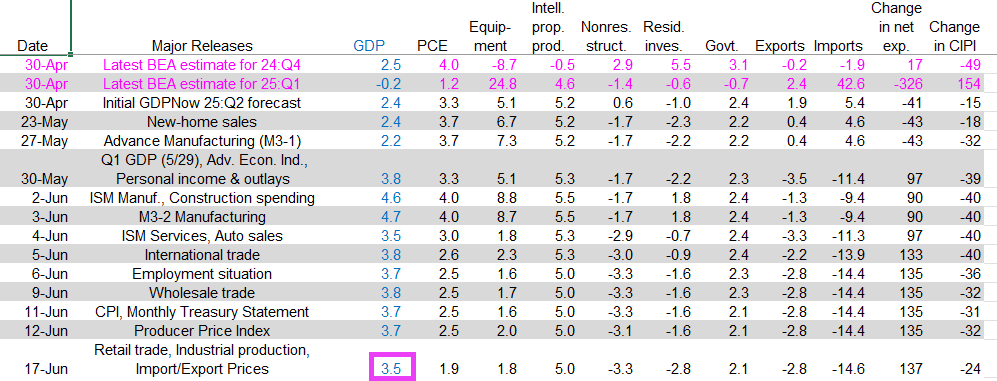
Here is the breakdown. True, real GDP growth has been slowing over June.
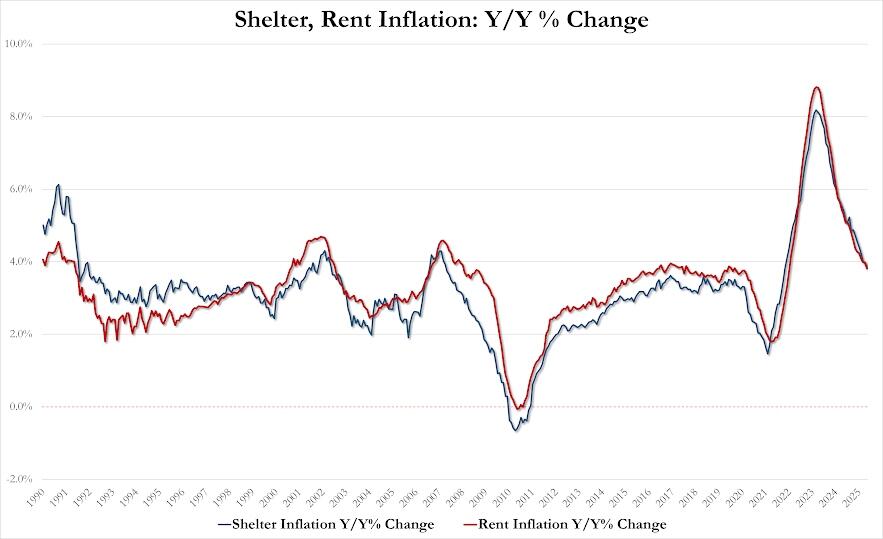
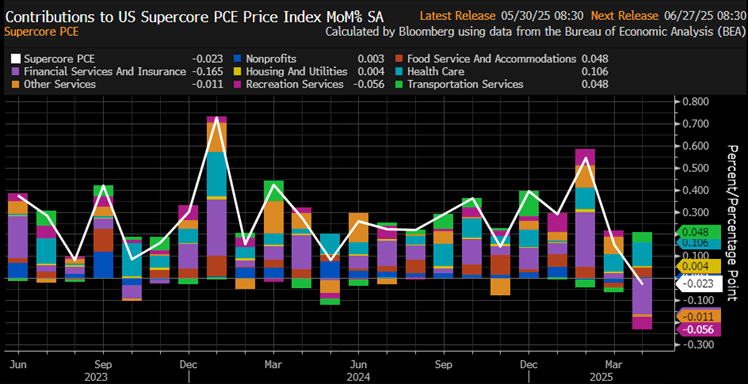
May Rent inflation 3.81% YoY, down from 3.98% in April, lowest since Jan 2022.
May Shelter inflation 3.86% YoY, down from 3.99% in April, lowest since Nov 2021
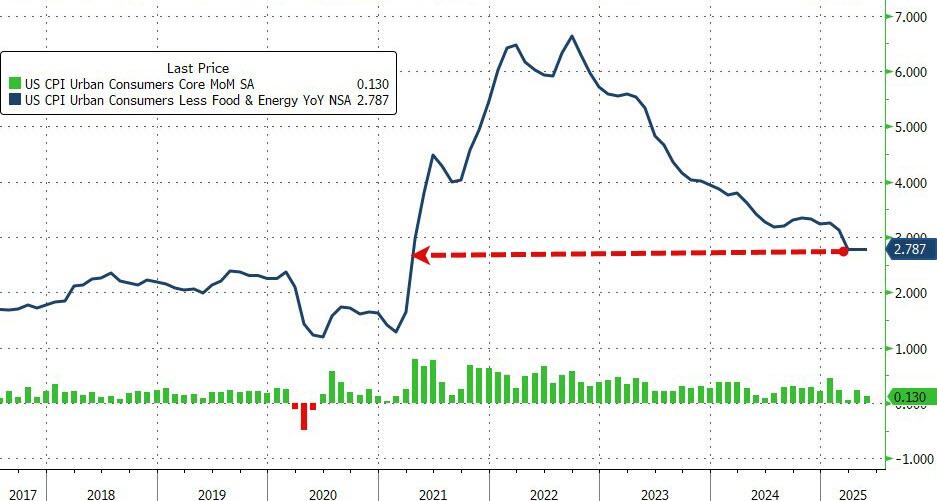
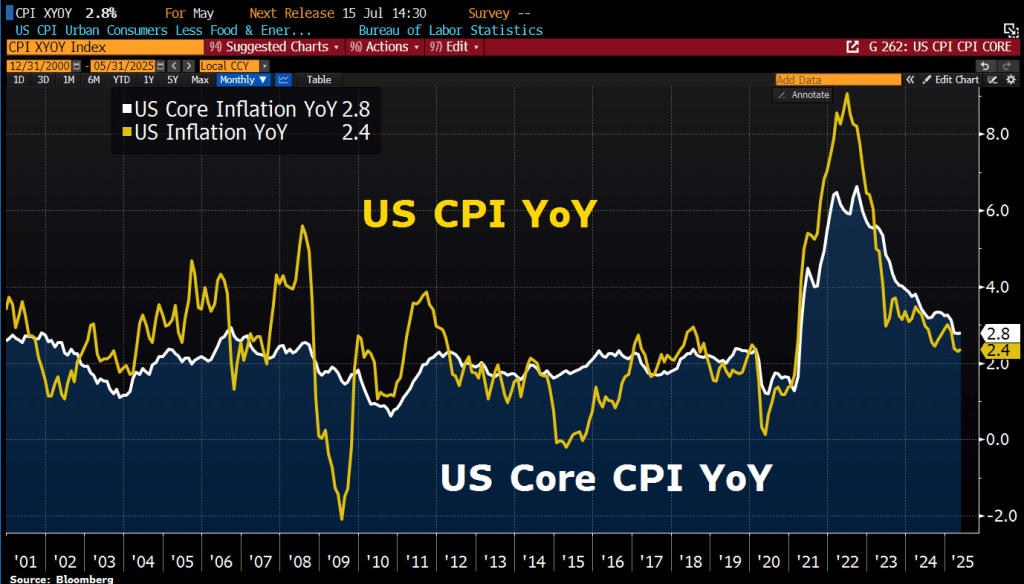
In general, CPI increased 0.1% MoM after rising 0.2 percent in April; Over the last 12 months, the all items index increased 2.4 percent before seasonal adjustment. The index for all items less food and energy rose 0.1% in May, following a 0.2% increase in April.
The index for shelter rose 0.3% in May and was the primary factor in the all items monthly increase. The food index increased 0.3% as both of its major components, the index for food at home and the index for food away from home also rose 0.3% in May.
In contrast, the energy index declined 1.0% in May as the gasoline index fell over the month.
Indexes that increased over the month include medical care, motor vehicle insurance, household furnishings and operations, personal care, and education.
The indexes for airline fares, used cars and trucks, new vehicles, and apparel were among the major indexes that decreased in May.


You must be logged in to post a comment.