Ever wonder why prices are rising so fast? One reason is that with rapidly rising energy prices under the Biden Administration, the costs are getting passed-through to consumers in the form of higher prices.
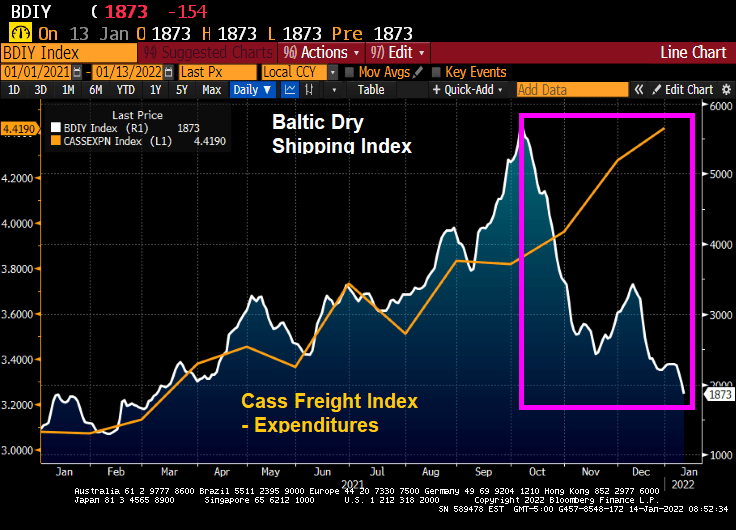
According to the Cass Corp Freight Index, the total spent in December on shipping goods to their customers in the US spiked by 43.6% from December 2020 to December 2021. Not surprising since energy prices over the past year have soared by almost 50%.
But at the same time, the Baltic Dry index (The Baltic Dry Index (BDI) is a shipping and trade index created by the London-based Baltic Exchange. It measures changes in the cost of transporting various raw materials, such as coal and steel) is crashing thanks to FEAR created by Omicron.
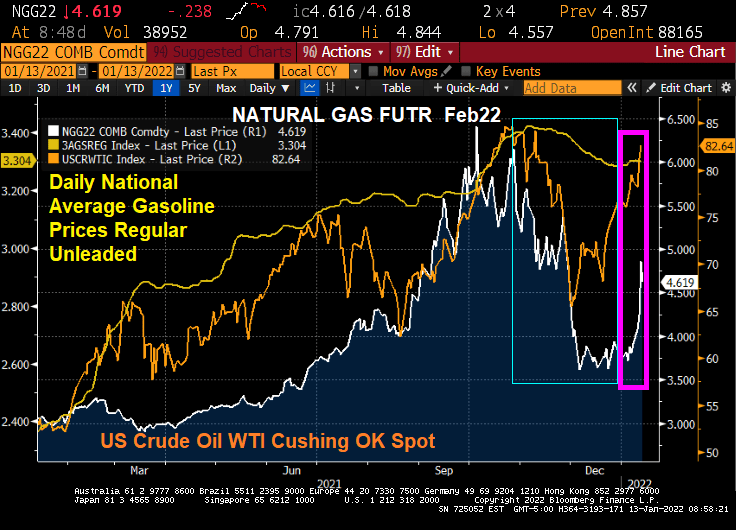
And yes, energy prices are surging again in 2022 after cooling off in Q4 2021.
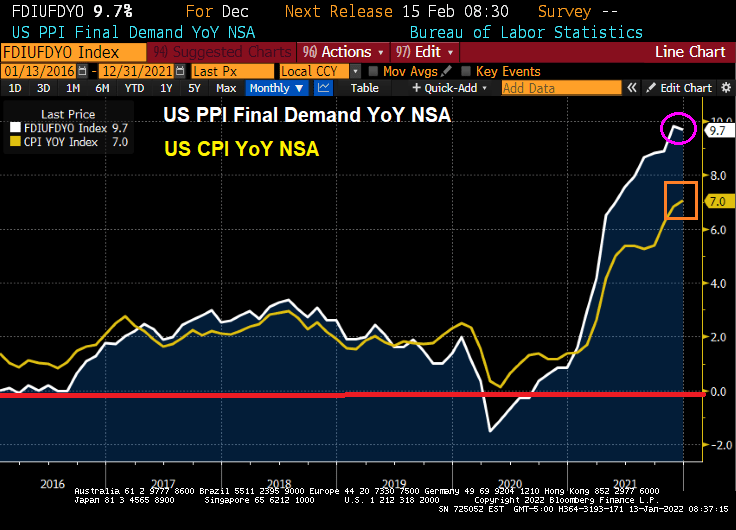
Yesterday’s inflation report was the worst in 40 years. But at least today’s Producer Price Index Final Demand is down slightly from November. But PPI Final Demand YoY is still roaring at 9.7%.
The producer price index for final demand increased 0.2% from the prior month and 9.7% from a year earlier, Labor Department data showed Thursday. The annual advance was the largest in figures back to 2010.
Excluding the volatile food and energy components, the PPI climbed 0.5% in December and was up 8.3% from a year earlier.
Too much Federal government spending, too much Fed monetary stimulus, Omicron helping created labor shortages, etc. But the real killer has been ENERGY prices. Note that natural gas, gasoline and WTI crude oil were falling in November/December helping to slow PPI growth by a smidge. BUT energy prices are skyrocketing in January. So … look for higher PPI in January.
Here is the painting by Thomas Hart Benton that drove “Brokeback Biden” to try to destroy fossil fuel production. Or at least this is Washington DC’s idea of what Oklahoma and Texas are like.
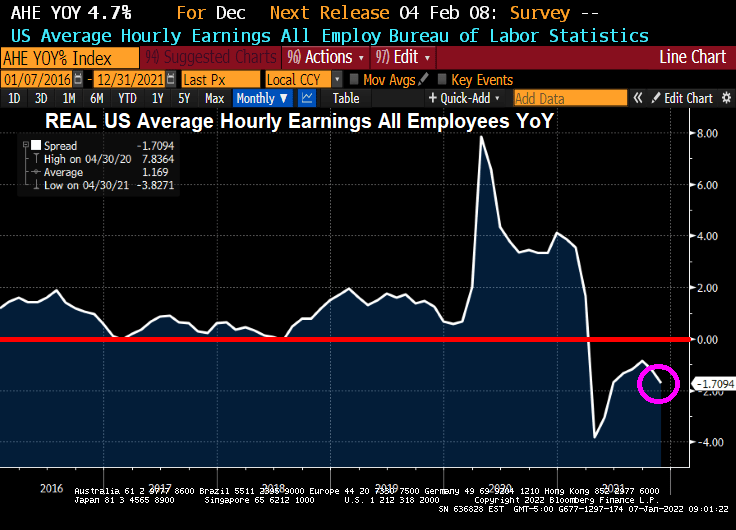
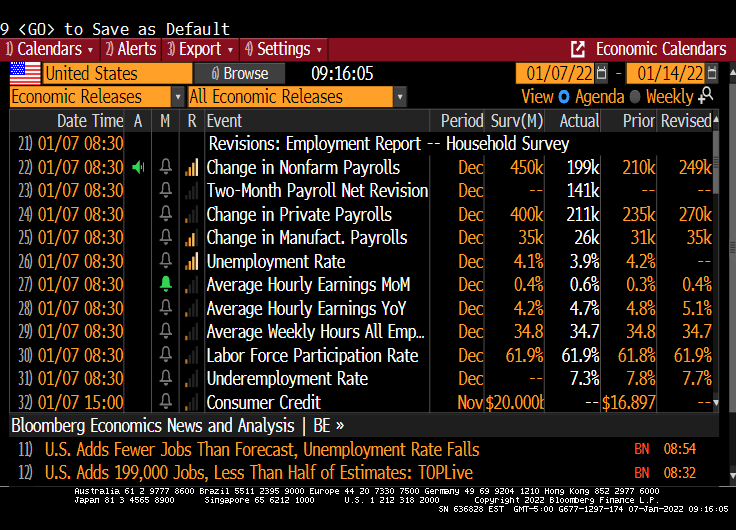
The November jobs report is out and the highlight is that US Average Hourly Earnings GREW at a rate of 4.7% YoY. Unfortunately, inflation is still raging resulting in REAL US Average Hourly Earnings DECLINING at a rate of -1.71% YoY.
REAL US home price growth is slowing and is at 12.856% YoY as REAL average hourly earnings slowed to -1.7094% YoY.
The lowlight of the November jobs report is that only 199K jobs were added versus the 450K jobs expected to be added. At least the unemployment rate fell to 3.9%.
WHERE we the jobs added? Leisure and hospitality led the way! Hey bartender.
Yes, REAL wage growth and REAL home price growth are slowing.
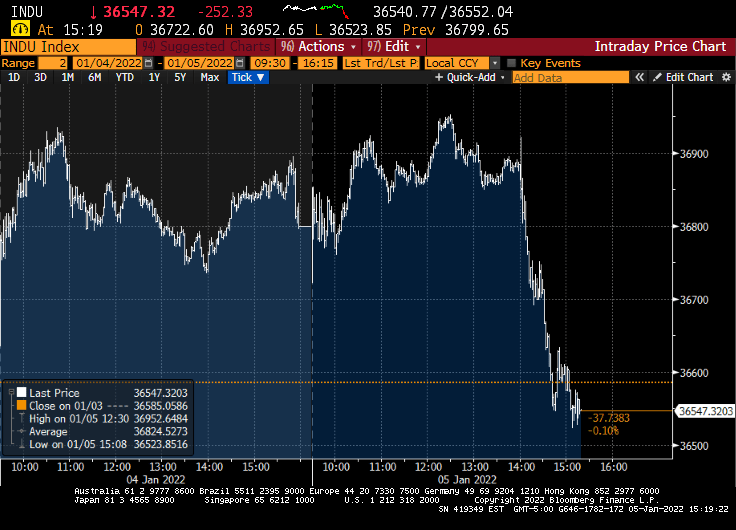
“Some participants also noted that it could be appropriate to begin to reduce the size of the Federal Reserve’s balance sheet relatively soon after beginning to raise the federal funds rate,” the minutes said.
The S&P 500 stock index extended declines following the release and was on track for its biggest loss in more than a month. Treasuries also extended losses and the dollar pared its decline.
At the conclusion of the December meeting, the FOMC announced it would wind down the Fed’s bond-buying program at a faster pace than first outlined at the previous meeting in early November, citing rising risks from inflation. The new schedule puts the central bank on track to conclude purchases in March.
And with the minutes released, the Down dumped.
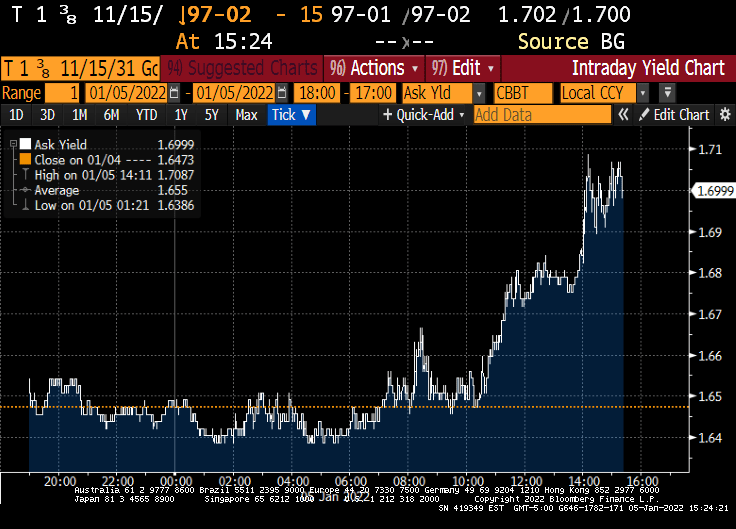
And the 10-year Treasury yield jumped 5.3 bps on the release.
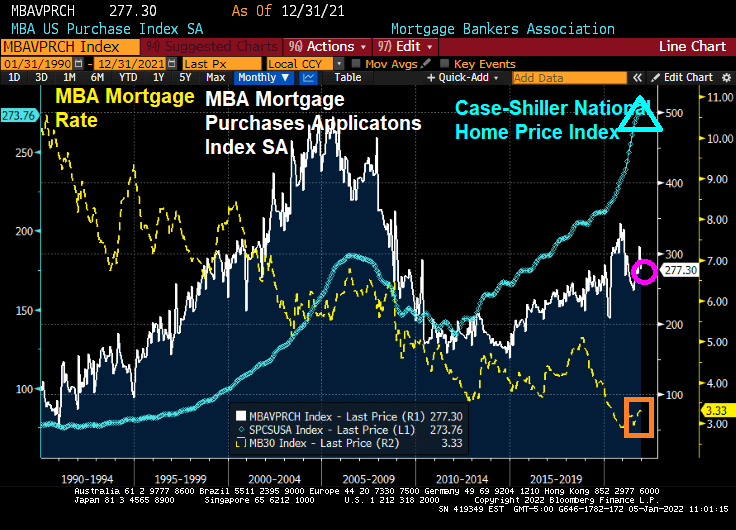
The last mortgage purchase applications index from the Mortgage Bankers Association was released this morning. The headline is “Mortgage Purchase Applications Plunge 10% WoW (since the previous week). But this is called “Seasonality.” And it happens EVERY YEAR.
Here is a chart of mortgage purchase application (NON-seasonally adjusted). What will happen when the new year starts and purchase applications began rising?
Whether seasonally-adjusted or not, all number are down for the final week of 2021, except for the 30-year mortgage rate that rose 60 basis points.
On a seasonally-adjusted basis (aka, smoothed-out), we can see the impact of super-low mortgage rates on home prices.
Here is the data summary for the last week of December 2021. All indices are down … except for the 30 year mortgage rate which was up 60 basis points.
Treasury yields rose a second day, with five-year rates hitting the highest since before the pandemic took hold in the U.S., amid increasing conviction that the Federal Reserve will raise rates at least three times beginning in May.
The five-year Treasury note’s yield climbed as much as 3.8 basis points to 1.392%, the highest since Feb. 20, 2020, while 30-year yields bumped up toward their 200-day moving average.
Yields across the curve are rising for a second straight day, after Monday’s selloff lifted the 10-year note’s yield by nearly 12 basis points in its worst start to a year since 2009. The two-year yield topped 0.80% for the first time since March 2020.
At the 10-year mark, we see Canada’s sovereign notes rising 18.7 basis points.
Also at the 10 year mark, we see the US 1-year breakeven inflation rate (red line) surging.
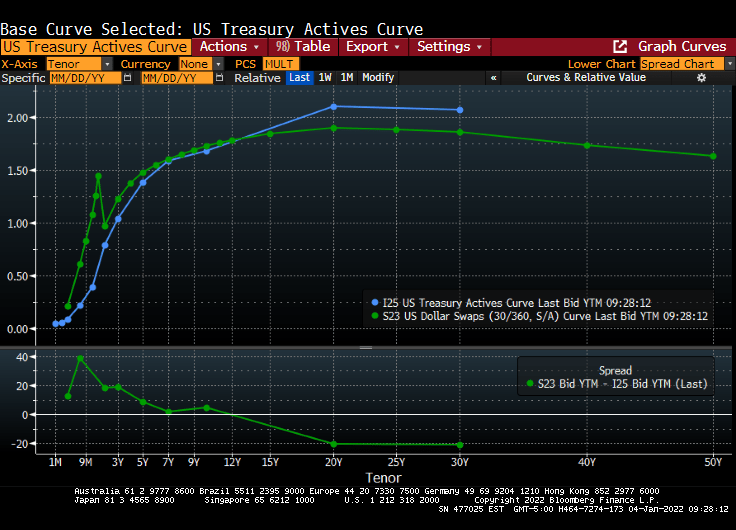
The US Treasury actives curve and Dollar Swaps curve remain steeply upward sloping.
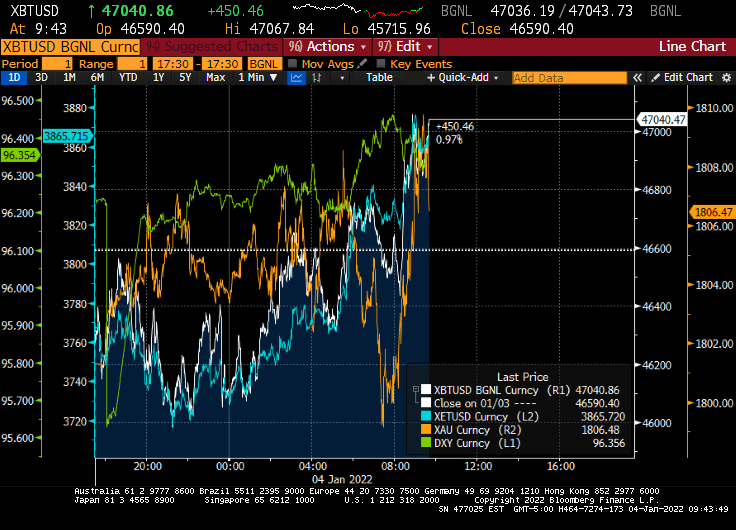
And on the crypto and gold front, gold surged this morning after tanking in the evening, while Ethereum (blue) is doing quite well along with Bitcoin.
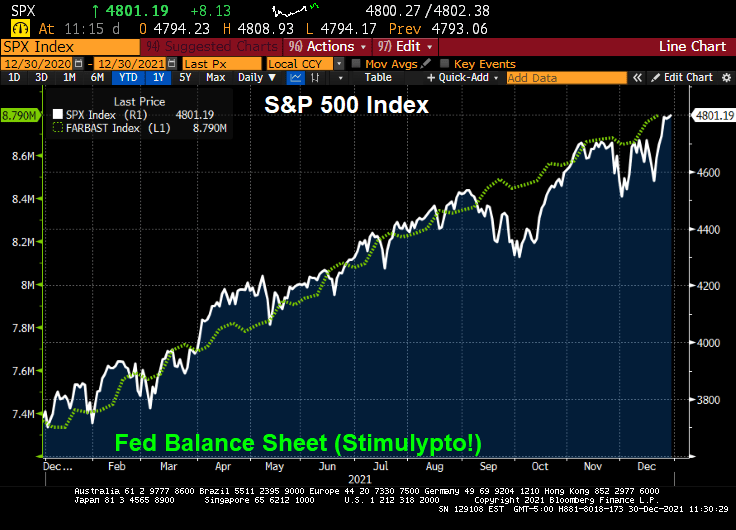
My favorite non-bond, non-alt investment chart. The S&P 500 index charted against The Fed’s M2 Money Stock.
Following my friend Jesse’s habit of posting great French food dishes, here is one from my favorite Parisian eatery, Le Duc de Richelieu. Mmmmmmm.
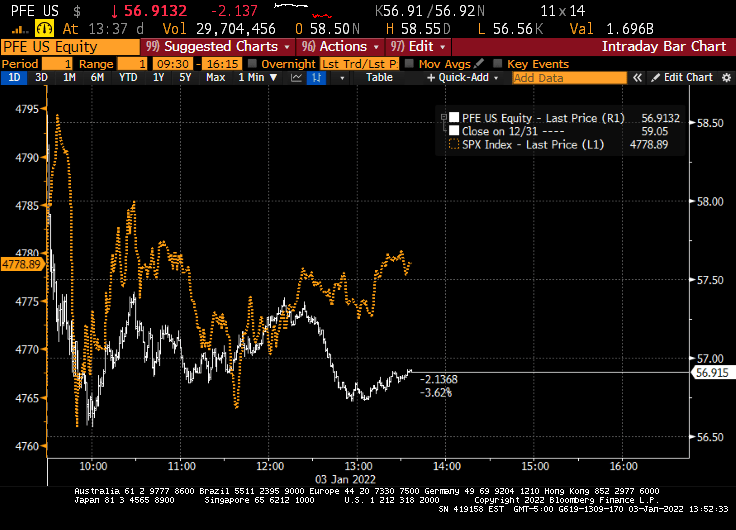
You would think that an FDA approval to give booster shots to millions of new patients would send their stock soaring. It didn’t Pfizer dropped along with the S&P 500 index.
Despite the growth of COVID cases in the US (blue dashed line), Pfizer stock has only gone up by “only” 88% since March 2020. The S&P 500 index rose by 100%.
I under what Pfizer’s performance would be if The Fed wasn’t blowing a hurricane wind at the back of the market.
2021 saw the S&P 500 index generate a return of 28.7%. Much of it thanks to The Federal Reserve “stimulypto” or excessive monetary easing.
But only three hedge funds beat the S&P 500 index: Senvest, Impala and SR. Thanks to fees (trading and management), the other hedge funds underperformed the S&P 500 index. And underperformed The Fed!
Melvin Capital was the worst performing hedge fund of the ones examined.
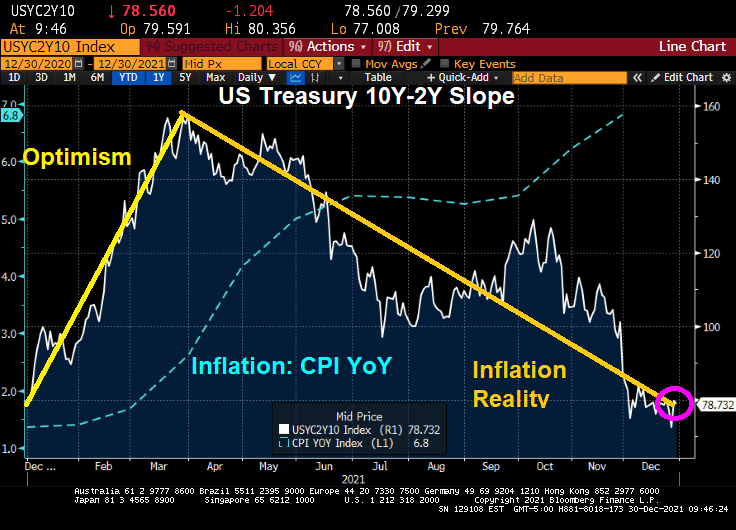
It has been almost a year since Joe Biden has been President of the United States and a Democrat majority took control of The House and Senate. And what has happened to the US Treasury yield curve slope over the past year?
The yield curve is back where it started. There was the “honeymoon effect” where the curve slope rose. After all, Biden was Obama’s Vice President for 8 years and The Democrats has promised so much in the 2020 election. But by early April, the reality of the massive Federal spending (combined with Fed Stimulypto) began showing what was feared: inflation (blue line) started to grow at a rapid rate of speed. With inflation now at 6.8% YoY,
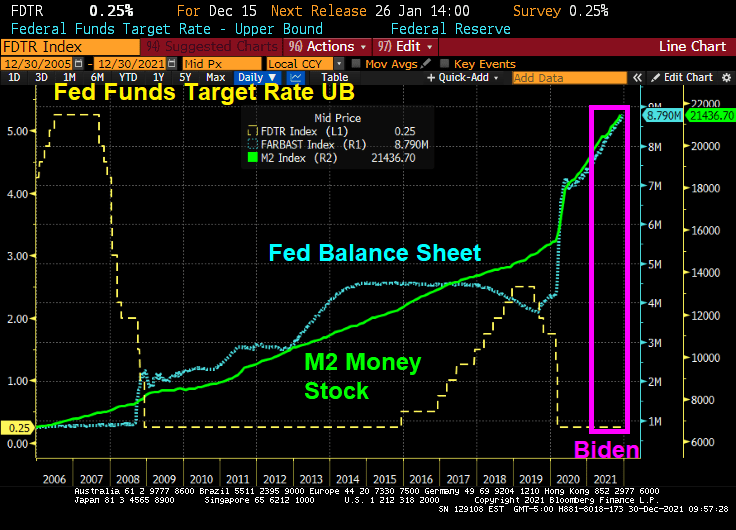
In fairness to Biden, The Federal Reserve has been overstimulating the economy since The Federal Reserve since Ben Bernanke and the Fed Open Market Committee (FOMC) dropped the hammer on The Fed Funds Target Rate once the rate hit 5.25% in September 2007. They kept cutting it reached 25 basis points (or 0.25%) in December 2008. In August 2008, Bernanke and Company began their “Quantitative Easing” or asset purchasing programs. Between The Fed’s Target Rate and QE, The Fed has continued to overstimulate markets ever since. Under Biden, The Fed Funds Target Rate remains at 0.25% and The Fed’s Balance sheet has grown to $8.79 Trillion (bigger than the entire economies of Japan and Germany put together!).
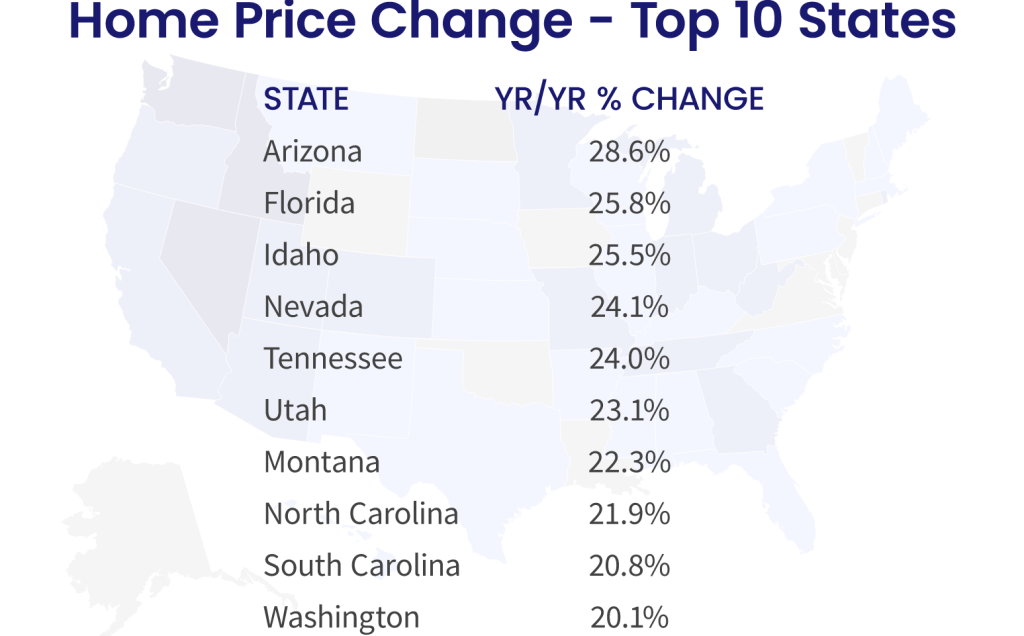
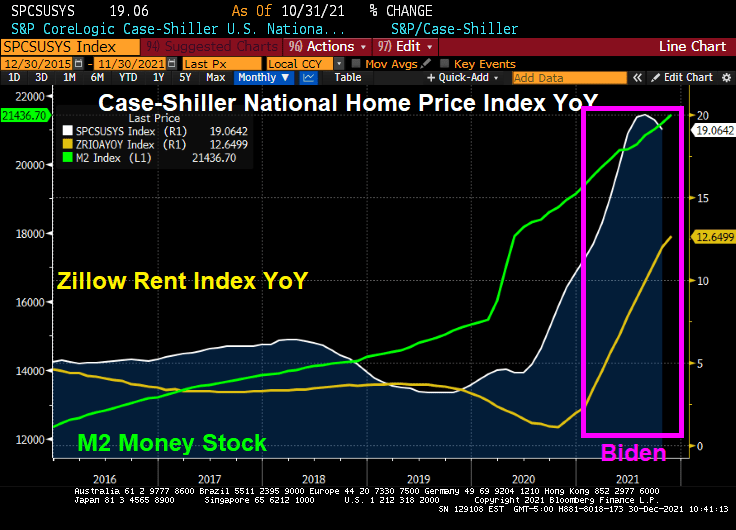
How about housing? Home prices are growing at 19% YoY while rents are growing at 12.65% YoY.
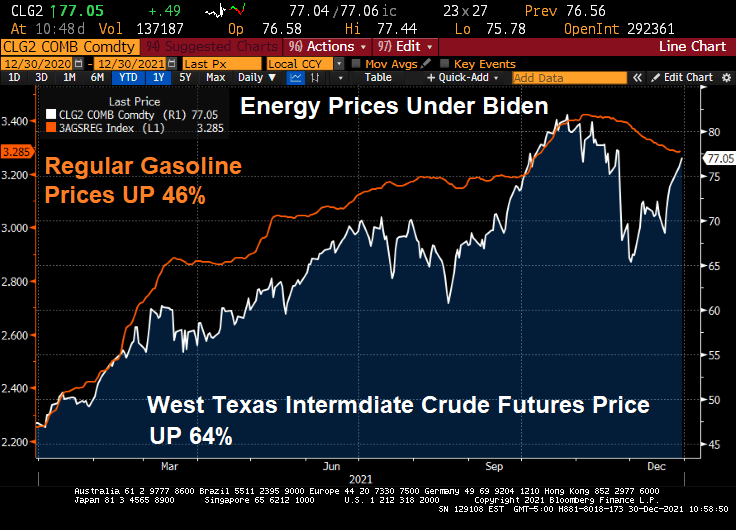
Energy prices have risen dramatically under Biden. Gasoline is up 46% despite a slight reprieve recently. WTI crude prices are up 64%.
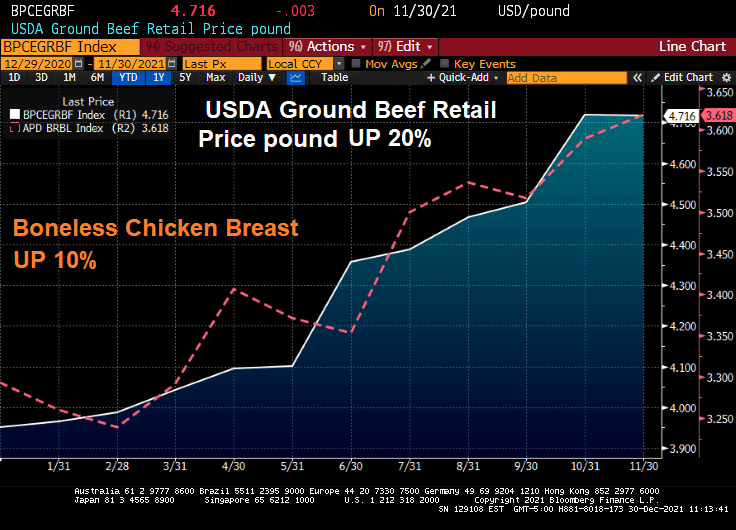
How about food? Beef prices are up 20% and chicken prices are up 10%.
On a positive note, the S&P 500 index has soared … thanks has soared during Biden’s term thanks to Fed stimulus and Federal spending on COVID.
The Build Back Better Act if passed (in its entirety or on a piecemeal basis) will lead to even MORE inflation.
Perhaps Biden’s spokesperson Jen Psaki can recreate the Biden Administration as a lovable, hilarious family like the comic strip Gasoline Alley with old Joe Biden as Skeezix. And insider-trading star, House Speaker Nancy Pelosi as the family matriarch.


You must be logged in to post a comment.