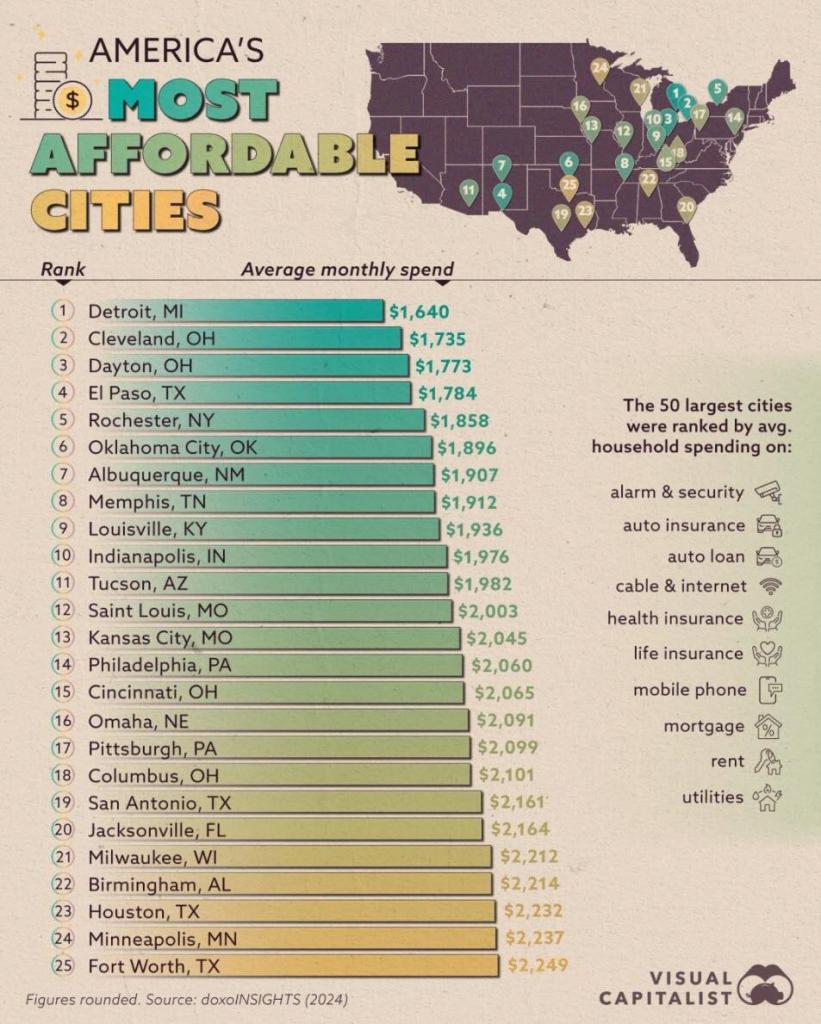
The Visual Capitalist calls most unaffordable cities as least affordable. San Jose California and New York City are the two most unaffordable cities in the USA. According to household spending.
Fortunately, I live in Columbus Ohio. the 18th most affordable city in the USA.
Much of the difference amongst cities is land use and construction restraints. And booming/dying local economies.
As a sad reminder about the last four years, Pete Buttigieg will leave his post as Transportation Secretary having spent $7.5 BILLION to build 8 EV charging stations.
I can’t wait for Billions Biden, The DC parasite who selectively shoves billions of dollars to his friends and nothing for the others. For example, bailing out the LA wildfires but stiffing the people of North Carolina and Florida for hurricane/flood damage. And funding Ukraine while real wage growth is negative. And heavy investment in green energy, the ultimate fool’s errand.
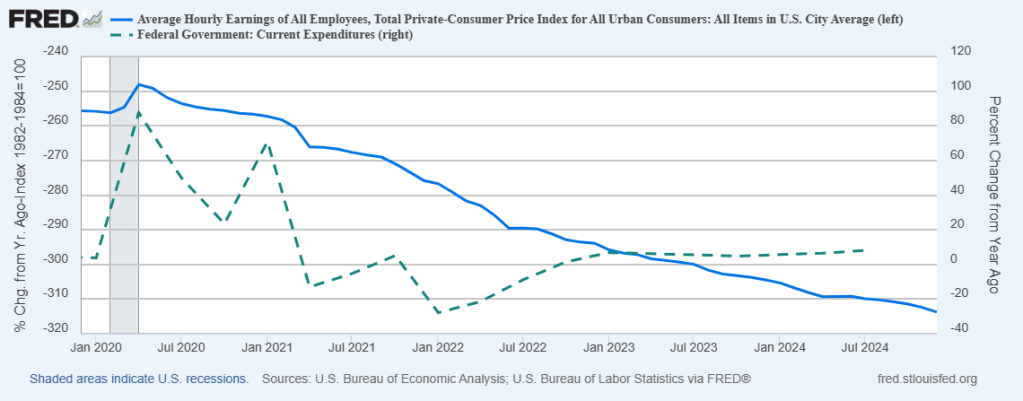
Let’s start with declining real wage growth under Biden/Harris (blue line). Meanwhile, Federal government spending (dashed green line) continues to grow causing inflation.
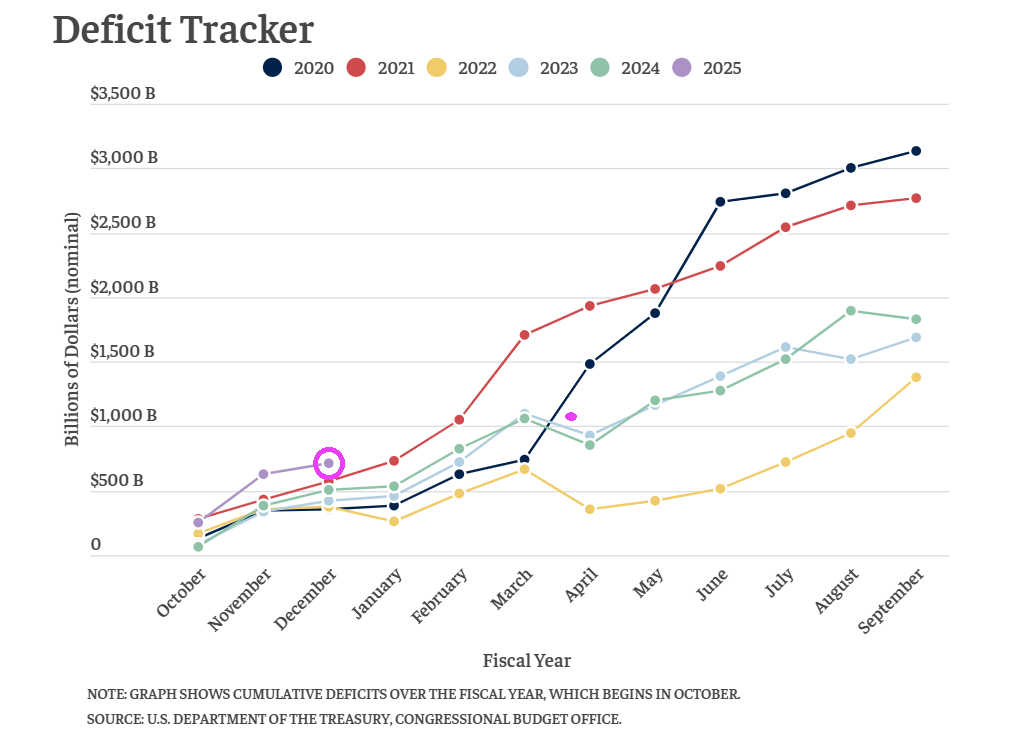
Meanwhile, Biden/Harris and Congress left Trump with the largest budget deficit in history. Like endlessly funding Ukraine and illegal immigration.
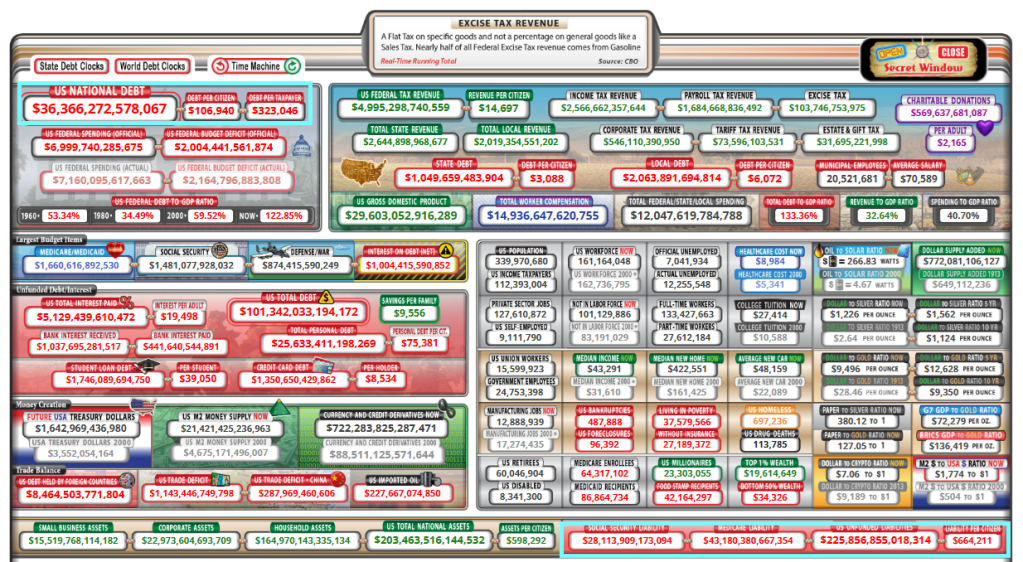
Leaving American taxpayers with growing Federal debt of $36+ trillion. And unfunded liabilities of $226 trillion, over 6 times the national debt.
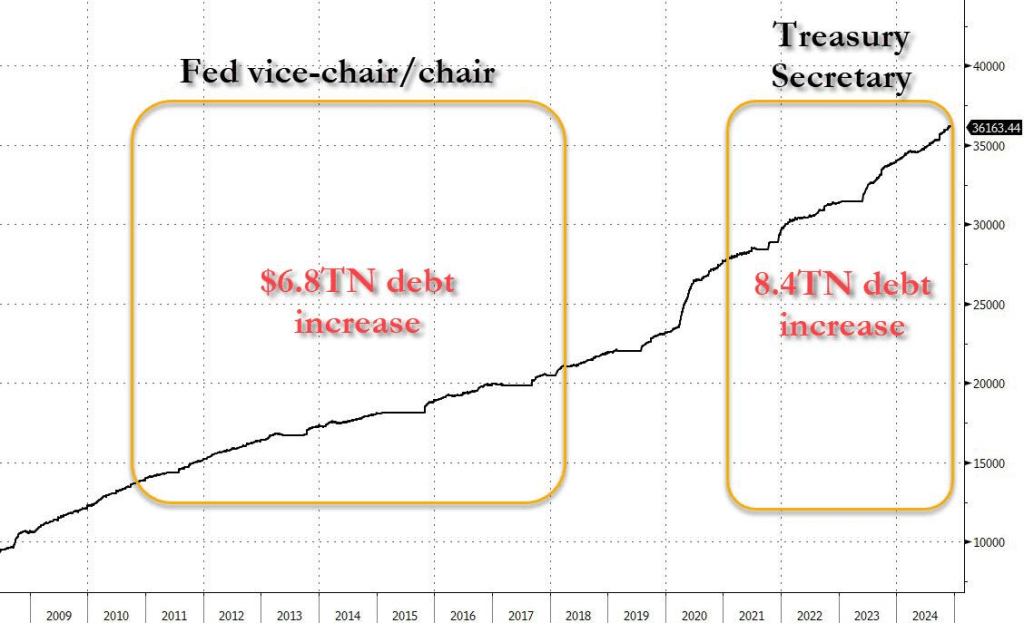
The US will hit its debt ceiling the day after President Trump is inaugurated, and Yellen said that the Treasury will launch “extraordinary measures” to stave off the threat of a national default. Bear in mind, Janet Yellen personally oversaw total debt increase by a staggering $15 trillion. Way to go, Janet!
I wonder how Trump’s Treasury secretary will handle this? At least better than Janet Yellen, I hope!
I remember giving a speech to Federal regulators in Washington DC and discussing the rise of housing rentership in the US. I said the US is veering towards a renter nation.
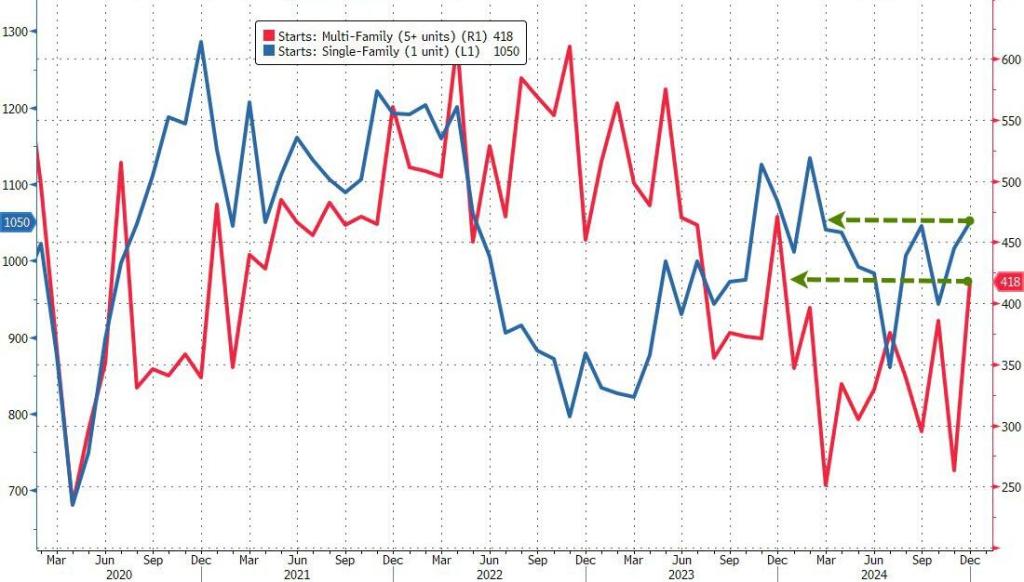
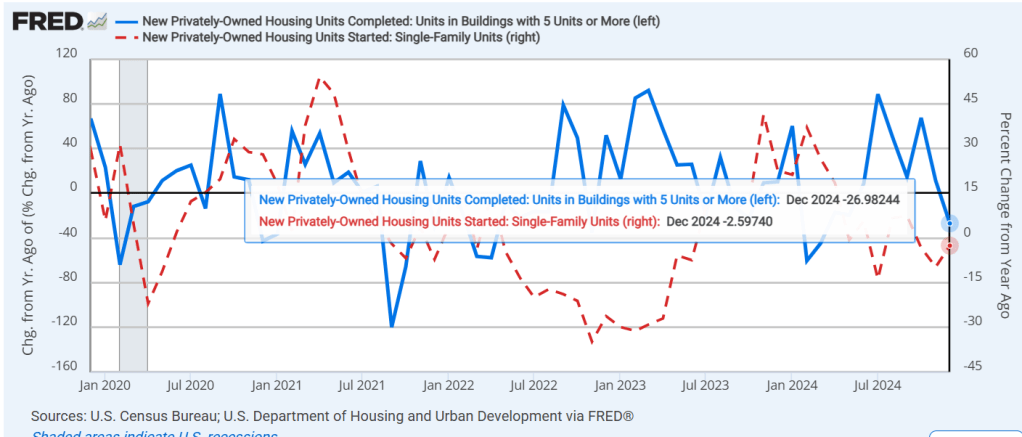
Today’s housing starts report revealed the biggest MoM jump in multi-family starts since 2016, and the highest SAAR for ‘renter nation’ since Dec 2023.
On a year-over-year basis, 5+ unit (multifamily) starts are are up while 1-unit housing starts are negative.
Unfortunately, the percentage change on a year-over-year basis were negative. -2.6% for 1-unit starts and -27% for 5+ unit (multifamily) starts.
Under Biden, home prices rose a whopping 38.3% while population (if you believe the US Census Bureau) rose 3.3%.
This is the worst start to a fiscal year EVER: – Spending is up 10.9% – Receipts are down 2.2% – FYTD deficit up 39.4% at $711 billion They’re handing Trump a ticking time bomb!
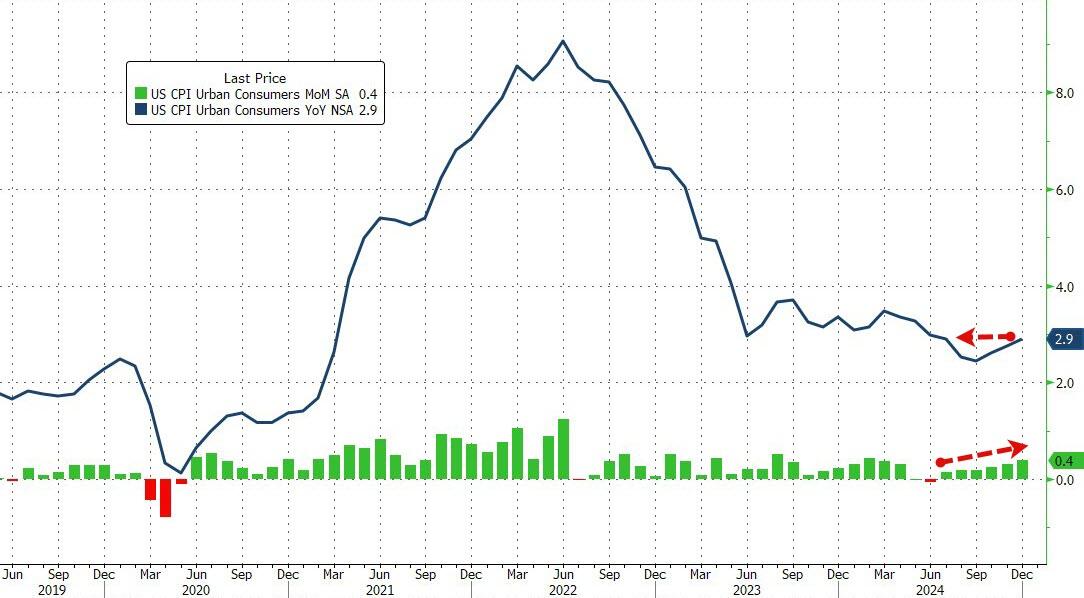
Speaking of Biden handing a ticking time bomb (according to Zero Hedge), after rising for 5 straight months, analysts expected headline consumer prices to continue accelerating in December (+0.4% MoM exp) and it did exactly that – the highest MoM print since March, leading the YoY CPI to rise 2.9% (the highest since July)…
Source: Bloomberg
CPI details:
Food
The index for food increased 0.3% in December, after rising 0.4% in November. The food at home index also rose 0.3% over the month. Four of the six major grocery store food group indexes increased in December. The index for cereals and bakery products rose 1.2% over the month, after falling 1.1% in November. The meats, poultry, fish, and eggs index increased 0.6 percent in December, as the eggs index rose 3.2 percent. The index for other food at home rose 0.3 percent over the month and the index for dairy and related products increased 0.2 percent.
Energy
The energy index increased 2.6% in December, after rising 0.2% in November. The gasoline index increased 4.4% over the month. (Before seasonal adjustment, gasoline prices decreased 1.1 percent in December.) The natural gas index rose 2.4 percent over the month and the index for electricity rose 0.3 percent in December. The energy index decreased 0.5 percent over the past 12 months. The gasoline index fell 3.4% over this 12-month span and the fuel oil index fell 13.1 percent over that period. In contrast, the index for electricity increased 2.8 percent over the last 12 months and the index for natural gas rose 4.9 percent.
All items less food and energy
The index for all items less food and energy rose 0.2 percent in December, after rising 0.3 percent in each of the 4 preceding months.
The shelter index increased 0.3 percent in December, as it did in November.
The index for owners’ equivalent rent also rose 0.3 percent over the month, as did the index for rent.
The lodging away from home index fell 1.0 percent in December, after rising 3.2 percent in November.
The medical care index increased 0.1 percent over the month, after rising 0.3 percent in October and November.
The index for physicians’ services increased 0.1 percent in December and the index for hospital services rose 0.2 percent over the month.
The airline fares index rose 3.9 percent in December, after rising 0.4 percent in the previous month.
The index for used cars and trucks rose 1.2 percent over the month and the index for new vehicles increased 0.5 percent.
Other indexes that increased in December include motor vehicle insurance, recreation, apparel, and education.
In contrast, the index for personal care fell 0.2 percent in December after rising 0.4 percent in November. The indexes for communication and alcoholic beverages also declined over the month. The household furnishings and operations index was unchanged in December
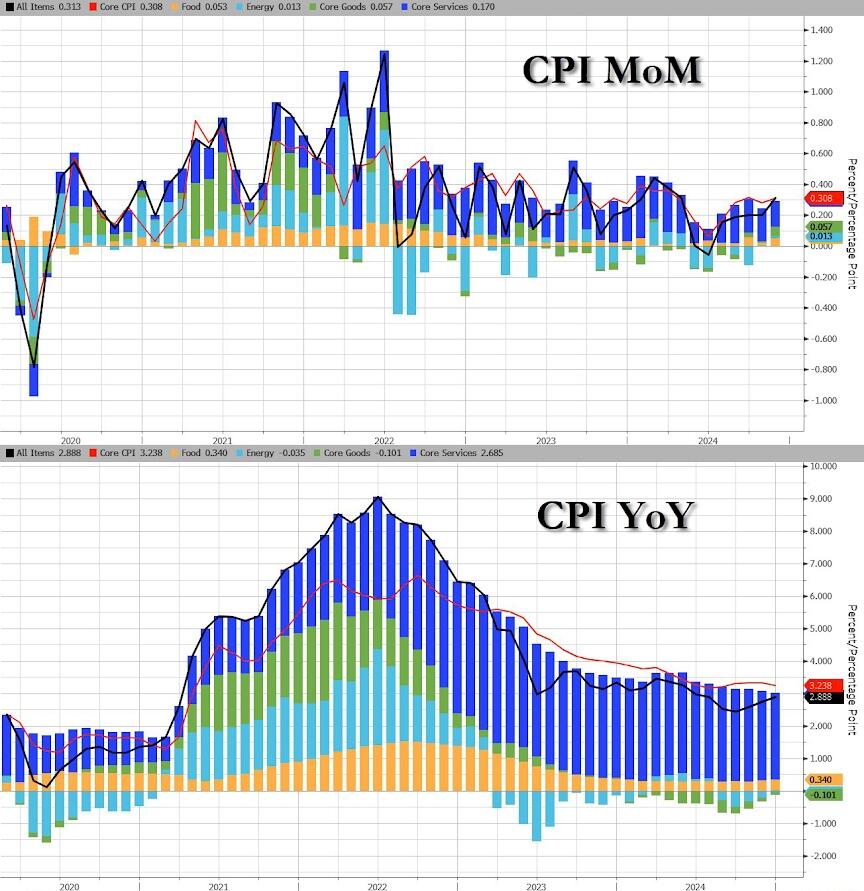
The resurgence of energy costs drove the hot headline CPI along with Core Services…
Source: Bloomberg
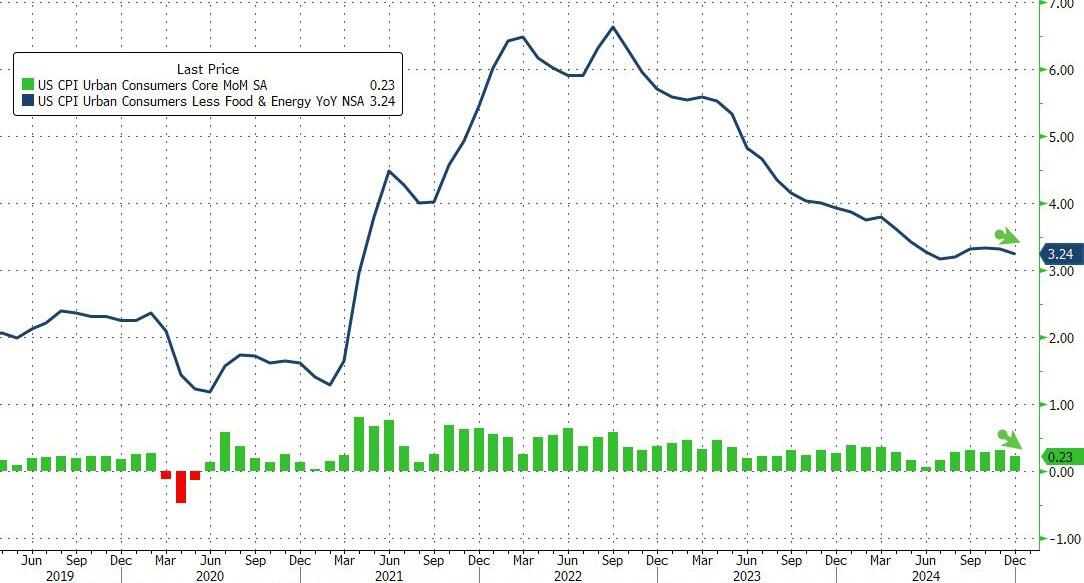
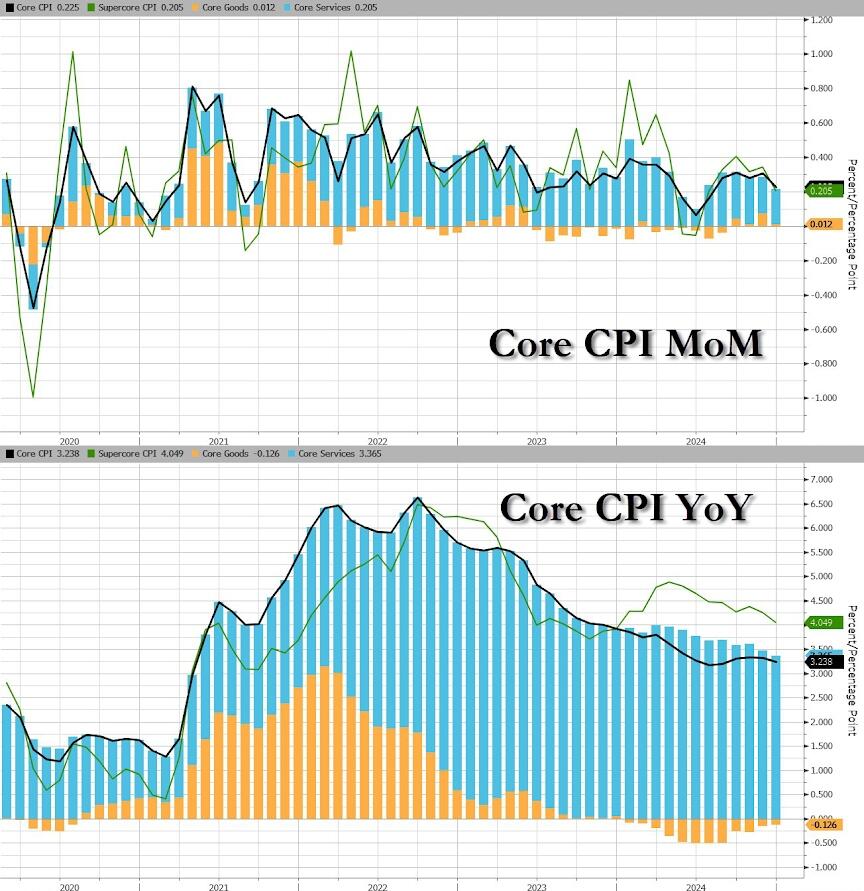
Core CPI (ex Food and Energy) dipped to +0.2% MoM (below the 0.3% exp) and the YoY pace of inflation slowed to 3.24% YoY. Core CPI rose EVERY month under Biden…
Source: Bloomberg
Core Goods price inflation slowed MoM (but deflation is gone on a YoY basis)…
Source: Bloomberg
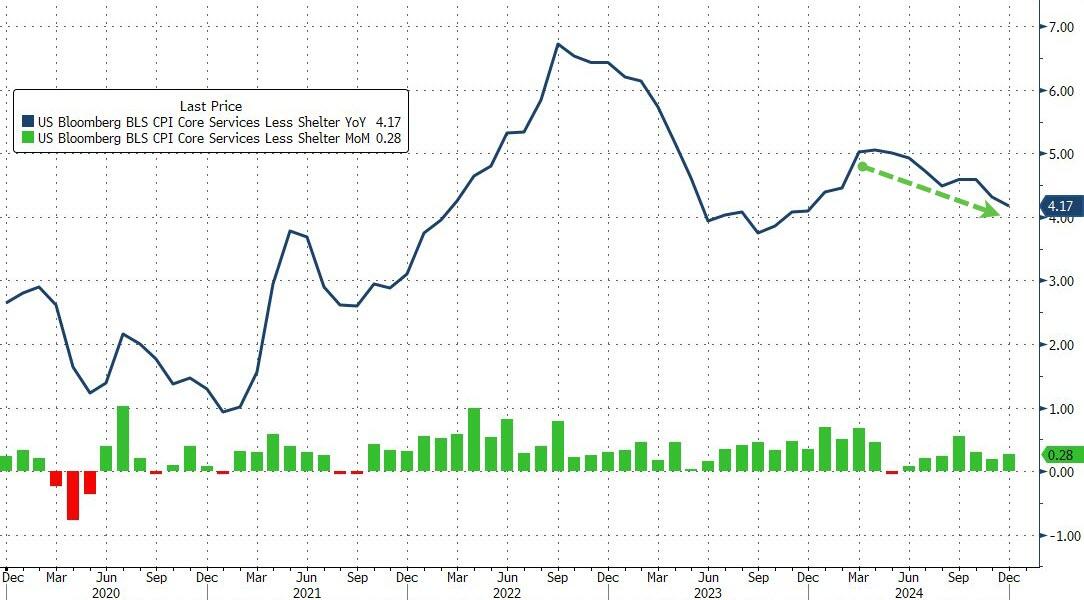
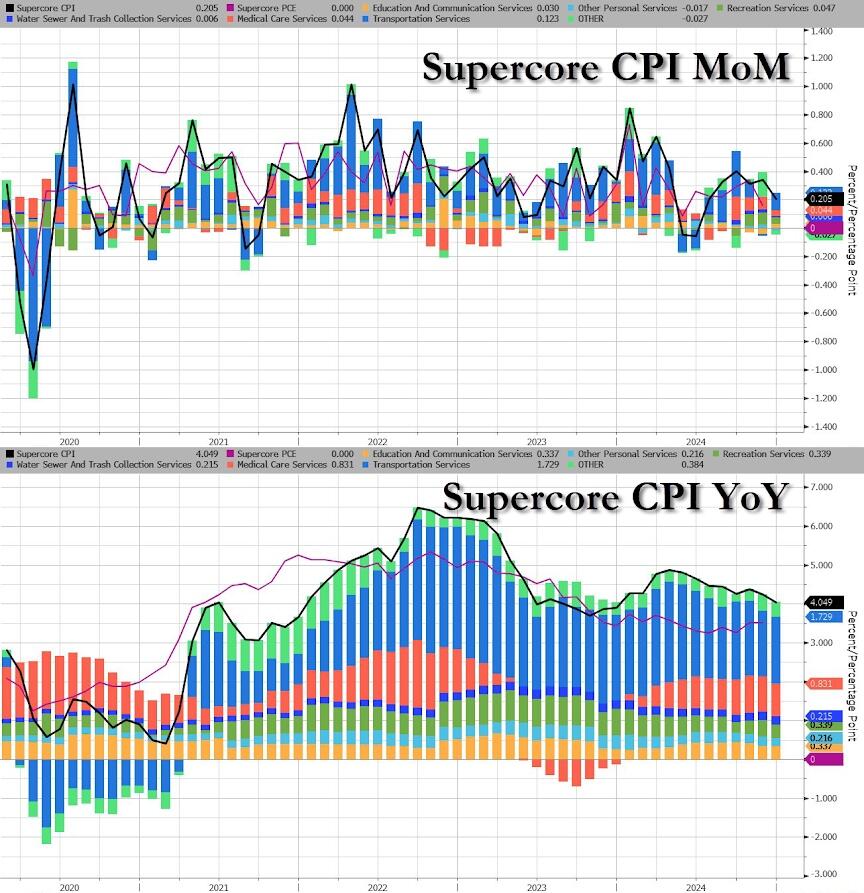
The Fed’s favorite indicator of the CPI bunch – SuperCore or Services CPI ex-Shelter – rose 0.28% MoM (slowing the pace of annual inflation to +4.17%)…
Source: Bloomberg
Transportation Services were not MoM…
Source: Bloomberg
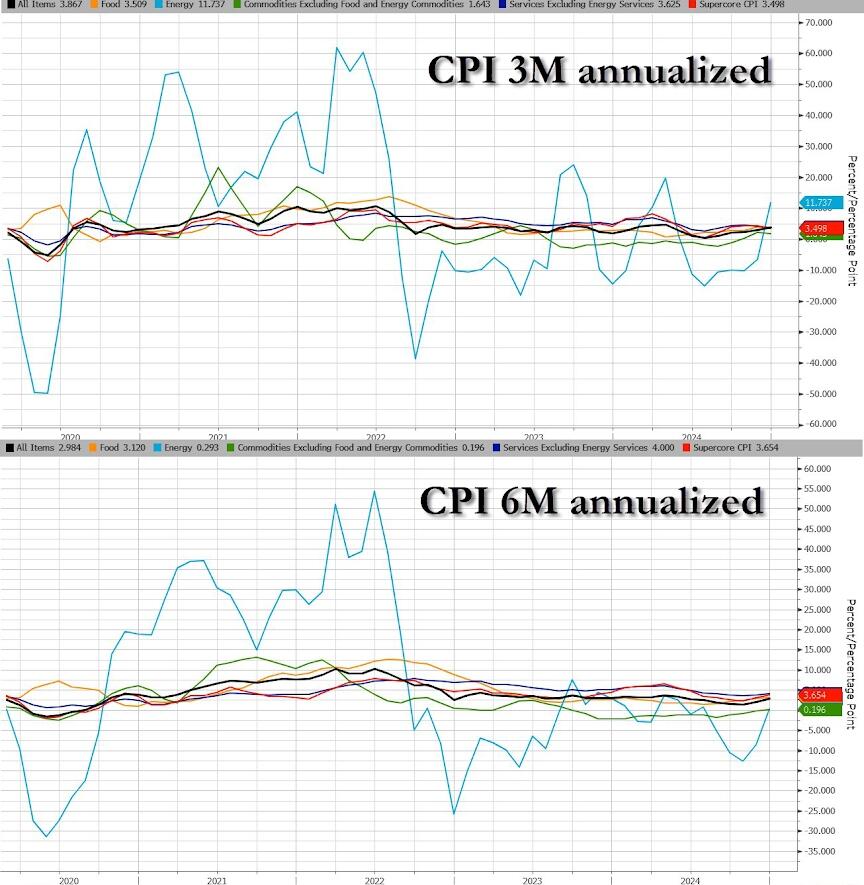
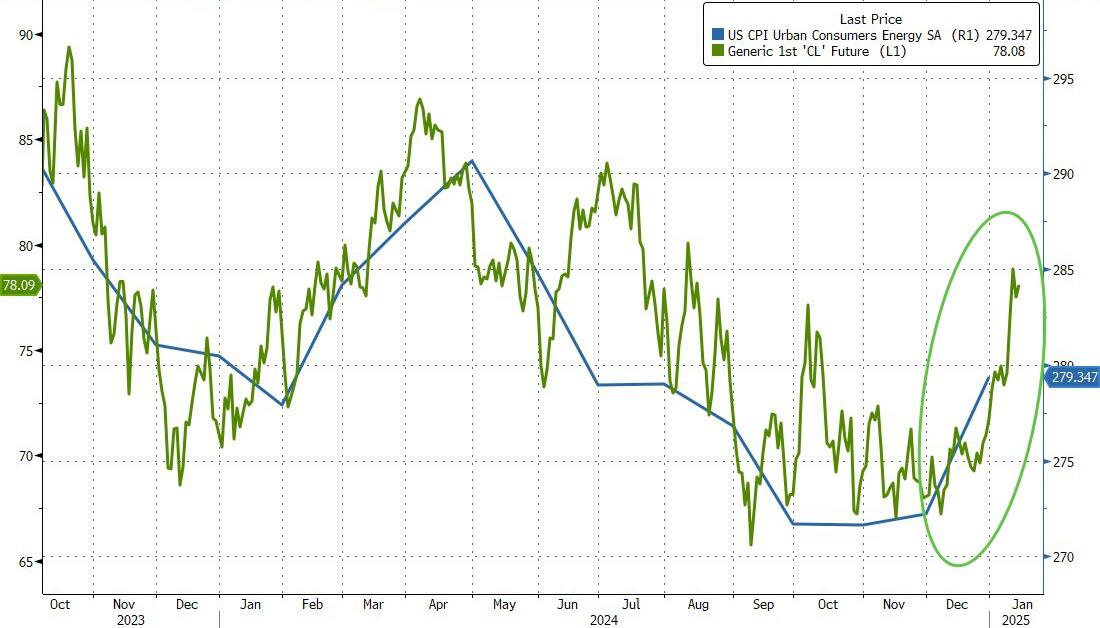
Overall, it’s energy costs that are re-emerging as a drive of inflation… thanks Joe!
Source: Bloomberg
…and Energy prices aren’t going down anytime soon in the CPI world… thanks Joe!
Source: Bloomberg
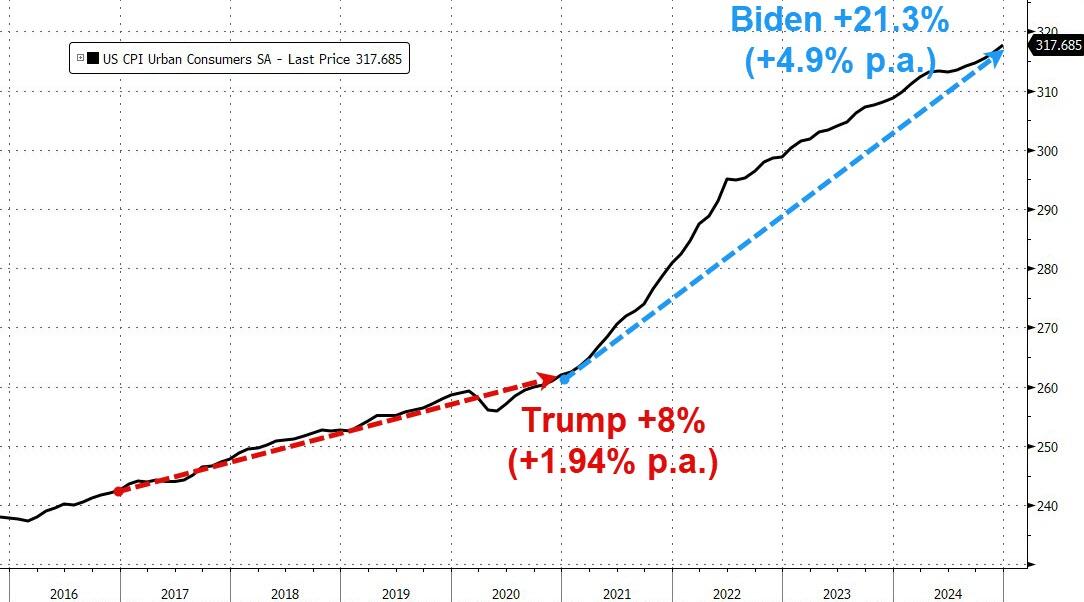
While Producer Prices under Biden rose at triple the rate they did under Trump, Consumer Prices soared 21.25% under Biden (+4.9% p.a.) vs 8%, 1.94% p.a. under Trump…
Source: Bloomberg
Finally, equity traders were braced for a volatile day ahead of the print, with options implying moves of 1.1% in either direction for the S&P 500, the most for a CPI day since March 2023.
The latest jobs report was like the Cornell Hurd song, “It’s just the whiskey talking.” Except that this time it’s just the Biden Administration talking … and their jobs reports have been corrected/revised repeatedly.
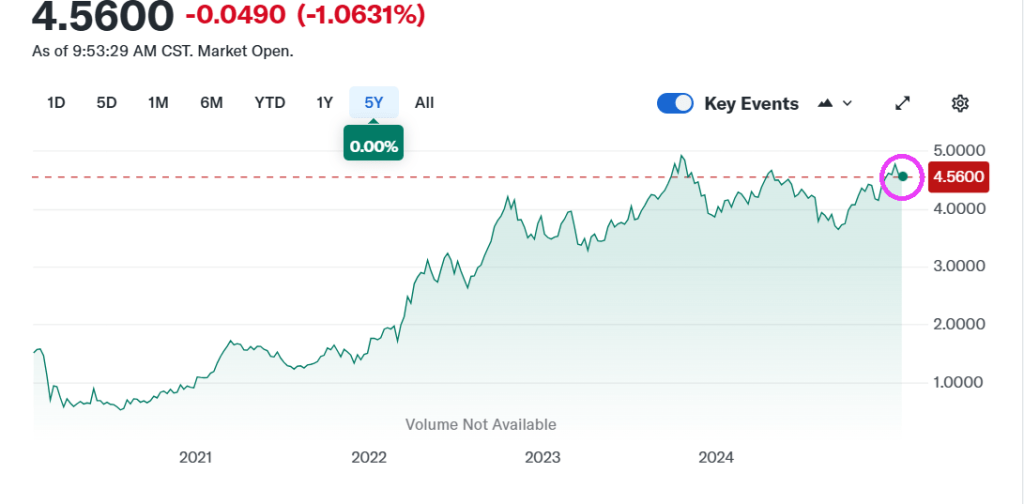
The latest jobs report saw Nonfarm Payrolls rise by 256k and mortgage rates (conforming) rose above 7%. But what happens when the recent jobs report is revised downwards?
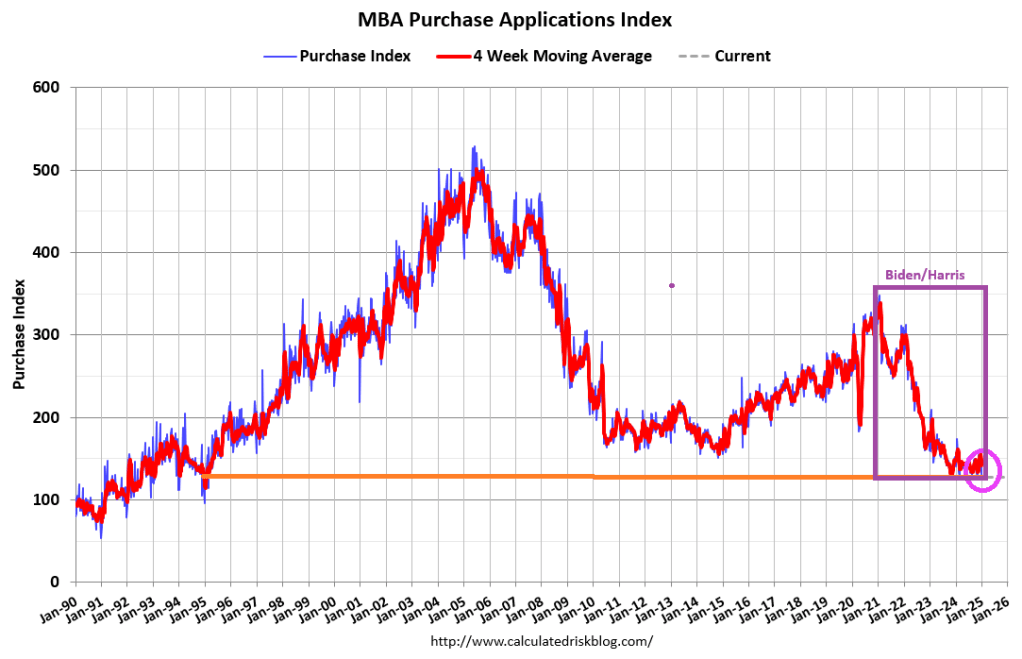
Mortgage applications decreased 3.7 percent from one week earlier, according to data from the Mortgage Bankers Association’s (MBA) Weekly Mortgage Applications Survey for the week ending January 3, 2025. This week’s results include an adjustment for the New Year’s holiday.
The Market Composite Index, a measure of mortgage loan application volume, decreased 3.7 percent on a seasonally adjusted basis from one week earlier. On an unadjusted basis, the Index increased 47 percent compared with the previous week. The seasonally adjusted Purchase Index decreased 7 percent from one week earlier. The unadjusted Purchase Index increased 43 percent compared with the previous week and was 15 percent lower than the same week one year ago.
Purchase application activity is up about 2% from the lows in late October 2023 and is now 15% below the lowest levels during the housing bust.
The Refinance Index increased 2 percent from the previous week and was 6 percent lower than the same week one year ago.
Was Freddie King correct? Is the US economy going down??
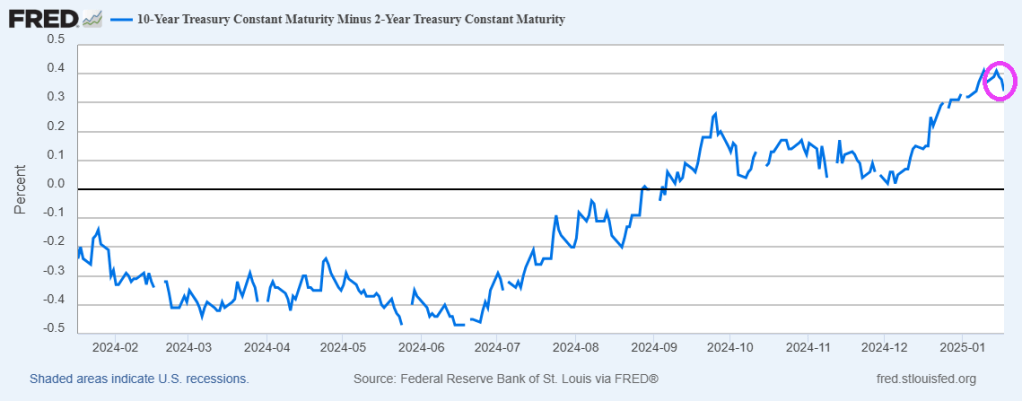
The US Treasury yield curve (10Y-2Y) has inverted to the positive side after a prolonged NEGATIVE inversion (from July 6, 2022 to Sept 5, 2024) marking the longest period of negative inversion since August 18, 1978 – May 1, 1980. Each negative inversion was followed by a recession.
The UST 10Y-3M yield curve tells a similar tale. The 10Y-3M curve inverts prior to recessions but goes positive just prior to recessions.
Yes, if the yield curve is a good predictor of recession, the US economy is going down.
Freddie King is playing a Gibson ES-355TDC guitar.
Existing-home sales have finally started to improve on a seasonally adjusted basis after a three-year decline.
Cause? Raging home prices combined with higher than normal mortgage rates. Home prices are up 35.4% under Biden while conforming 30Y mortgage rates are up 148%.


You must be logged in to post a comment.