The native (born) workers are getting restless!
Under Biden/Harris, native born workers lost -2.7 million jobs in 2014 while foreign-born workers gained 13.4 million jobs. THAT is the great replacement of American workers.

We are in Jumanji!

Confounded Interest – Anthony B. Sanders
Financial Markets And Real Estate
The native (born) workers are getting restless!
Under Biden/Harris, native born workers lost -2.7 million jobs in 2014 while foreign-born workers gained 13.4 million jobs. THAT is the great replacement of American workers.
We are in Jumanji!
October jobs report was a real shocker!!
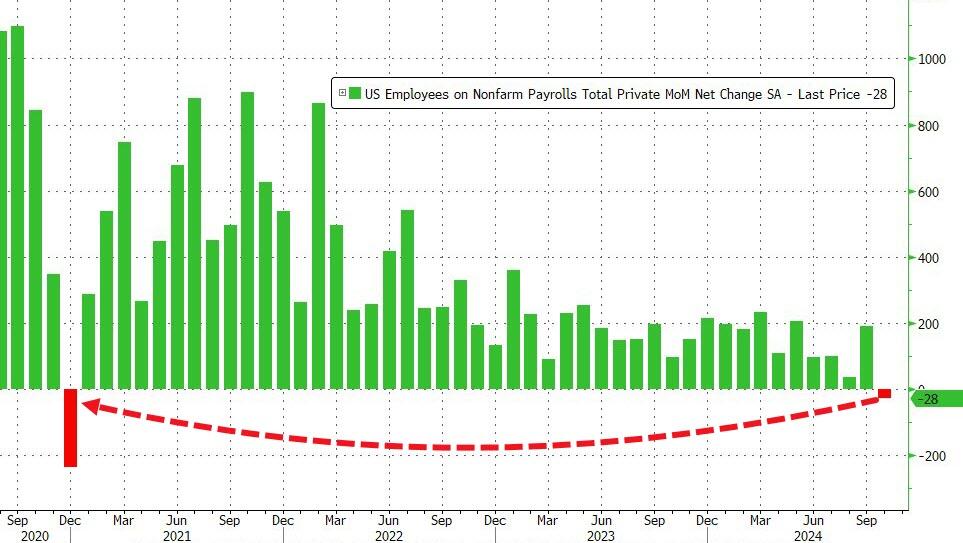
Moments ago the BLS reported the highly anticipated number and… it was close: the monthly print was only 12K, a huge drop from the pre-revision 254K in October (revised naturally lower to 223K), and just 13K away from a negative print. Only 12k total jobs added! And -28k private jobs added!
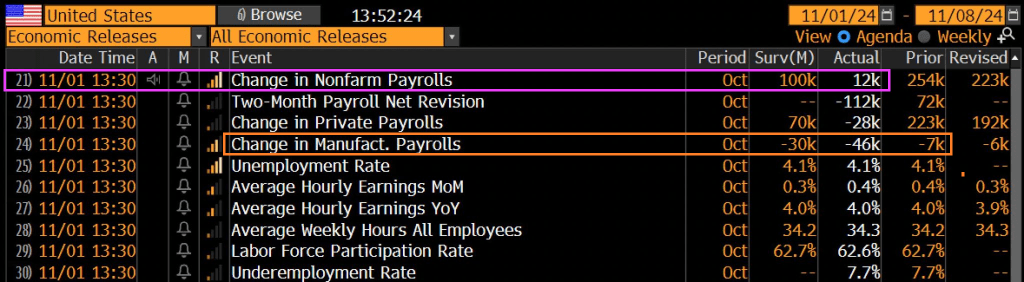
Total jobs including government rose by a measly 12k.
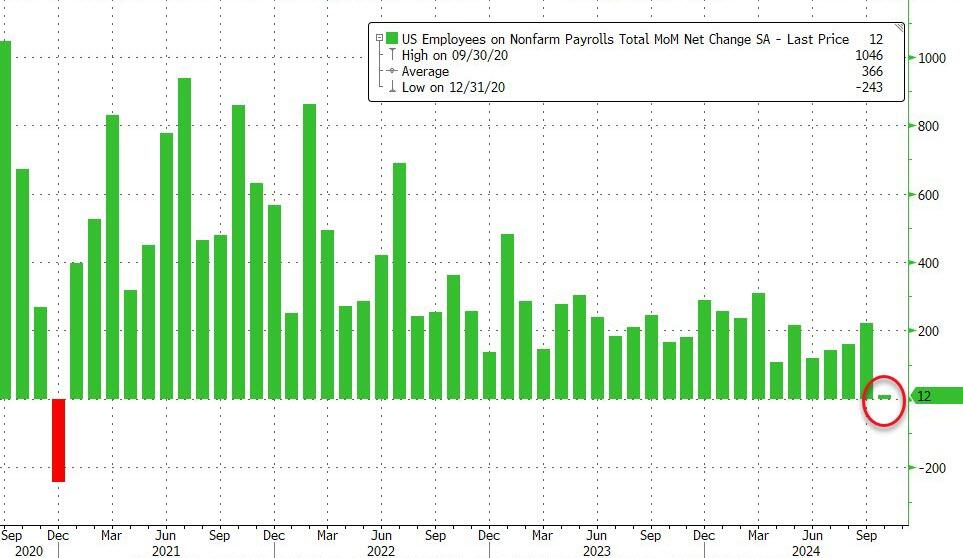
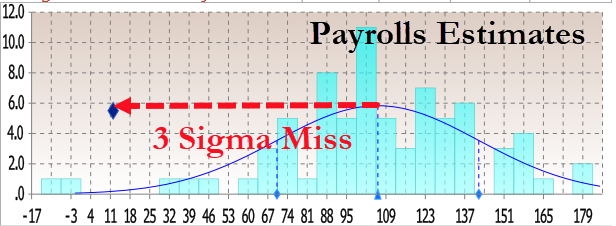
The print was so low it was only above the two lowest estimates (those of Bloomberg Econ for -10K and ABN Amr0 for a 0 print). That means it was a 3 sigma miss to estimates.
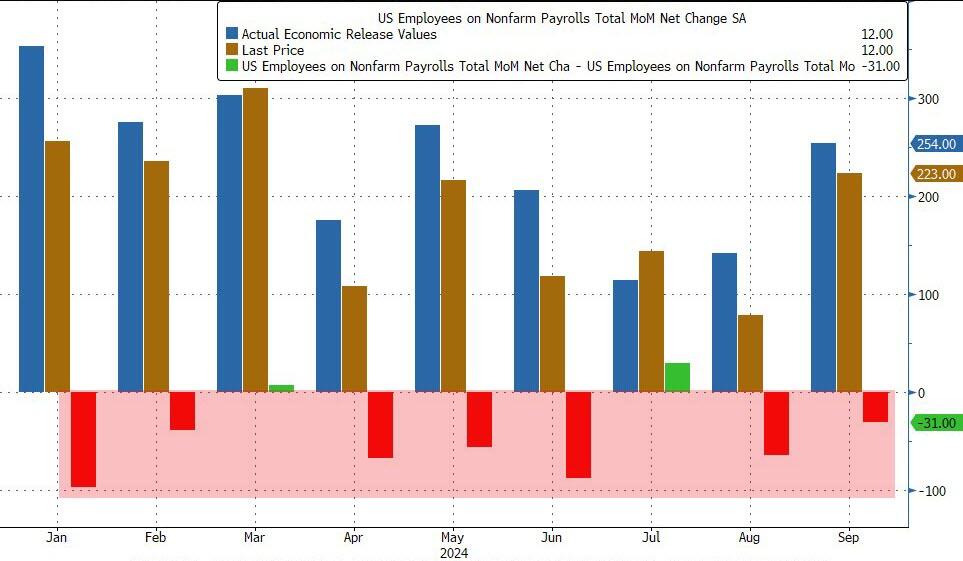
And of course, as has been the case for the entire Biden admin, previous months were revised sharply lower once again: August was revised down by 81,000, from +159,000 to +78,000, and September was revised down by 31,000, from +254,000 to +223,000. With these revisions, employment in August and September combined is 112,000 lower than previously reported. This means that even after the monster September revision when 818K jobs were removed, 7 of the past 9 months were again revised lower!
This means that once the November jobs are released, we can be virtually certain that October will be revised to negative.
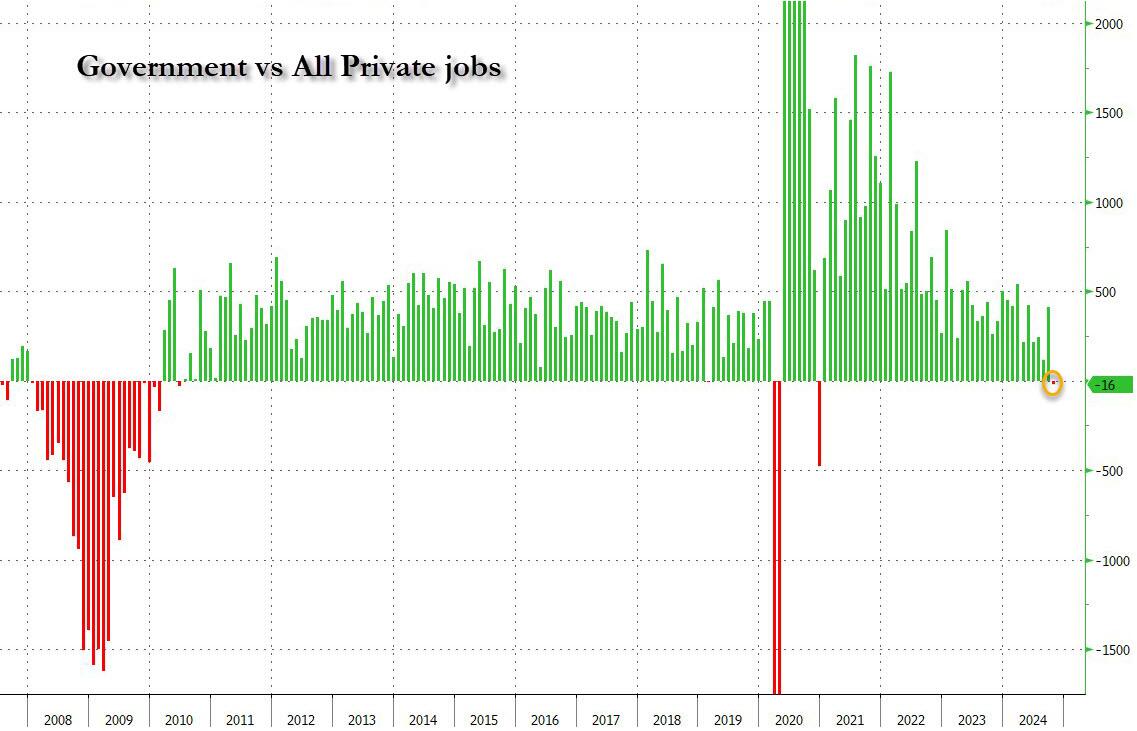
But wait, there’s more because while the total payroll number was just barely positive, if one excludes the 40K government jobs, private payrolls was in fact negative to the tune of -28K, down from 223K pre-revision last month, and the first negative print since December 2020. In other words, we were right… when it comes to actual, non-parasite “government” jobs.
To be sure, a big part of the drop was due to the one-time event discussed, including the Boeing strike and Hurricanes Helene and Milton. This is what the BLS said on the topic: “In October, the household survey was conducted largely according to standard procedures, and response rates were within normal ranges” however, “the initial establishment survey collection rate for October was well below average. However, collection rates were similar in storm-affected areas and unaffected areas. A larger influence on the October collection rate for establishment data was the timing and length of the collection period. This period, which can range from 10 to 16 days, lasted 10 days in October and was completed several days before the end of the month.”
More importantly, the BLS said that “it is likely that payroll employment estimates in some industries were affected by the hurricanes; however, it is not possible to quantify the net effect on the over-the-month change in national employment, hours, or earnings estimates because the establishment survey is not designed to isolate effects from extreme weather events. There was no discernible effect on the national unemployment rate from the household survey.”
Ironically, while the BLS was unable to “quantify the net effect” from the hurricanes, it was able to calculate that the number of people not at work due to weather surged to the third highest in recent history, up 512K!
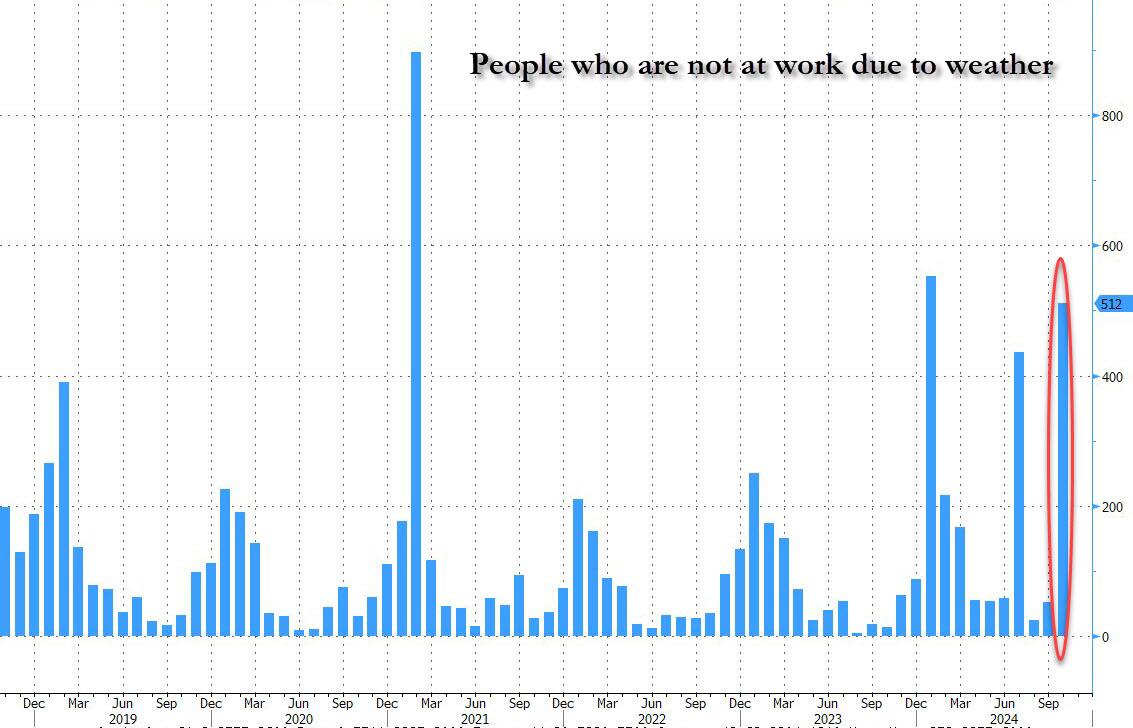
In other words, the BLS now has an excuse to blame the plunge on, it just doesn’t know how to quantify it. Translation: if Trump is president next month, expect the downtrend to continue with little to no mention of hurricane as the BLS prepares to admit the true state of the labor market; if however Kamala wins, the November jobs will magically rebound (even as downward revisions accelerate) and all shall be back to fake normal.
Oh, and of course, today’s catastrophic jobs print gives the Fed a full carte blanche to again cut 25bps next week, even if the plunge was all hurricanes…
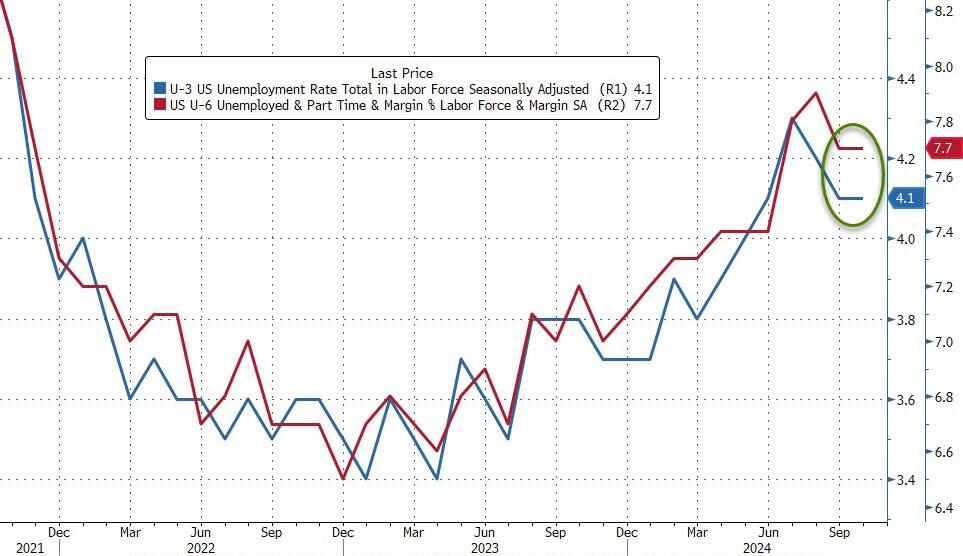
The rest of the jobs report was not that exciting: the unemployment rate printed at 4.1%, unchanged from last month and in line with expectations. The number of unemployed people was little changed at 7.0 million.
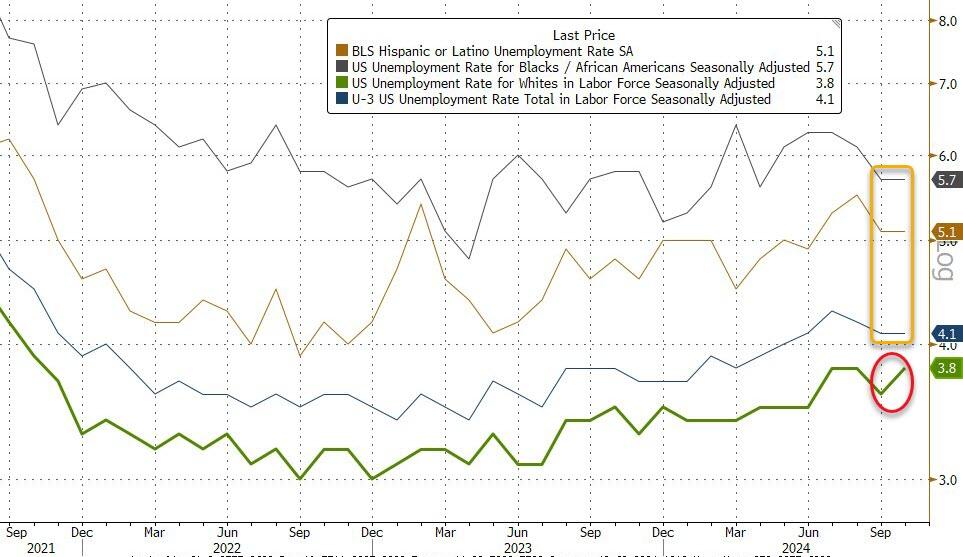
Among the major worker groups, the unemployment rates for adult men (3.9 percent), adult women (3.6 percent), teenagers (13.8 percent), Whites (3.8 percent), Blacks (5.7 percent), Asians (3.9 percent), and Hispanics (5.1 percent) showed little or no change over the month.
It’s worth noting that the unemployment rate actually rose almost 0.1% despite being reported as flat because in September it was 4.05% and in October it was 4.145%, and rose due to a surge in layoffs (+166K) as well as re-entrants (+108K). Additionally, as Southbay research notes, the average duration of unemployment rose from 22.6 weeks to 22.9 weeks
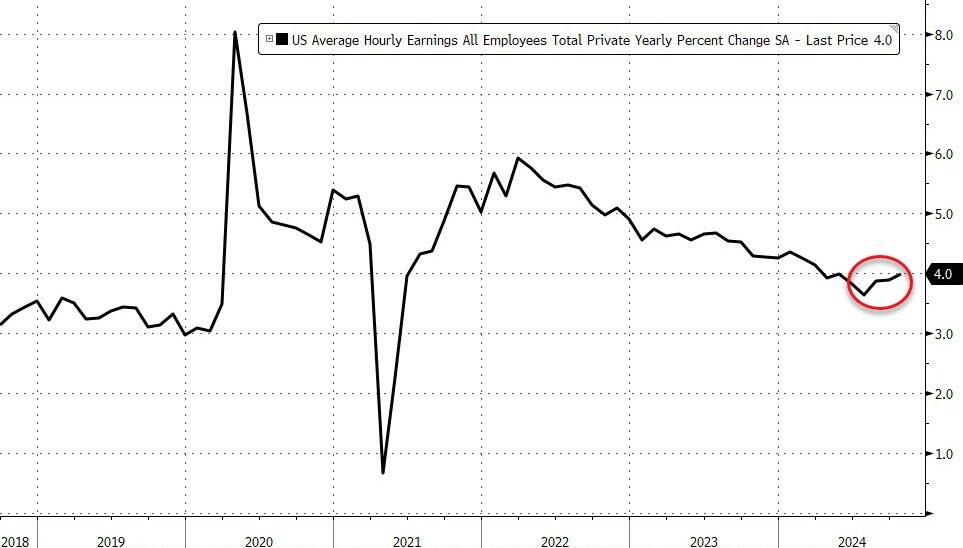
Wage growth came in slightly higher than expected, with average hourly earnings rising 0.4% in October, higher than the 0.3% expected, and up from the downward revised 0.3% in September (was 0.4%). On an annual basis, earnings rose 4.0%, in line with expectations, and above the downward revised 3.9% (was 4.0%).
Some more stats from the latest monthly report:
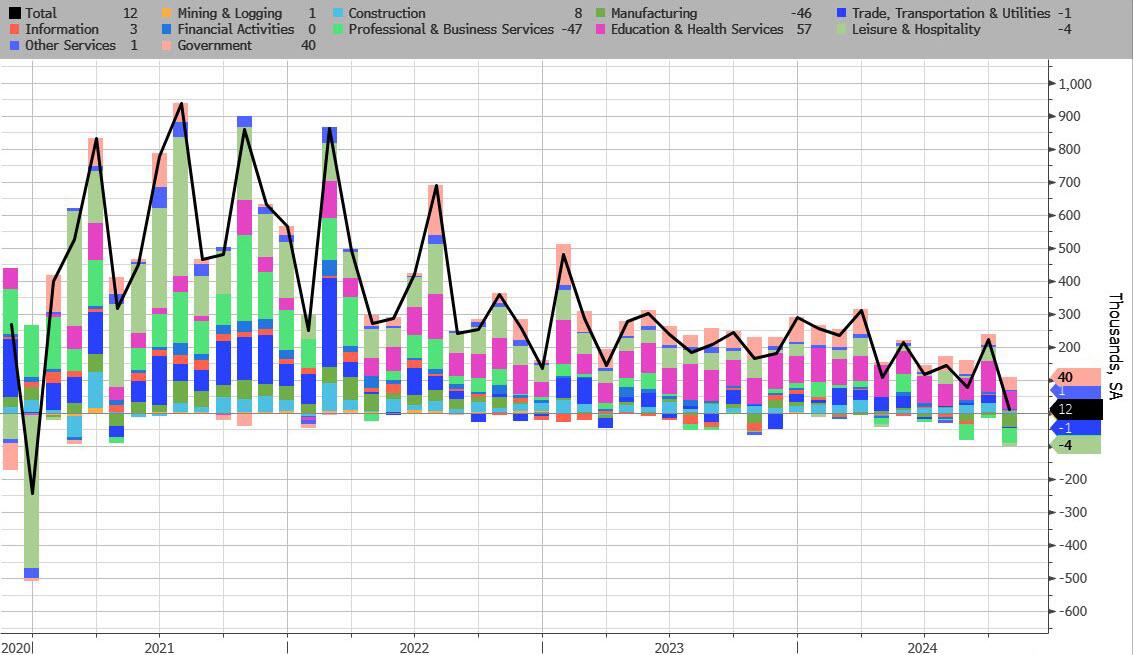
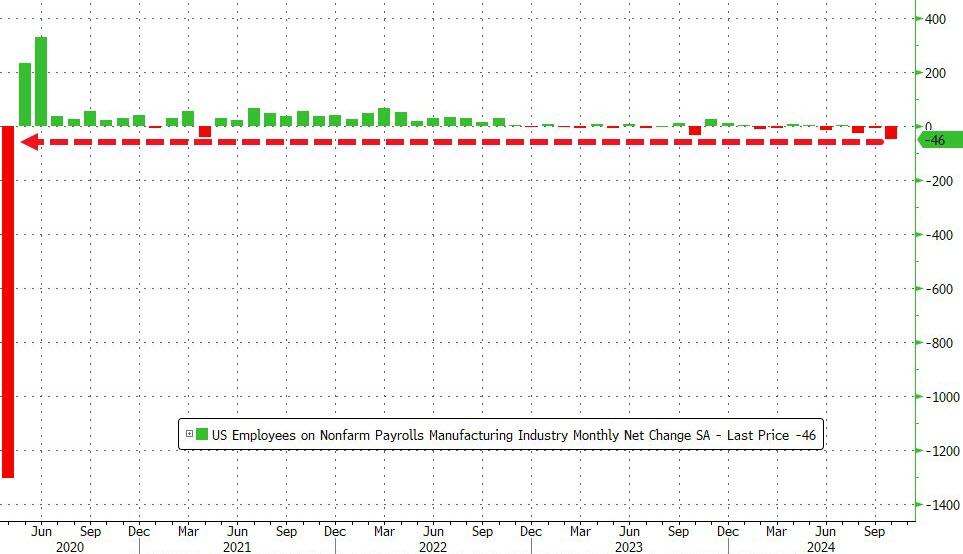
Turning to the establishment survey, we find the following breakdown in jobs:
And visually:


Biden/Harris started the fire! And the house market is still burning.
S&P/Case-Shiller released the monthly Home Price Indices for August (“August” is a 3-month average of June, July and August closing prices). August closing prices include some contracts signed in April, so there is a significant lag to this data. Here is a graph of the month-over-month (MoM) change in the Case-Shiller National Index Seasonally Adjusted (SA).
xxxx

Fire! Is still burning. The Fed tried to extinguish it and failed.
Not a great sign for the mighty US economy.
This morning, the flash PMI for manufacturing printed at 47.8.

Three straight months of print below 50 means … contraction.

Do I say contraction?

The US economy is crumbing down under Biden/Harris. No, the economy doesn’t hurt so good.
The Citi Economic Surprise Index just rose to its highest level since April.

The 10Y Treasury yield just rose to its highest level since August.


SF Woman. That is my name for Kamala Harris, the ultimate political changeling, taking full credit for the economy, then trying to distance herself from Biden. As the US economy continues to contract.
Weakness in factory new orders continued to be a major drag on the US LEI in September as the global manufacturing slump persists. Additionally, the yield curve remained inverted, building permits declined, and consumers’ outlook for future business conditions was tepid. Gains among other LEI components were not significant enough to offset weakness among the four gauges mentioned above. Overall, the LEI continued to signal uncertainty for economic activity ahead.

*Changeling, in European folklore, a deformed or imbecilic offspring of fairies or elves substituted by them surreptitiously for a human infant. According to legend, the abducted human children are given to the devil or used to strengthen fairy stock.
Tennessee Ernie Ford sang it best. $36 tons of debt. Another day older and deeper in debt. Notice virually no political candidate will acknowledge or discuss.

The federal government spent $1.8 trillion more than it collected in tax revenue in fiscal year 2024, according to figures released Friday by U.S. Treasury Department.
Congress has run a deficit every year since 2001. In the past 50 years, the federal government has ended with a fiscal year-end budget surplus four times, most recently in 2001.
The deficit for fiscal 2024 was $1.8 trillion, or $138 billion higher than the prior year’s deficit. As a percentage of GDP, the deficit was 6.4%, an increase from 6.2% in fiscal 2023. The 2024 deficit is $196 billion lower than in 2023, excluding the effect of the Supreme Court’s 2023 decision in Biden v. Nebraska regarding student loan programs, according to year-end data from the September 2024 Monthly Treasury Statement of Receipts and Outlays of the United States Government.
And then we have the REAL disaster in the form of unfunded liabilities of $220 TRIILLION (or $651,000 per citizen). For a family of 5 citizens (like my household), that amounts to $3.26 MILLION per household of 5.

Imagine Kamala’s filibustering a response to a question about the national debt and unfunded liabilities. Other than “Donald Trump.”
Perhaps Tennesse Ernie Ford could have recorded “220 Trillion Tons of Unfunded Liabilities” instead.

Housing starts dropped -0.7% YoY in September.
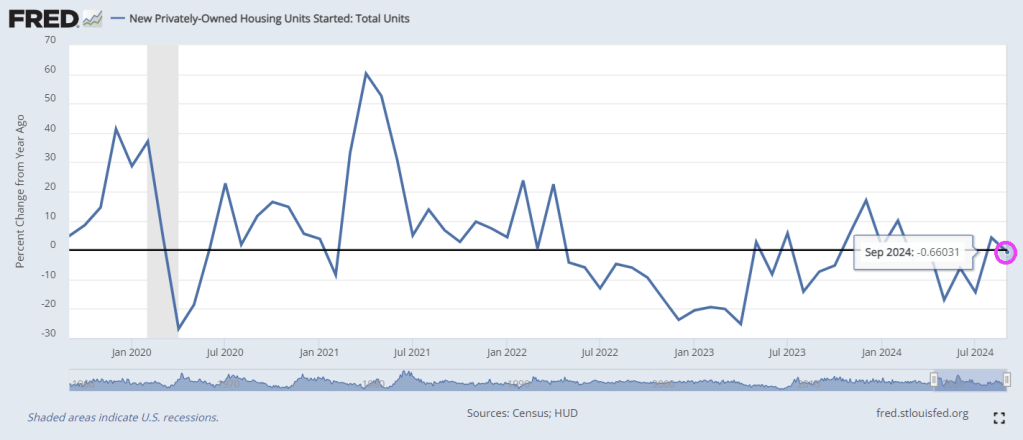
After surprising top the upside in August, Housing Starts and Building Permits disappointed in September, declining more than expected (-0.5% MoM and -2.9% MoM respectively)…
Under the hood, multi-family permits plunged 10.8% MoM (and multi-family starts dropped for the second straight month). Single-family starts rose 2.7% MoM and permiots inchjed higher by 0.3% MoM…
Rate-cut expectations appear to have taken the excitement out of the building market…
Housing Completions also dropped (but the BLS thinks construction jobs continue to rise non-stop)…
So, The Fed cuts short-term rates… mortgage-rates rise… and builders slow their building plans… that’s not how it’s supposed to work!
I would like to see Kamala Harris explain why mortgage purchase applications are down -60% under Biden/Harris Presidency. Other than a word salad answer. Or Cottage Cheese.
Mortgage applications decreased 17.0 percent from one week earlier, according to data from the Mortgage Bankers Association’s (MBA) Weekly Applications Survey for the week ending October 11, 2024.
The Market Composite Index, a measure of mortgage loan application volume, decreased 17.0 percent on a seasonally adjusted basis from one week earlier. On an unadjusted basis, the Index decreased 17 percent compared with the previous week. The seasonally adjusted Purchase Index decreased 7 percent from one week earlier. The unadjusted Purchase Index decreased 7 percent compared with the previous week and was 7 percent higher than the same week one year ago.

The Refinance Index decreased 26 percent from the previous week and was 111 percent higher than the same week one year ago.

Housing prices are up 34.2% under Biden/Harris while mortgage rates are up 138.6%.

Perhaps Harris/Walz should adopt the Imperial March from Star Wars as their theme song. Between Biden/Harris uncontrolled immigration disaster helping to destroy New York City, Harris’ statement that she won’t do anything differntly from Biden/Harris is alarming.
The NY Empire survey crashed from +11.5 to -11.9 – the lowest since May. That is the biggest MoM drop since January…

A measure of current new orders plunged nearly 20 points to -10.2 after climbing a month earlier to the highest since April 2023.
The index of shipments decreased almost 21 points to minus 2.7.
The employment index, however, rebounded to 4.1 – the first expansion in a year – while a measure of hours worked also climbed.
Meanwhile, the New York Fed’s gauge of prices paid for materials increased to a six-month high of 29, while an index of prices received by state manufacturers also accelerated.

And with this awful news, the US Treasury yield curve remains downward/upward sloping. I call this the schizophenic yield curve.


You must be logged in to post a comment.