Mortgage applications decreased 3.7 percent from one week earlier, according to data from the Mortgage Bankers Association’s (MBA) Weekly Mortgage Applications Survey for the week ending January 3, 2025. This week’s results include an adjustment for the New Year’s holiday.
The Market Composite Index, a measure of mortgage loan application volume, decreased 3.7 percent on a seasonally adjusted basis from one week earlier. On an unadjusted basis, the Index increased 47 percent compared with the previous week. The seasonally adjusted Purchase Index decreased 7 percent from one week earlier. The unadjusted Purchase Index increased 43 percent compared with the previous week and was 15 percent lower than the same week one year ago.
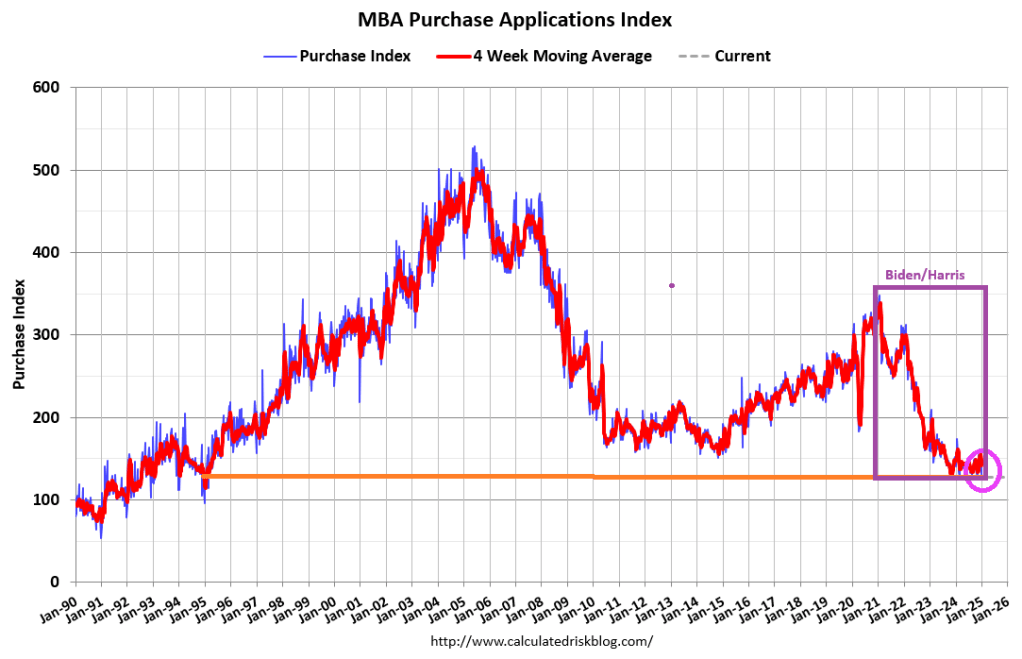
Purchase application activity is up about 2% from the lows in late October 2023 and is now 15% below the lowest levels during the housing bust.
The Refinance Index increased 2 percent from the previous week and was 6 percent lower than the same week one year ago.
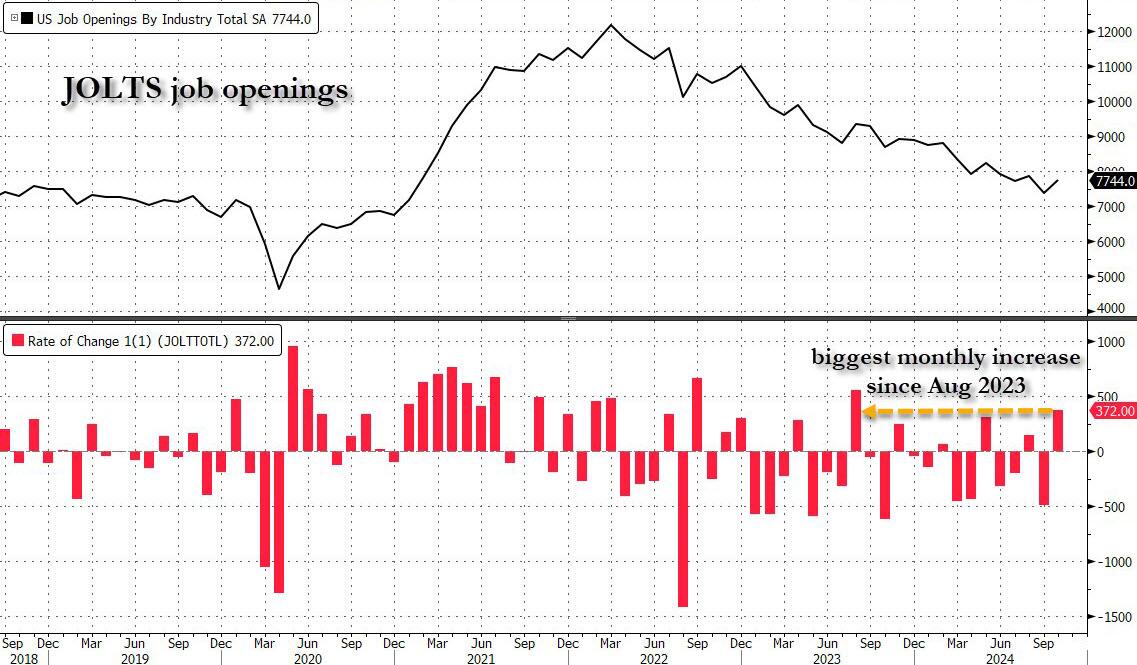
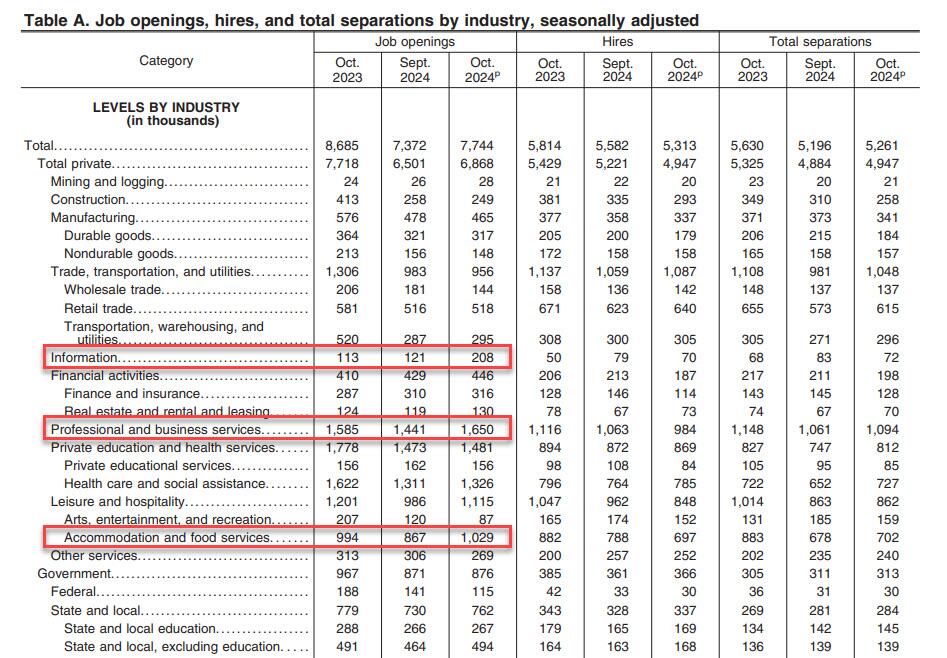
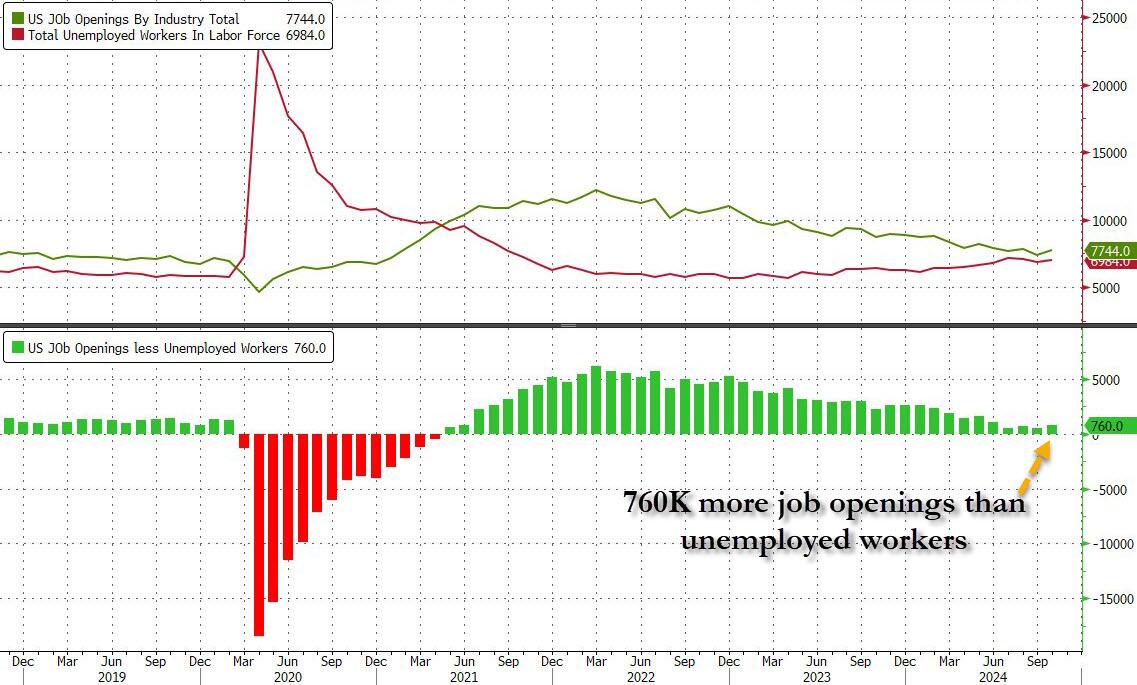
After last month’s catastrophic JOLTS report, which was a disaster across the board, and which was meant to give the Fed a green light to cut rates more after Biden won the election (which he didn’t, but the Fed still had to cut even if Trump is now in control), some speculated that Biden’s Department of Labor will do everything in its power to sabotage further rate cuts by the Fed, most notably the upcoming December decision in two weeks time, by pushing out much stronger than expected economic data. That’s precisely what happened moments ago when the DOL reported that in October, the number of job openings in the US soared by a whopping 372K, the biggest monthly increase since August 2023, to 7.744 million from 7.372 million.
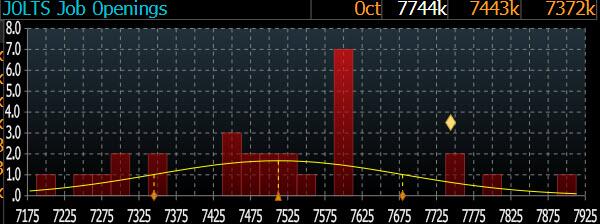
The JOLTS print smashed the median estimate of 7.519 million by 225K…
… with just 4 analysts (out of 28) predicting a higher job openings number.
According to the DOL, the job openings rate, at 4.6 percent, changed little over the month. The number of job openings increased in professional and business services (+209,000), accommodation and food services (+162,000), and information (+87,000) but decreased in federal government (-26,000).
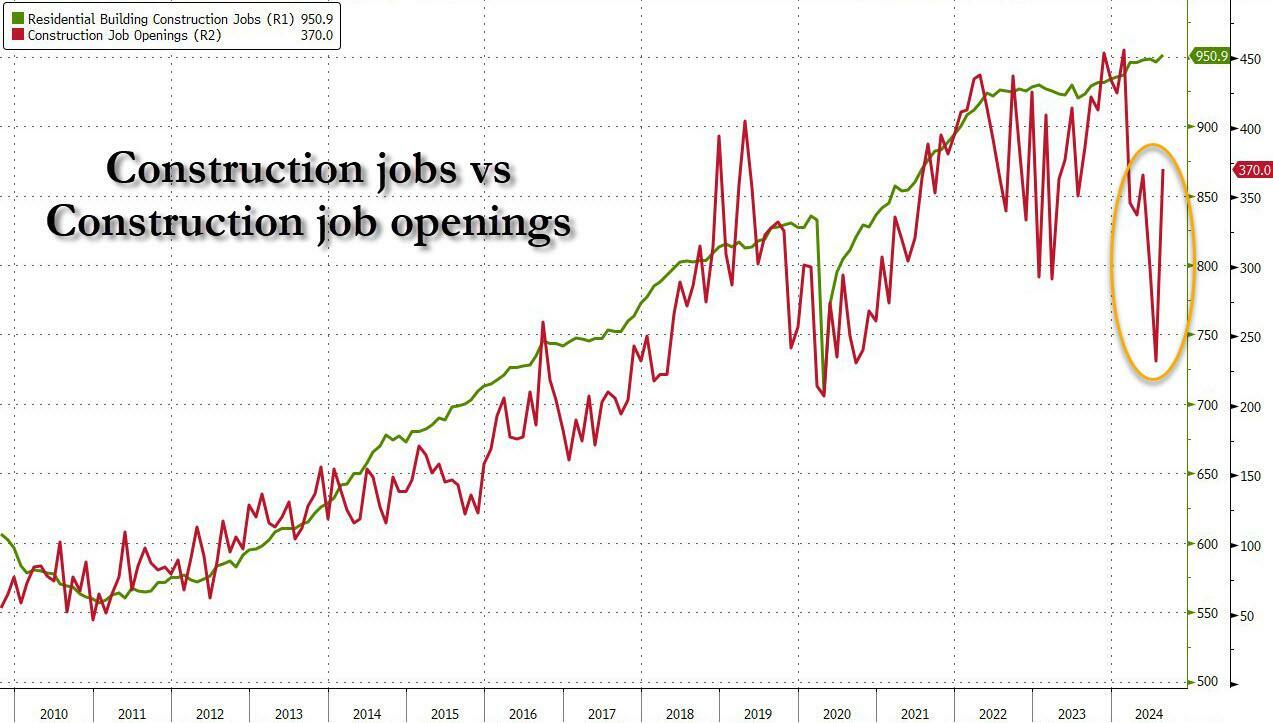
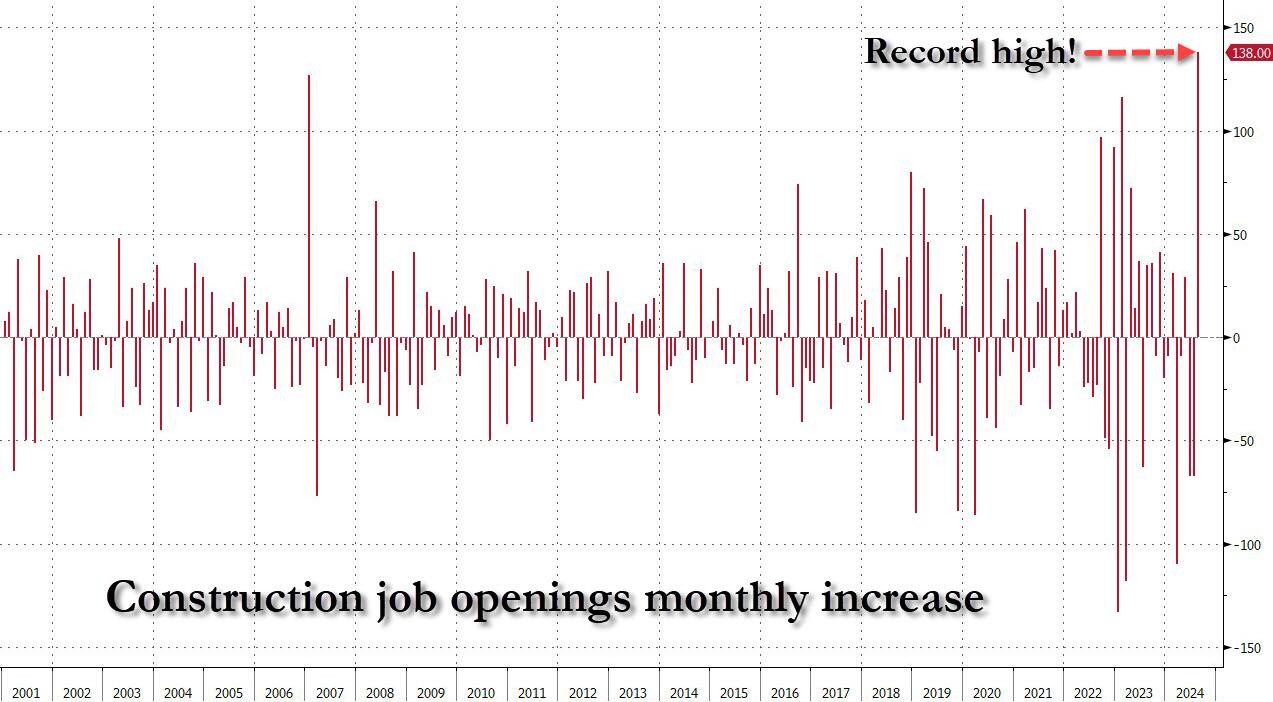
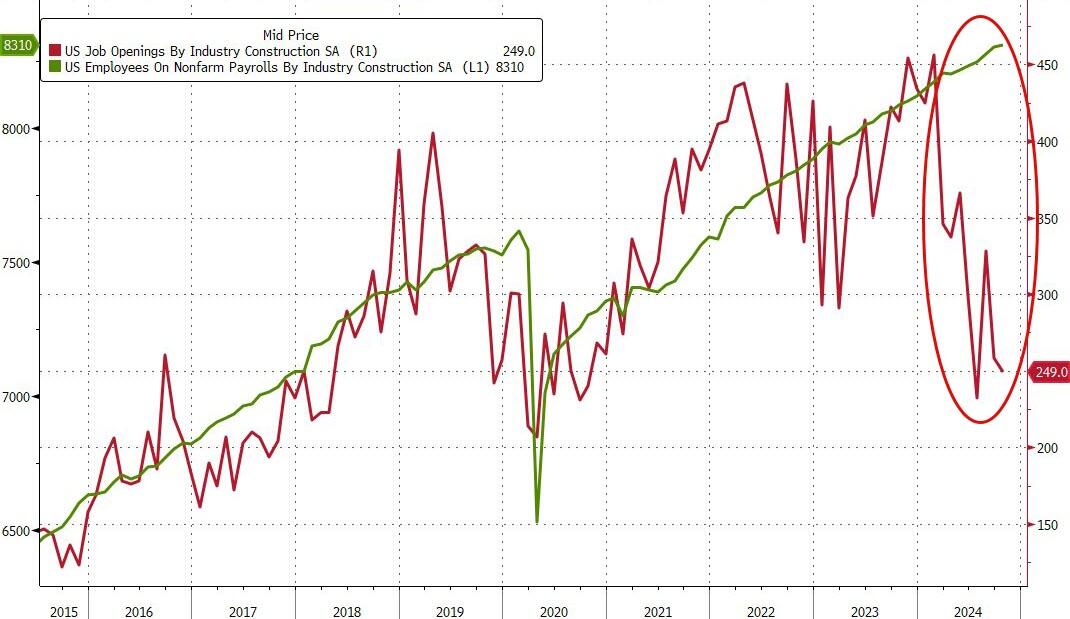
Amusingly, after we mocked two months ago the stunning surge in construction job openings just as a record chasm had opened between the manipulated number of construction jobs and openings…
… which meant the biggest monthly surge in construction job openings on record at a time when the housing market has effectively frozen thanks to sky high interest rates, a simply glorious paradox of manipulated bullshit data…
… the BLS realized that it had to make an adjustment after getting called out, and Construction Job openings dropped by another 9K to 249K and back to post-covid lows. Oh, and yes, the number of “construction jobs” is about to fall off a cliff just as soon as Orange Man Bad enters the White House.
Setting the glaring data manipulation aside, in the context of the broader jobs report, in October the number of job openings was 770K more than the number of unemployed workers, an increase from the previous month and not too far from inverting once again, similar to what happened during the covid crash.
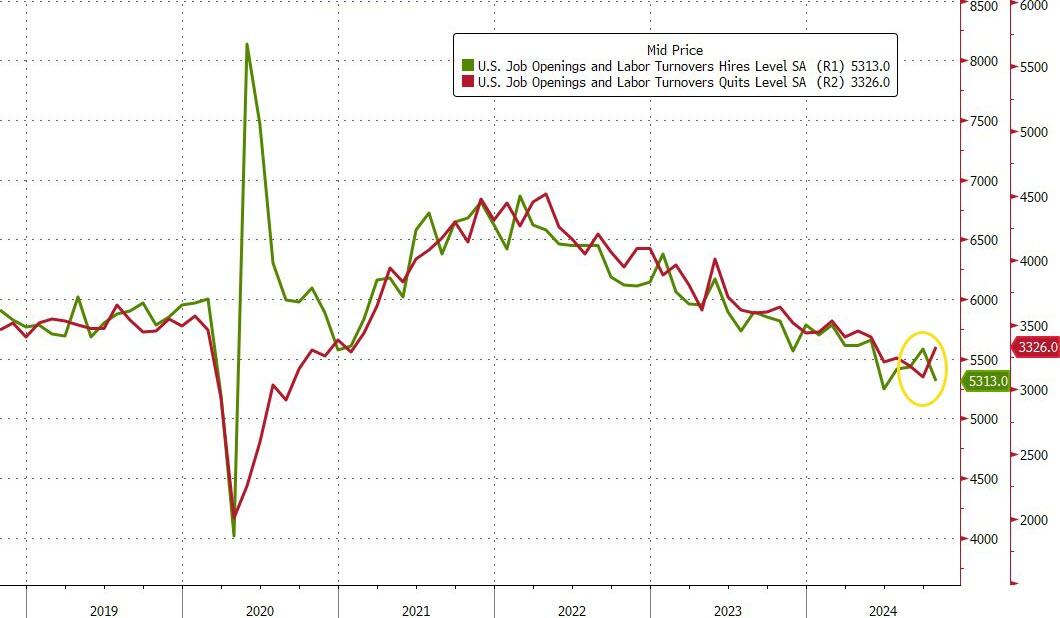
But while the job openings surge was a surprising reversal of the deteriorating trend observed for much of 2024, where even the DOL was stumped was the number of hires, which tumbled from 5.582 million to 5.313 million, a new post-covid low.
Commenting on the plunge, SouthBay Research notes that “hiring was weak in October and the last time hiring was this low was June and NFP slowed to 118K. But remember that this data aligns with the October Payroll data – not November’s. Both October NFP and the latest October JOLTS Hiring data cover the same period (through mid-October).” Furthermore, there were an additional 4 weeks since this JOLTS survey and hurricane recovery (aka hiring) rebounded. In addition, as the Job Openings indicate, employer intent to hire was already underway when this survey was completed.
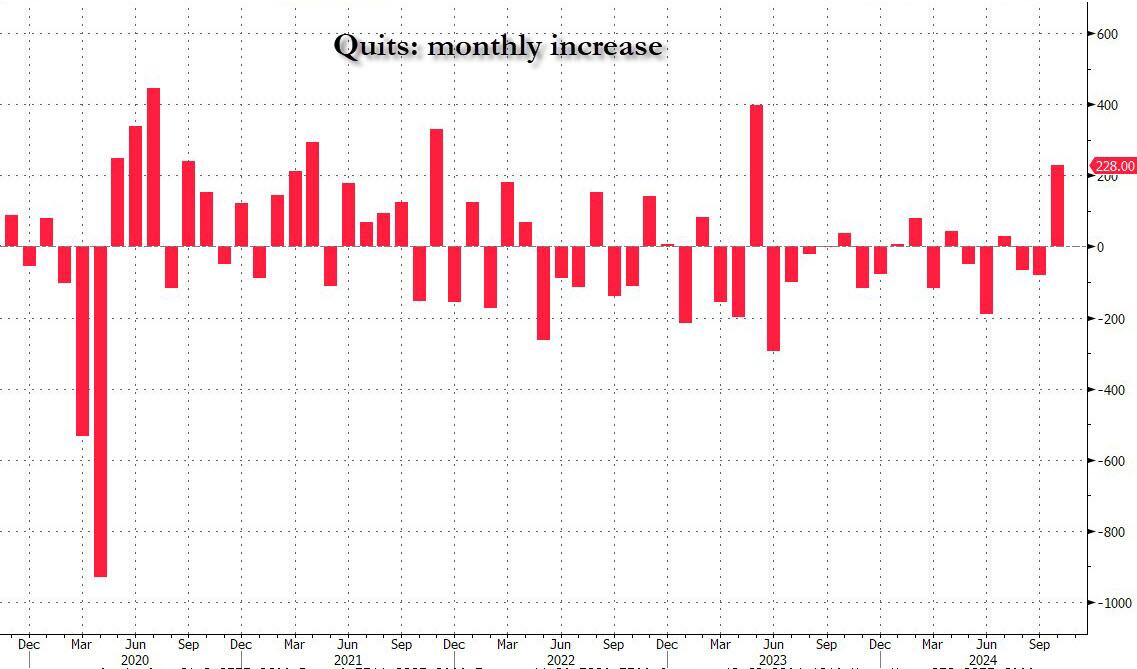
Meanwhile, the drop in hiring was offset by a surprise spike in the number of Quits, which rose by 228K from 3.098MM to 3.326MM, the biggest increase since May 2023, with quits increasing in accommodation and food services (+90,000).
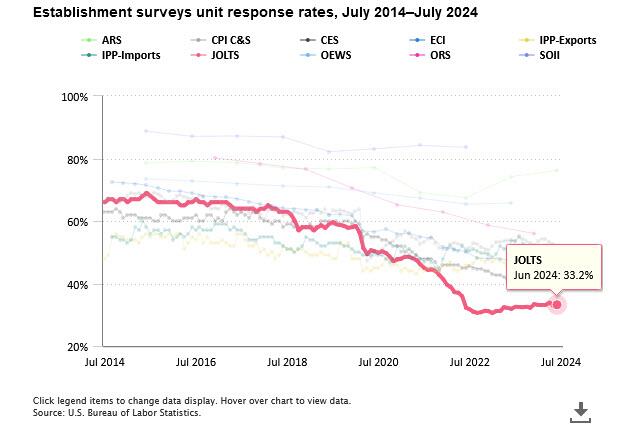
Finally, no matter what the “data” shows, let’s not forget that it is all just estimated, and it is safe to say that the real number of job openings remains still far lower since half of it – or some 70% to be specific – is guesswork. As the BLS itself admits, while the response rate to most of its various labor (and other) surveys has collapsed in recent years, nothing is as bad as the JOLTS report where the actual response rate remains near a record low 33%
In other words, more than two thirds, or 67% of the final number of job openings, is made up!
Looking ahead to Friday’s November Nonfarm Payrolls, the report will be driven by hurricane recovery, with the JOLTS data pointing to a lot of weakness in exactly the areas October Payrolls slipped. As for organic hiring, there have been no anecdotal signs of hiring pullback heading into November. On the contrary: businesses seem to be inclined to ramp up a bit, now that Trump is president and promises a dramatic easing of regulations.
The Market Composite Index, a measure of mortgage loan application volume, decreased 10.8 percent on a seasonally adjusted basis from one week earlier. On an unadjusted basis, the Index decreased 12 percent compared with the previous week. The seasonally adjusted Purchase Index decreased 5 percent from one week earlier. The unadjusted Purchase Index decreased 7 percent compared with the previous week and was 2 percent higher than the same week one year ago.
The Refinance Index decreased 19 percent from the previous week and was 48 percent higher than the same week one year ago.
“Ten-year Treasury rates remain volatile and continue to put upward pressure on mortgage rates. The 30-year fixed rate last week increased to 6.81 percent, the highest level since July,” said Joel Kan, MBA’s Vice President and Deputy Chief Economist. “Applications decreased for the sixth consecutive week, with purchase activity falling to its lowest level since mid-August and refinance activity declining to the lowest level since May. The average loan size on a refinance application dropped below $300,000, as borrowers with larger loans tend to be more sensitive to any given changes in mortgage rates.”
The refinance share of mortgage activity decreased to 39.9 percent of total applications from 43.1 percent the previous week. The adjustable-rate mortgage (ARM) share of activity increased to 7.0 percent of total applications.
The FHA share of total applications decreased to 15.5 percent from 16.4 percent the week prior. The VA share of total applications decreased to 12.5 percent from 14.6 percent the week prior. The USDA share of total applications increased to 0.5 percent from 0.4 percent the week prior.
The average contract interest rate for 30-year fixed-rate mortgages with conforming loan balances ($766,550 or less) increased to 6.81 percent from 6.73 percent, with points decreasing to 0.68 from 0.69 (including the origination fee) for 80 percent loan-to-value ratio (LTV) loans. The effective rate increased from last week.
The average contract interest rate for 30-year fixed-rate mortgages with jumbo loan balances (greater than $766,550) increased to 6.98 percent from 6.77 percent, with points increasing to 0.65 from 0.49 (including the origination fee) for 80 percent LTV loans. The effective rate increased from last week.
The average contract interest rate for 30-year fixed-rate mortgages backed by the FHA increased to 6.75 percent from 6.55 percent, with points decreasing to 0.87 from 0.94 (including the origination fee) for 80 percent LTV loans. The effective rate increased from last week.
The average contract interest rate for 15-year fixed-rate mortgages decreased to 6.21 percent from 6.27 percent, with points decreasing to 0.55 from 0.77 (including the origination fee) for 80 percent LTV loans. The effective rate decreased from last week.
The average contract interest rate for 5/1 ARMs decreased to 6.05 percent from 6.20 percent, with points increasing to 0.84 from 0.59 (including the origination fee) for 80 percent LTV loans. The effective rate decreased from last week.
The bond market is reacting to the election of Trump with a clear Bear Steepening.
Bear steepening happens when yields move up across tenors, but long-end yields move up even faster than short-end yields.
This isn’t going to help mortgage applications due to lowering rates.
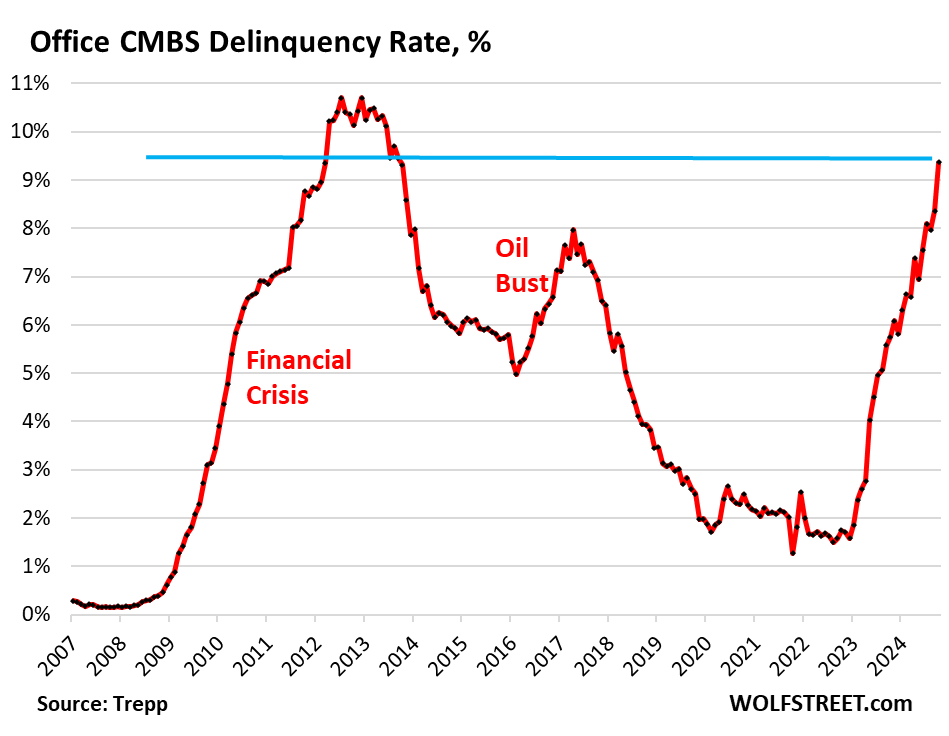
The office sector of commercial real estate has been in a depression for about two years, with prices of older office towers plunging by 50%, 60%, or 70% from their last transaction, and sometimes even more, with some office towers selling for land value, with the building by itself being worth next to nothing even in Manhattan.
Landlords of office buildings are having trouble collecting enough in rent to even pay the interest on their loans, and they’re having trouble or are finding it impossible to refinance a maturing loan, and so many of them have stopped making interest payments on their mortgages, and delinquencies continue to spike.
The delinquency rate of office mortgages backing commercial mortgage-backed securities (CMBS) spiked to 9.4% in October, up a full percentage point from September, and the highest since the worst months of the meltdown that followed the Financial Crisis. The delinquency rate has doubled since June 2023 (4.5%), according to data by Trepp, which tracks and analyzes CMBS.
Office CRE fund managers have spread the rumor that office CRE has bottomed out, but the CMBS delinquency rate doesn’t agree with this bottomed-out scenario; it’s aggressively spiking.
Three months ago, the delinquency rate surpassed the surge in delinquencies that followed the American Oil Bust from 2014 through 2016, when hundreds of companies in the US oil-and-gas sector filed for bankruptcy as the price of oil had collapsed due to overproduction, which devastated the Houston office market in 2016.
But now there’s a structural problem that won’t easily go away with the price of oil: A huge office glut has emerged after years of overbuilding and industry hype about the “office shortage” that led big companies to hog office space as soon as it came on the market with the hope they’d grow into it. However, during the pandemic, companies realized that they don’t need all this office space, and vast portions of it sits there vacant and for lease, with vacancy rates in the 25% to 36% range in the biggest markets.
Mortgages are considered delinquent by Trepp when the borrower fails to make the interest payment after the 30-day grace period. A mortgage is not considered delinquent here if the borrower continues to make the interest payment but fails to pay off the mortgage when it matures. This kind of repayment default, while the borrower is current on interest, would be on top of the delinquency rate here.
Loans are pulled off the delinquency list if the interest gets paid, or if the loan is resolved through a foreclosure sale, generally involving big losses for the CMBS holders, or if a deal gets worked out between landlord and the special servicer that represents the CMBS holders, such as the mortgage being restructured or modified and extended.
Survive till 2025 has been the motto. But that might not work either. The Fed has cut its policy rate by 50 basis points in September and is likely to cut more but in smaller increments. Many CRE loans are floating-rate loans that adjust to a short-term rate (SOFR), and short-term rates move largely with the Fed’s policy rates. And floating-rate loans will have lower interest rates as the Fed cuts.
Long-term rates, including fixed-rate mortgage rates have risen sharply since the Fed started cutting rates, so that option isn’t appealing.
So the hope in the CRE industry is that rate cuts will be steep and many, thereby reducing floating-rate interest payments, making it easier for landlords to meet them. And so the prescription was: Survive till 2025, when interest rates would be, they hope, far lower than they were.
But rate cuts will do nothing to address the structural issues that office CRE faces. The landlord of a nearly empty older office tower isn’t going to be able to make the interest payment even at a lower rate when the tower is largely vacant.
And these older office towers face the brunt of the vacancy rates, amid a flight to quality now feasible because of vacancies even at the latest and greatest properties. And there are a lot of these older office towers around that have been refinanced at very high valuations in the years before the pandemic, but whose valuations have now plunged by 50%, 60%, or 70%, and they have become a nightmare for lenders and CMBS holders.
Options imply a +/-1.1% move in S&P 500 for the 18-Sept FOMC meeting; this compares to an average of +/-1.2% move priced into SPX ahead of FOMC meetings since the beginning of 2022.
Arguably, this is an unusually important FOMC meeting due to the expected start of a cutting cycle.
On average, the S&P 500 has moved +/-1.3% during FOMC events since the beginning of 2022, coming above options implied moves.
In the July FOMC meeting the index moved +/-1.6% vs. an options implied expectations for a +/-1.1% move.
Goldman’s economists expect the September FOMC meeting to be the start of the Fed easing cycle with a 25bp rate cut followed by two consecutive 25bp rate cuts in November and December, and an eventual terminal rate of 3.25-3.5%.
They see differing asset performances around the start of the easing cycle depending on what motivated the Fed cuts.
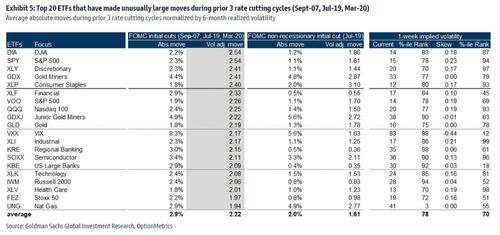
Goldman analyzed moves across stocks and ETFs during the first Fed rate cut in the prior 3 Fed easing cycles (18-Sep-2007, 31-Jul-2019 & 3-Mar-2020).
Rate cuts during the 2007 and 2020 easing cycles were associated with a recession while the 2019 cut was due to a growth scare.
In the tables below are the top 20 names that saw unusual moves during the prior 3 Fed easing cycles and for the 2019 cycle separately.
Financials and Tech were major movers during the beginning of the prior 3 Fed easing cycles while the 2019 cycle also saw unusual moves in Consumer Staples.
Mortgage applications decreased 3.9 percent from one week earlier, according to data from the Mortgage Bankers Association’s (MBA) Weekly Applications Survey for the week ending July 26, 2024.
The Market Composite Index, a measure of mortgage loan application volume, decreased 3.9 percent on a seasonally adjusted basis from one week earlier. On an unadjusted basis, the Index decreased 4 percent compared with the previous week. The seasonally adjusted Purchase Index decreased 2 percent from one week earlier. The unadjusted Purchase Index decreased 1 percent compared with the previous week and was 14 percent lower than the same week one year ago.
Note the decline in mortgage purchase demand after Biden/Harris were sworn into office in Janaury 2021.
The Refinance Index decreased 7 percent from the previous week and was 32 percent higher than the same week one year ago. The average contract interest rate for 30-year fixed-rate mortgages with conforming loan balances ($766,550 or less) remained unchanged at 6.82 percent, with points increasing to 0.62 from 0.59 (including the origination fee) for 80 percent loan-to-value ratio (LTV) loans.
Because of rising rates under Biden/Harris economic policies, mortgage refinancing demand has gotten crushed.
We are in the latter half of the year, so seasonalility will kill off purchase mortgage demand compared to the Spring and early Summer.
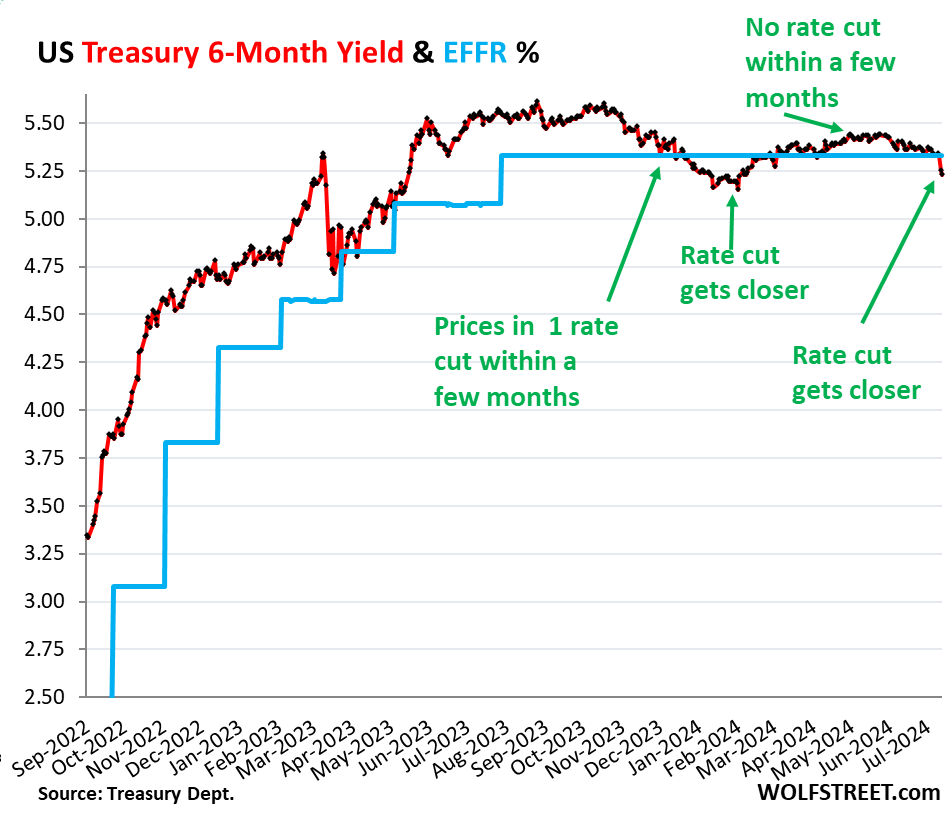
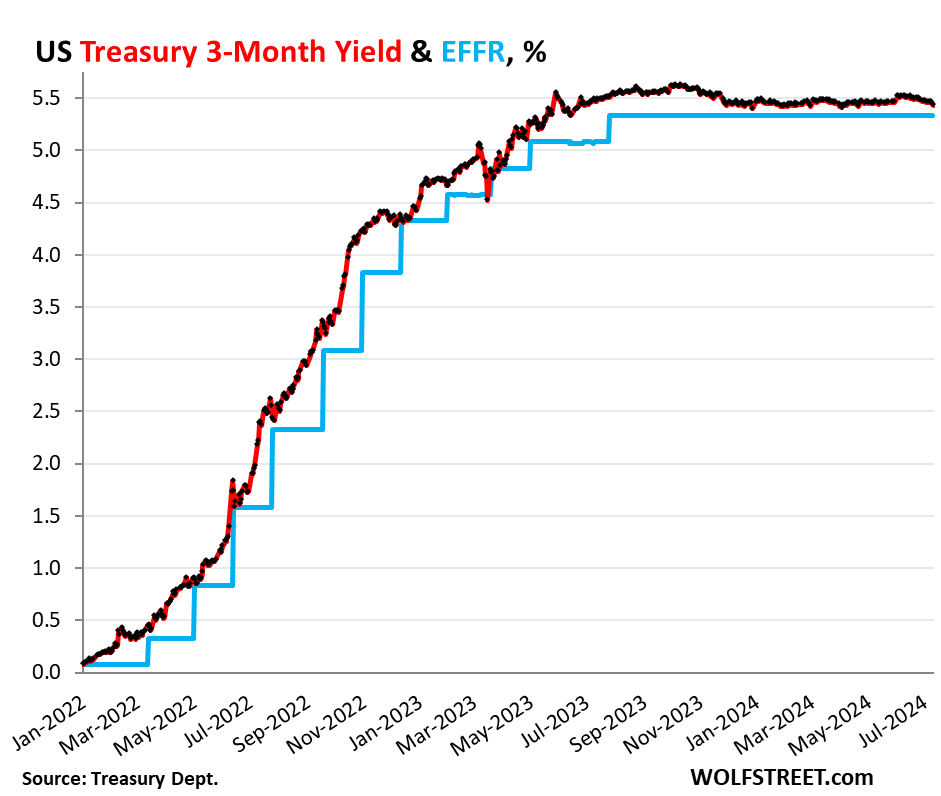
It brought the 6-month yield just a tad below the lower end of the Fed’s target range for the federal funds rate (5.25-5.50%), and below the effective federal funds rate (EFFR), currently 5.33% (blue in the chart below):
So the 6-month yield is now pricing in one rate cut within its 6-month window, more heavily weighted toward the first two-thirds or so of that window, after having already wrongly done so at the beginning of this year.
Back in late November through January, the 6-month yield had also priced in a rate cut within its 6-month window. By February 1, the yield had dropped to 5.15%, a sign the market was certain that there would be a rate cut at the March FOMC meeting.
But the market was wrong. Instead, we got a series of ugly inflation readings for January, February, March, and April, and there still hasn’t been a rate cut.
By March and April, with ugly inflation readings accumulating, rate cuts within the 6-month window of the 6-month yield were taken off the table.
May had provided a much softer inflation reading. And with Thursday’s CPI report of June, a rate cut within the 6-month window of the 6-month yield, weighted toward the first two-thirds of the window, was back on the table.
But the shorter-term Treasury yields are not pricing in a rate cut within their shorter windows. The shorter yields didn’t move much since the CPI report, and all were near the upper end of the Fed’s policy rates (5.5%), and all were above the EFFR (5.33%):
1-month yield: +1 basis point to 5.47%
2-month yield: +2 basis points 5.52%
3-month yield: -3 basis points to 5.43%
4-month yield: -5 basis points to 5.41%
In other words, the Treasury market is not expecting a rate cut in July at all, but sees a good chance of a rate cut in September, not as strong a chance as they saw in late January, when they saw a rate cut with near certainty by March that never came.
The three-month yield is not seeing any rate cuts within the first two-thirds of its window. No rate cut in July, and the September 18 FOMC meeting statement is beyond the first two-thirds of the window and has less impact on the current three-month yield:
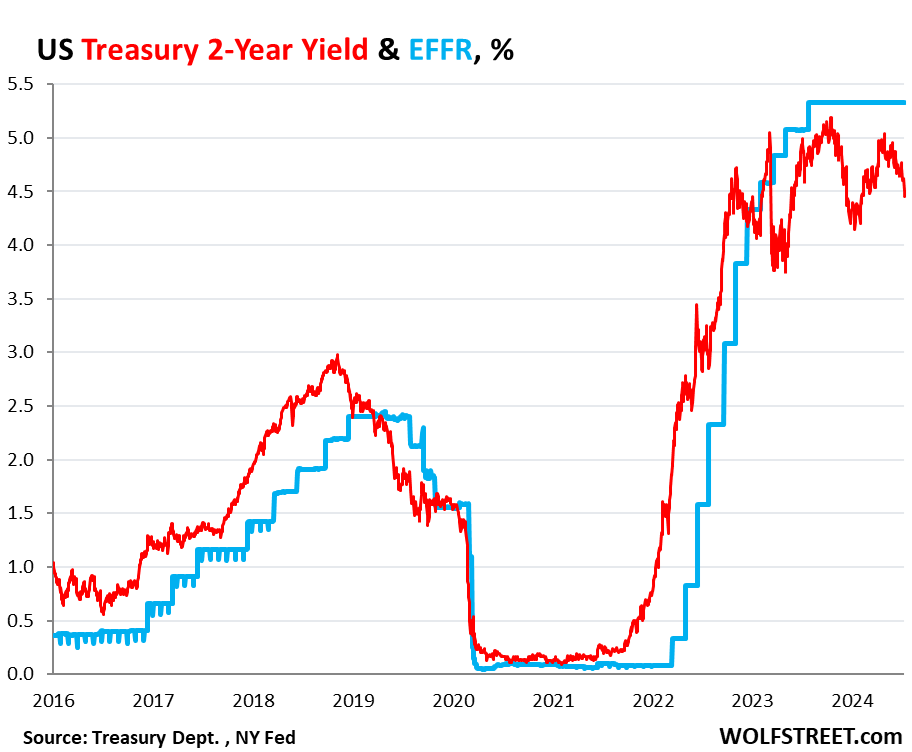
The market for the 2-year yield has been wrong all along.
The 2-year Treasury yield demonstrates how wrong the Treasury market has been all along about the Fed’s rate hikes and rate cuts: it expected far fewer and smaller rate hikes than what the Fed eventually did. And then without ever rising to the level that would price in the actual rates that the Fed has held for nearly a year, it started pricing in rate cuts before the Fed even stopped hiking rates.
So back in April 2022, the two-year yield was about 2.5%. Now, today, 2.5% sounds like a lousy yield, but back then – after 15 years of near-0% interrupted by a few years of higher yields that maxed out at around 2.4% in 2019 – 2.5% sounded pretty good, and the market thought that was getting pretty close to the Fed’s terminal rate.
In February 2022, before the Fed’s rate hikes started, Goldman Sachs predicted that the Fed would hike seven times in 2022, each by 25 basis points, and then in 2023 three times by 25 basis points each, one hike per quarter, to reach a terminal target range for the federal funds rate of 2.5-2.75% by Q3 2023.
The Fed ended up doing more double that, and by July 2023.
So the 2-year Treasury note that sold at auction in April 2022 with a coupon of 2.5% and with a yield close to that sounded like a good deal, and we, being part of the Treasury market, nibbled on some too. Two years was as long as we went. The rest of our Treasuries are T-bills.
Those 2-year notes matured in April 2024, and we got paid face value, and we earned about 2.5% in interest each year over those two years. The entire market was wrong – and so were we. The Fed would raise to 5.25-5.5% by July 2023, more than double the yield we received, and its rate is still there, and the yields of our two- three- and four-month T-bills have by far outrun our 2-year note.
The 2-year yield closed at 4.45% on Friday. The market never once came even close to betting that the Fed would hold rates above 5% for long, and they’ve been above 5% for over 14 months. And the 2-year yield has been below the EFFR for almost the entire time since January 2023, having turned into the Doubting Thomas.
The market was wrong about the Fed’s rates, and all 2-year notes that were bought at auction and that matured in 2024 or will mature in 2024 were a lousy deal. Buyers would have been better off with a series of short-term T-bills that stick closely to Fed’s actual policy rate — rather than follow market projections.
Someday, the market is going to get the rate-cut bets right. But it will only take a few more lousy inflation readings for the rate cuts to get moved further into the future. On Friday, the PPI showed up with red-hot services inflation, now delineating a clear U-Turn in December. Producers that pay those higher prices for services will try to pass them on, and so they may ultimately filter into consumer prices and higher inflation readings over the next few months. Or if producers cannot pass on the higher costs of services, their margins will get squeezed.
Inflation is unpredictable. Once inflation has broken out in a big way, as history shows us, it tends to come in waves and tends to dish up nasty surprises. And it already has dished up nasty surprises multiple times so far, including each of the first four months of this year.
Housing in the US is simply unaffordable. Particularly since home prices and mortgage rates have soared undier Biden.
.Owning a house is less affordable for average earners in the US than at anytime in 17 years.
The costs of a typical home — including mortgage payments, property insurance and taxes — consumed 35.1% of the average wage in the second quarter, the highest share since 2007 and up from 32.1% a year earlier, according to a new report from Attom.
Growth in expenses, along with mortgage rates hovering around 7%, have outpaced income gains as a persistent shortage of listings pushed the median home price to a record-high $360,000, Attom said. In more than a third of US markets, ownership costs ate up 43% of average local wages, far above the 28% considered to be a guideline for affordability.
The latest data “presents a clear challenge for homebuyers,” Rob Barber, chief executive officer of Attom, said in a statement. “It’s common for these trends to intensify during the spring buying season when buyer demand increases. However, the trends this year are particularly challenging for house hunters.”
Pricey markets in the West and Northeast had the biggest declines in affordability, including Orange and Alameda counties in California, and Brooklyn and Nassau County in New York.
Among the 589 counties analyzed, 582, or 98.8%, were less affordable in the second quarter than their historic affordability averages, Attom said.
On the mortgage side, mortgage applications decreased 2.6 percent from one week earlier, according to data from the Mortgage Bankers Association’s (MBA) Weekly Applications Survey for the week ending June 28, 2024.
The Market Composite Index, a measure of mortgage loan application volume, decreased 2.6 percent on a seasonally adjusted basis from one week earlier. On an unadjusted basis, the Index increased 8 percent compared with the previous week. The Refinance Index decreased 2 percent from the previous week andwas 29 percent higher than the same week one year ago. The seasonally adjusted Purchase Index decreased 3 percent from one week earlier. The unadjusted Purchase Index increased 7 percent compared with the previous week and was 12 percent lower than the same week one year ago.
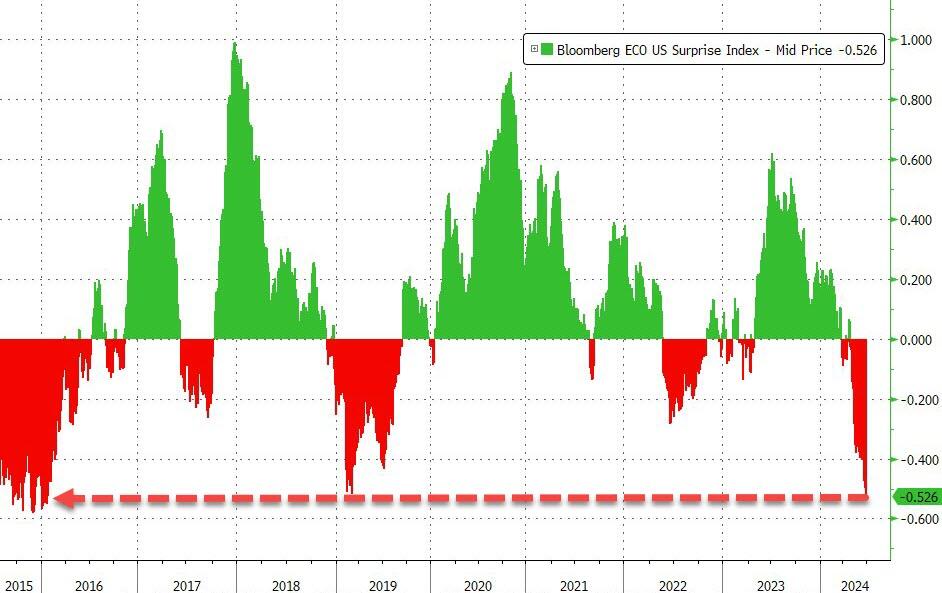
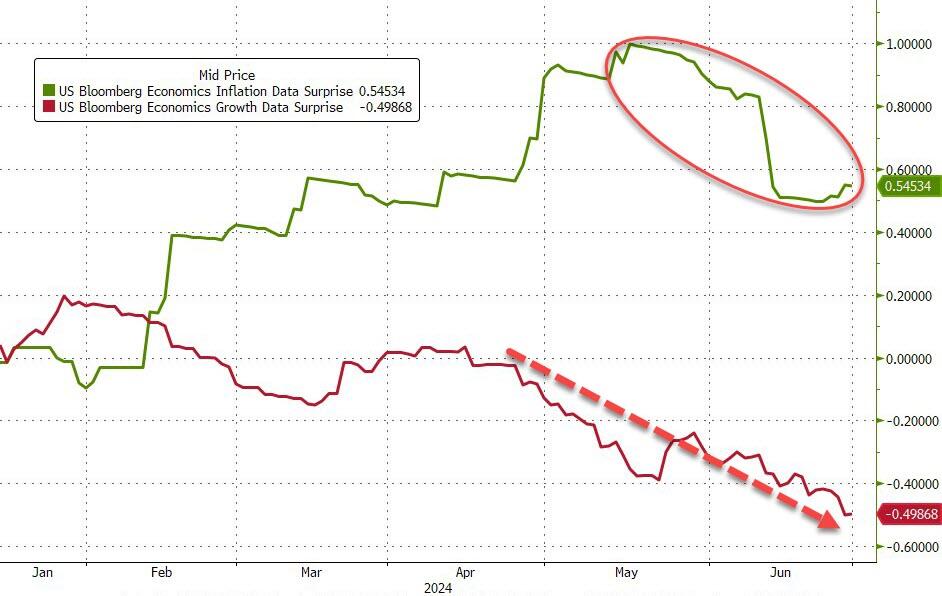
…which, many believe, will also drag down inflation (and it has been)…
Source: Bloomberg
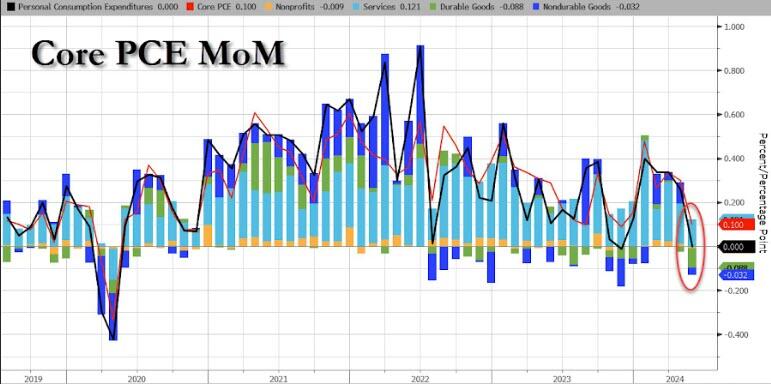
Today, we get to see The Fed’s favorite inflation indicator – Core PCE – which rose 0.1% MoM in May (after a revised +0.3% MoM for April) and in line with expectations. The headline PCE Price Index was unchanged MoM as expected as Durable Goods deflation trumped surging Services costs…
Source: Bloomberg
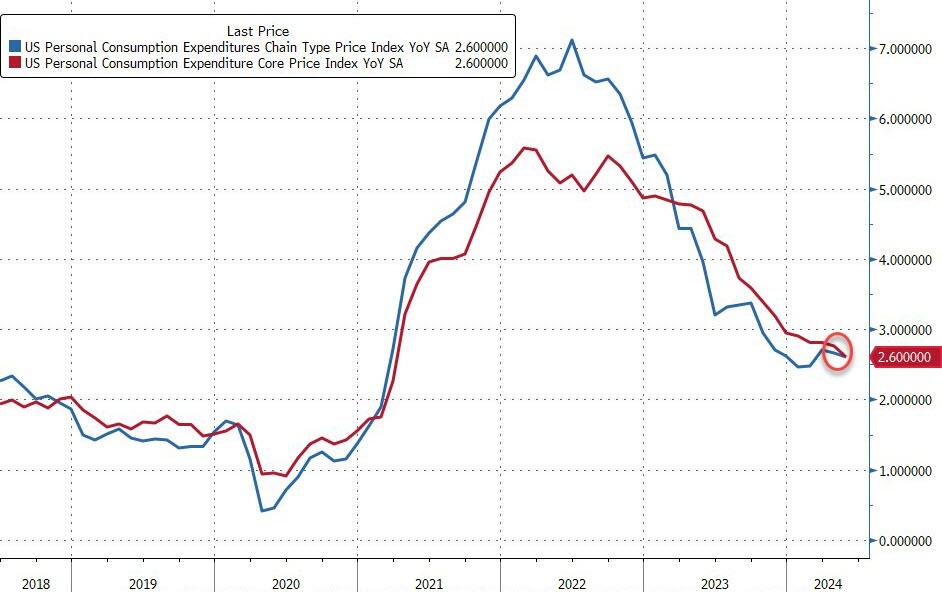
On a YoY basis, both headline and core PCE declined…
Source: Bloomberg
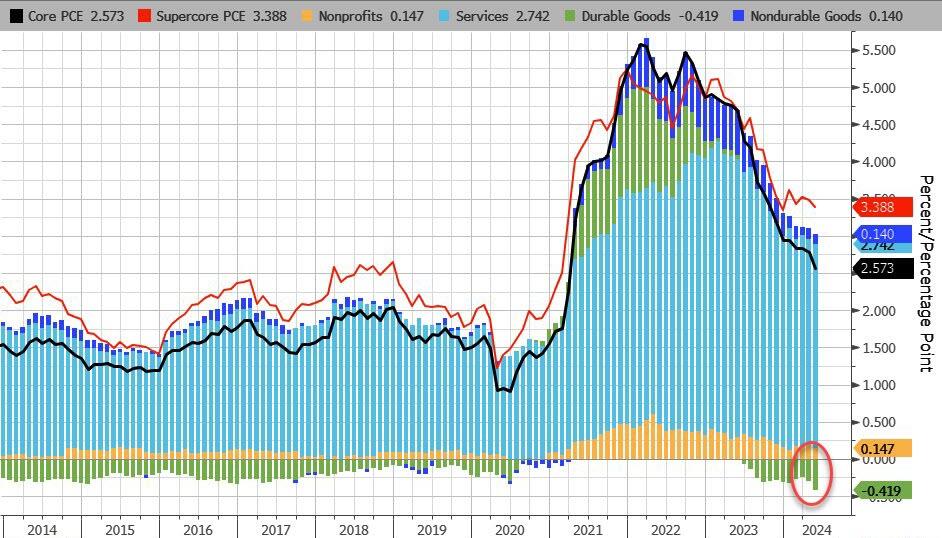
On a YoY basis, Durable Goods deflation is at its strongest in at least a decade…
Source: Bloomberg
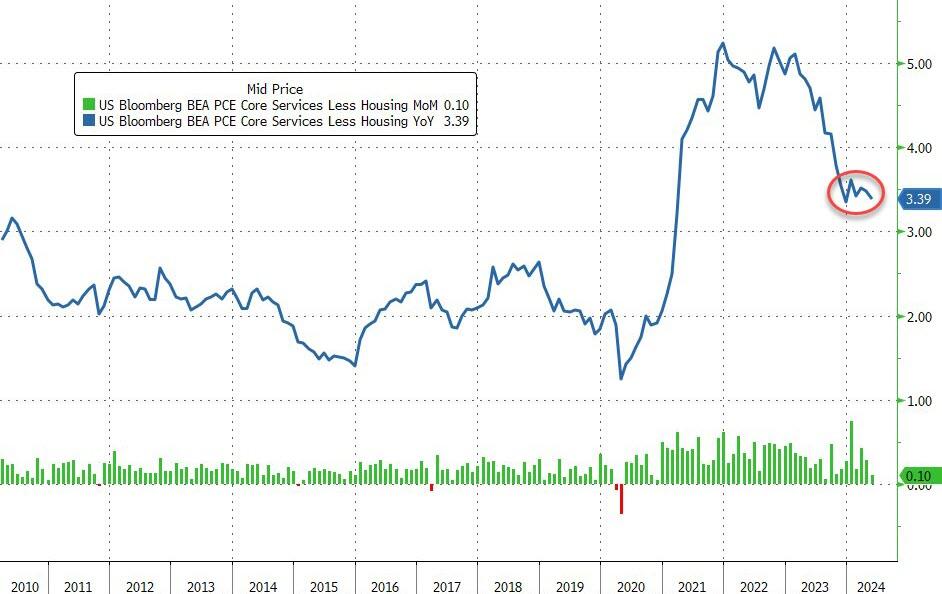
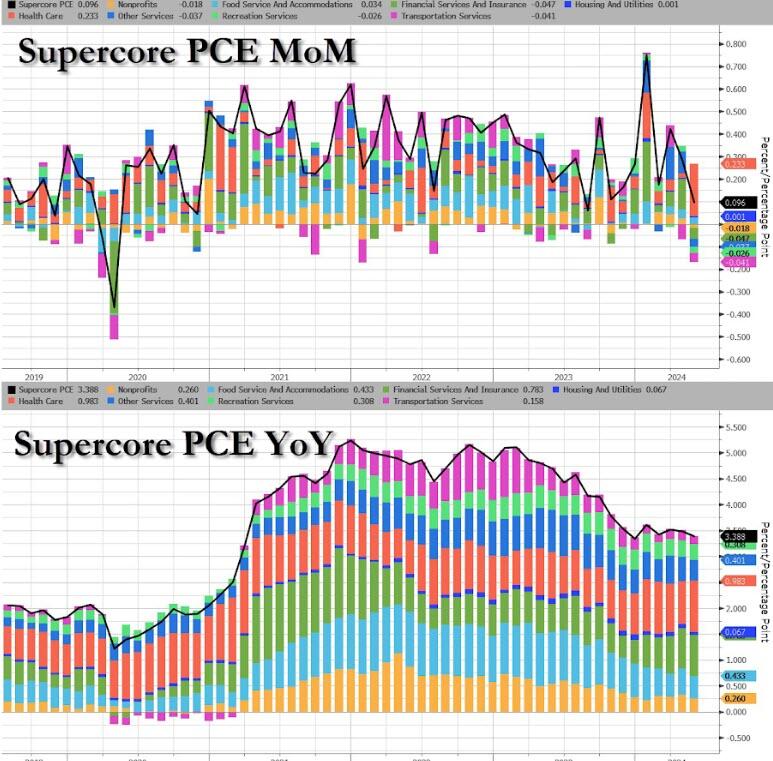
More notably, the so-called SuperCore PCE rose 0.1% MoM, which saw YoY slow to 3.39%… which is awkwardly stagnant at elevated levels…
Source: Bloomberg
That is the 49th straight monthly rise in SuperCore prices with Healthcare costs soaring…
Source: Bloomberg
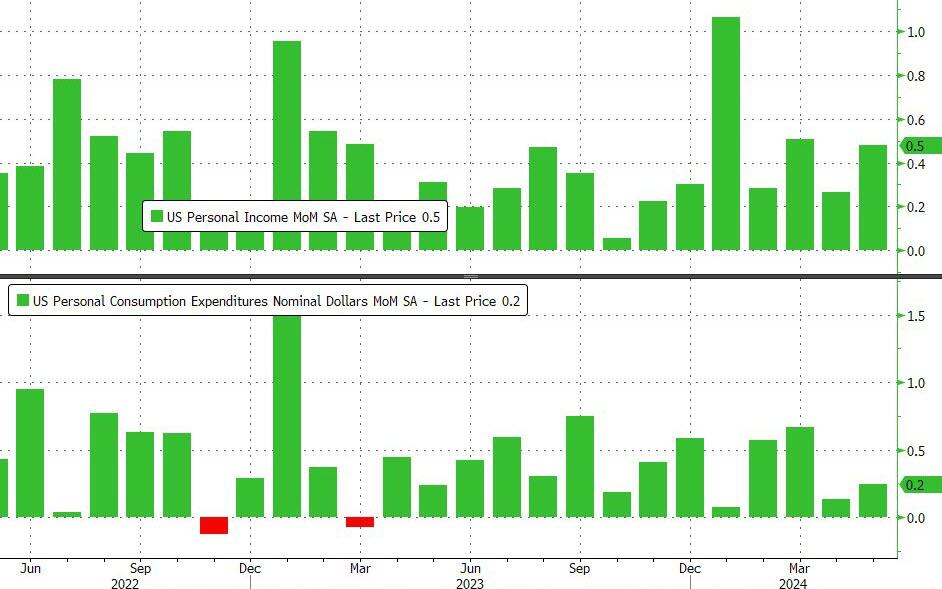
On a MoM basis, Income grew more than expected (+0.5% vs +0.2% exp) while spending rose less than expected (+0.2% MoM vs +0.3% exp)
Source: Bloomberg
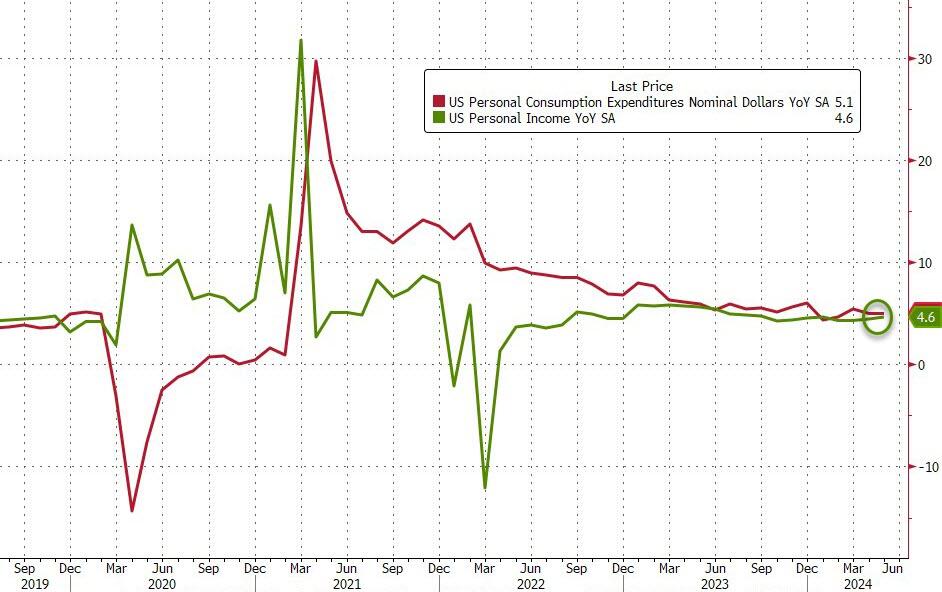
Which accelerated both income and spending on a YoY basis (with the latter outpacing the former, of course)…
Source: Bloomberg
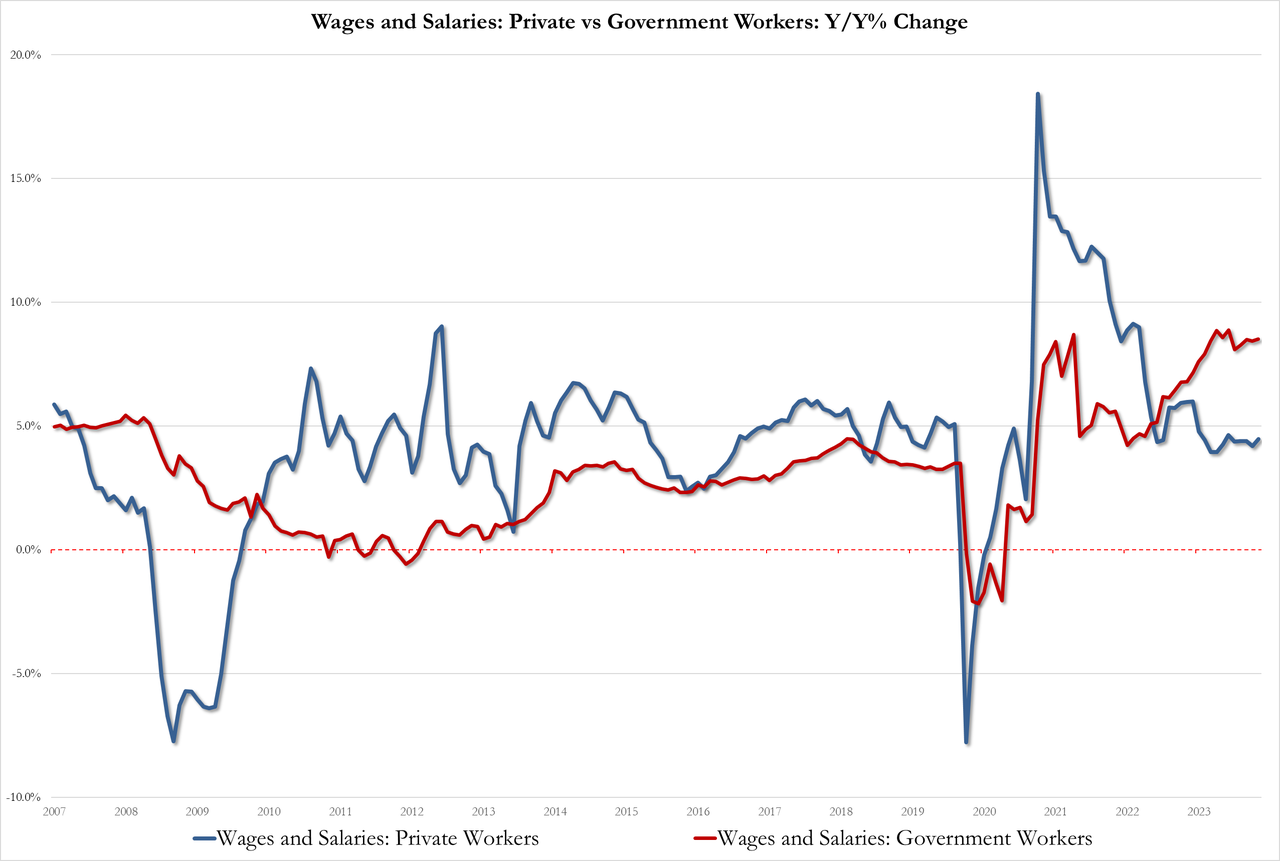
With wage pressures rising once again…
Government 8.5%, up from 8.4% but below the record high of 8.9%
Private 4.5% up from 4.2%
Source: Bloomberg
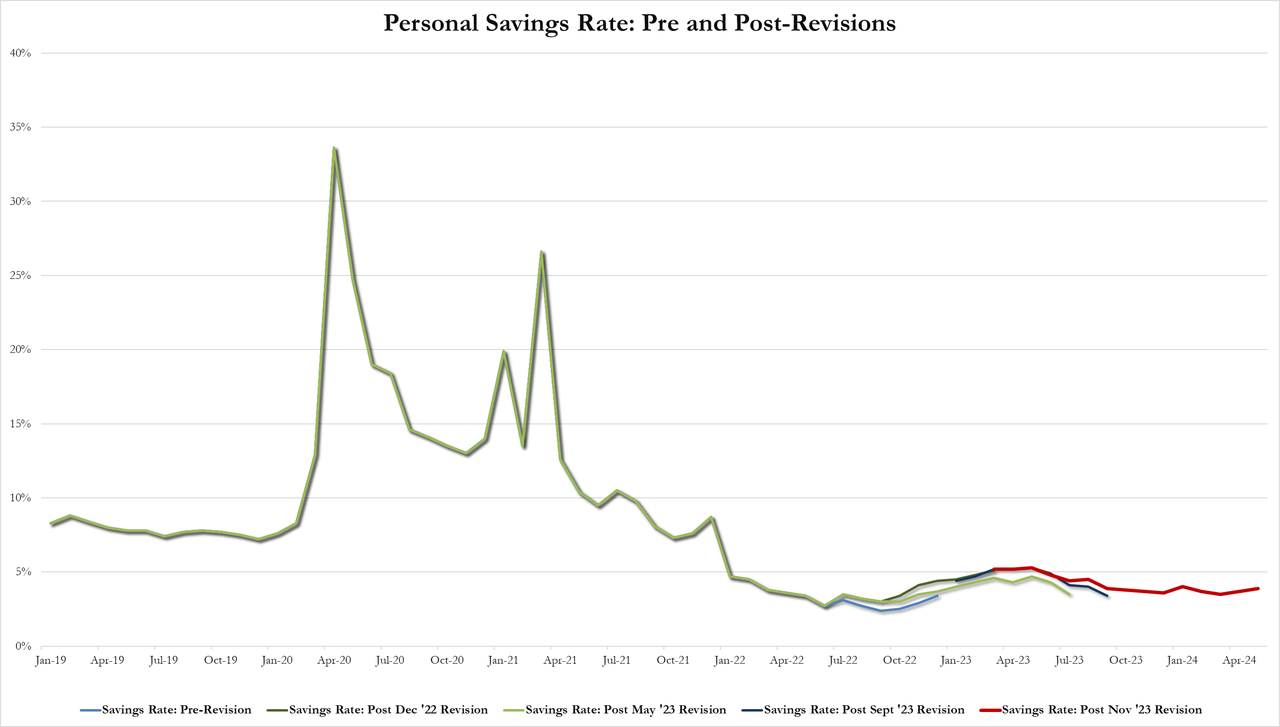
And after a series of revisions, the savings rate ticked up to 3.9% of DPI (from 3.7%) – the highest since January…
Source: Bloomberg
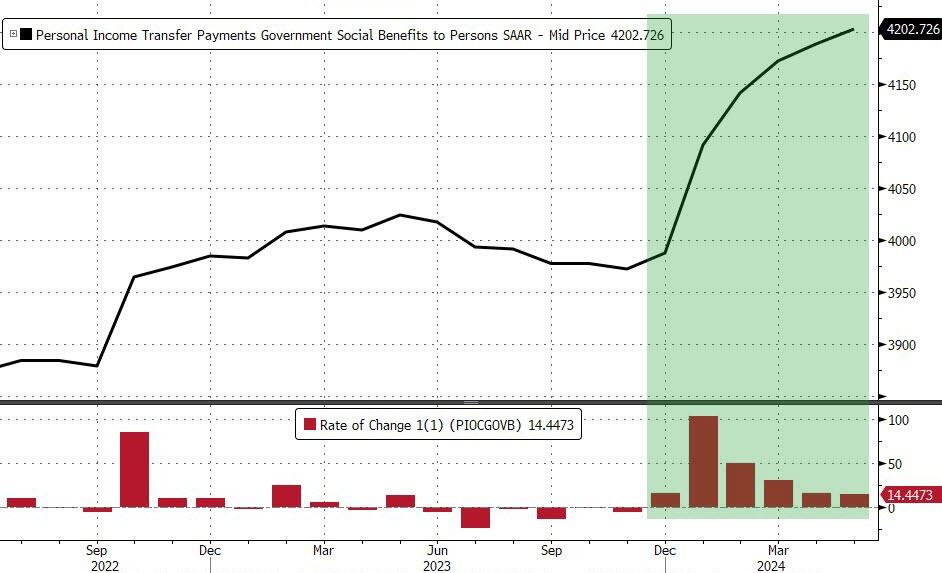
All of which takes place against a background of the sixth straight month of rising government handouts (well it is an election year after all)…
Source: Bloomberg
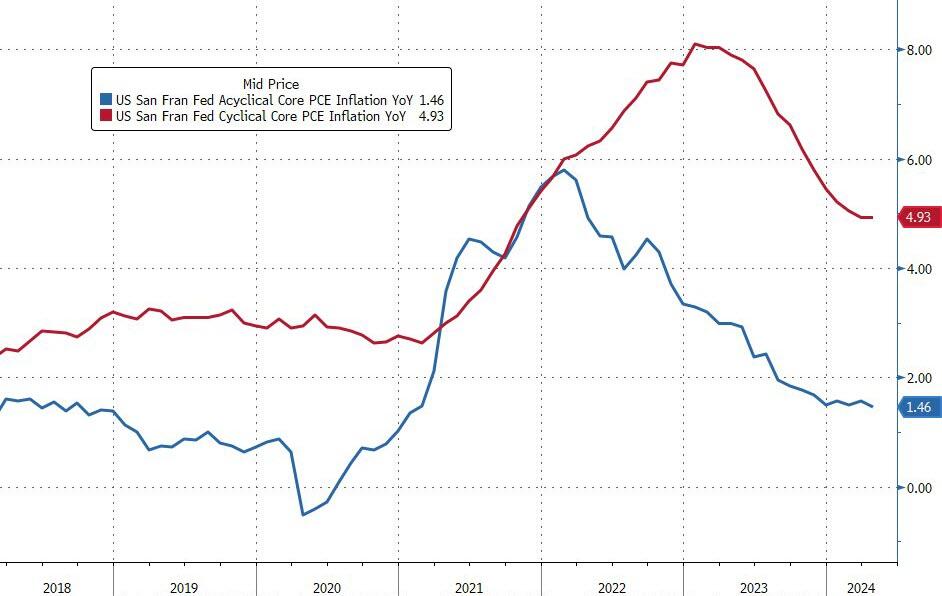
Finally, while acyclical inflationary pressures continue to drift lower, cyclical inflationary pressures remain extremely elevated…
Source: Bloomberg
A very mixed bag but nothing screams ‘automatic’ rate-cuts… and SuperCore refuses to budge.
But, below the hood of the last one we see some more interesting dynamics evolving as revenues and employment decline while prices re-accelerate…
Source: Bloomberg
This is the 25th straight month of contraction (sub-zero) for the Dallas Fed Services index and judging by the respondents’ comments, there is a clear place to point the finger of blame:
Poor national leadership and lack of confidence have eroded the business environment.
The Federal Reserve’s recent announcement of no rate cuts in the near future is concerning regarding the immediate and lag effect it could have on the local economy. We have received direct feedback from many of our clients in various industries, and they are increasingly concerned. They are freezing hires and spending, with many reducing spending. The primary reason is the economic stagnation locally and nationally affecting their businesses.
People are adjusting to new economic realities. Few are expecting salary increases and are instead making lifestyle adjustments to deal with higher living costs. Reality is also setting in for the apartment owners we serve. They understand rents aren’t going up and interest rates aren’t coming down. As rate caps expire and loans mature, lenders are having to adapt as well. Ultimately, a lot of private equity (much in the form of individual retirement savings put into syndications) is getting wiped out.
We need a rate cut before we will see any revenue improvement from home sales.
As elections draw near, the political environment worsens, creating more uncertainty in our business.
We feel inflation and fear of more inflation plus the rise in cost of living are holding consumers back. Hopefully we will adapt to the new realities soon.
Customers are concerned about the election, so they are holding off on large purchases.
The lack of building activity is shutting down the appliance industry.
Affordability has become an ever-increasing problem for new car dealers. The price increases of new cars combined with higher interest rates have put new cars out of reach for more and more people.
[Car] inventories continue to swell, and interest rates remain high. Our grosses are off, and margins continue to decline. Profits are down 20 percent from the prior year.
The economy is slowing. The consumer is more cautious and more reluctant to purchase at higher prices and payments.
And finally, this seemed to sum up just how business-owners feel in general about the current occupant of The White House:
“Our outlook depends heavily on the presidential election.


You must be logged in to post a comment.