
Powell and The Fed’s policies have veered from their mandate requiring Chairman Powell to meet 350 times with Congress to sell The Fed’s policies.
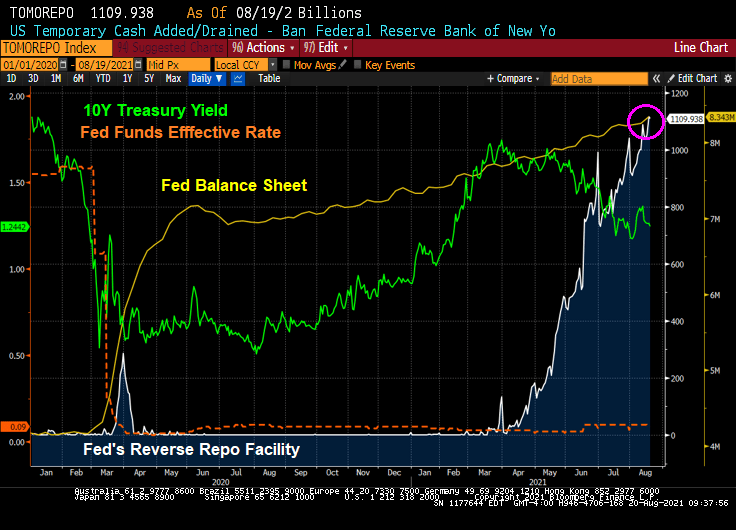
Bloomberg) — The Federal Reserve’s floor for overnight funding markets is proving to be no match for the deluge of cash.
Money-market securities ranging from Treasury bills to repurchase agreements continue to trade below 0.05% — the offering rate on the overnight reverse repo facility, which is supposed to act like a floor for the front end. The Fed at its June meeting had raised the rate by five basis points to help support the smooth functioning of short-term funding markets.
Still, usage of the tool climbed to a record $1.136 trillion on Monday, eclipsing the previous high of $1.116 trillion on Aug. 18.
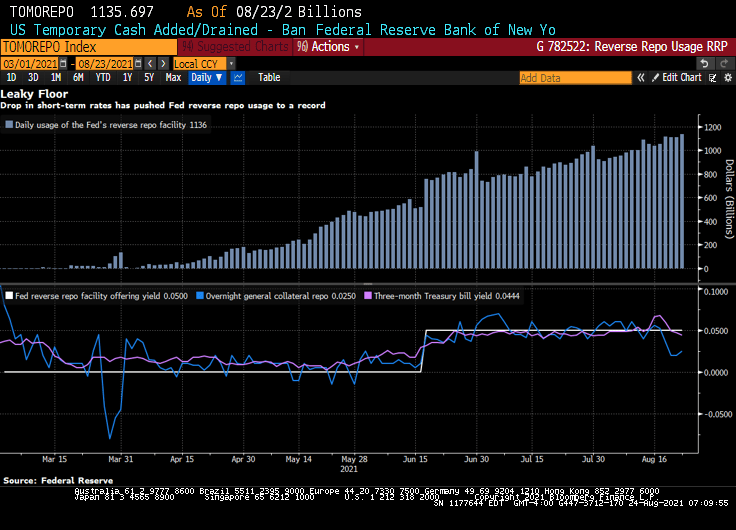
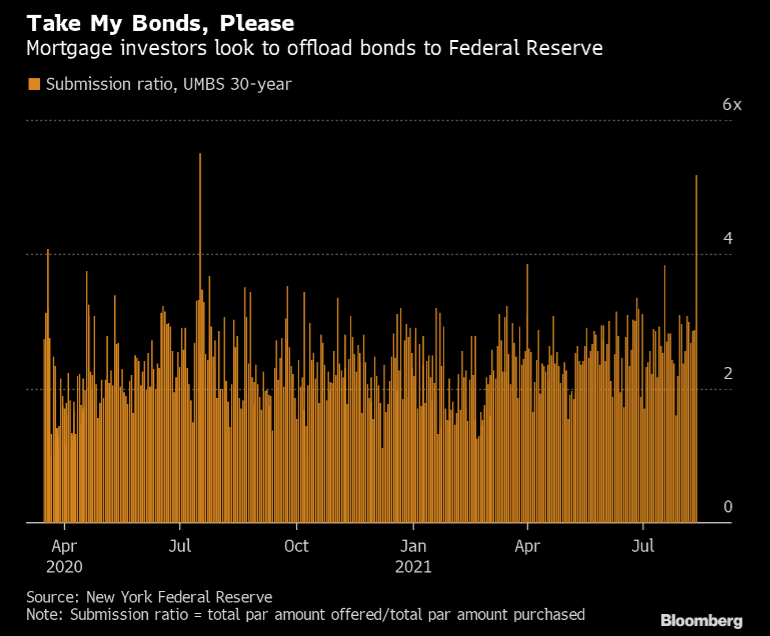
Demand for the so-called RRP facility has surged as a flood of dollars threatens to overwhelm funding markets. That’s in part a result of the central bank’s long-standing asset purchases and drawdowns of the Treasury’s cash account, which is pushing reserves into the system. As a result, liquidity has been swelling, especially as the Treasury cuts supply to create more borrowing room under the debt ceiling.
The pressure pushing down overnight rates toward zero is proving a major headache for money-market funds. It hampers their ability to invest profitably, and can lead to further disruptions as they begin to waive fees to avoid passing on negative rates to shareholders. A number of firms including Vanguard Group shut down prime money-market funds last year after struggling to cover operating costs in the low-interest-rate environment.
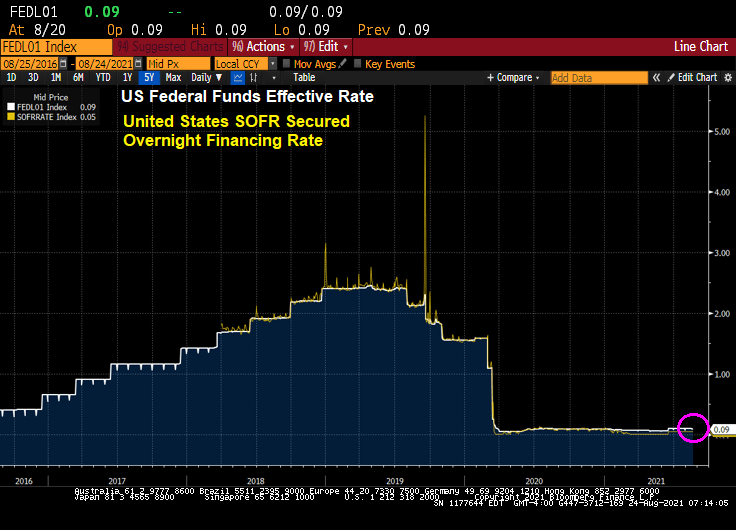
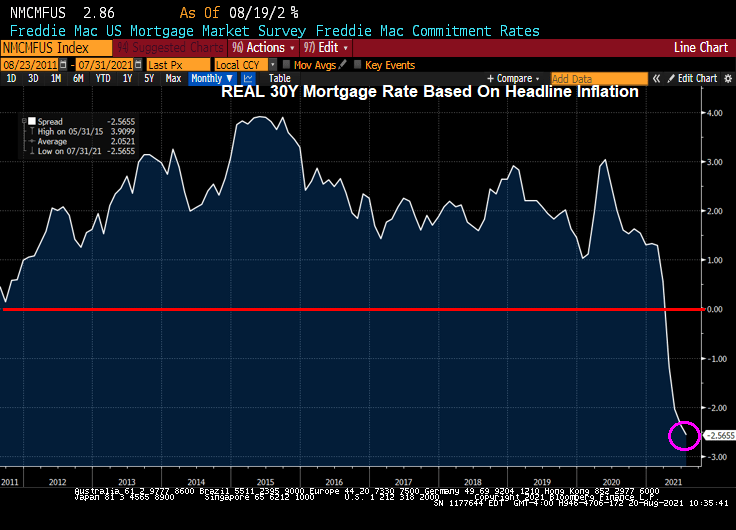
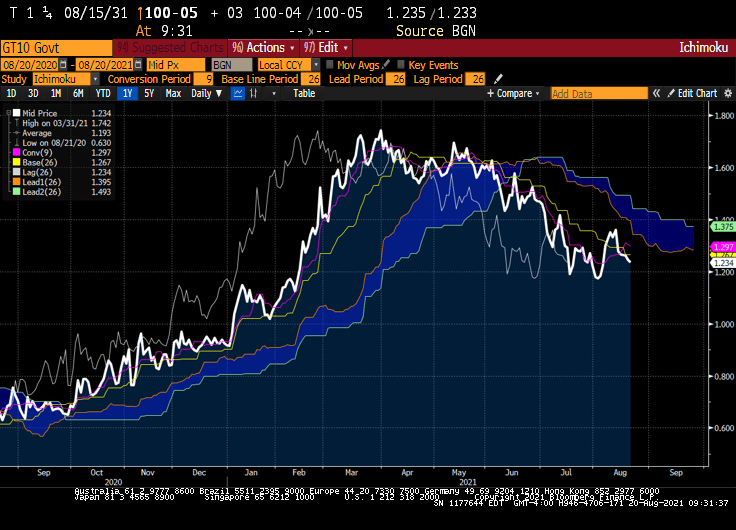
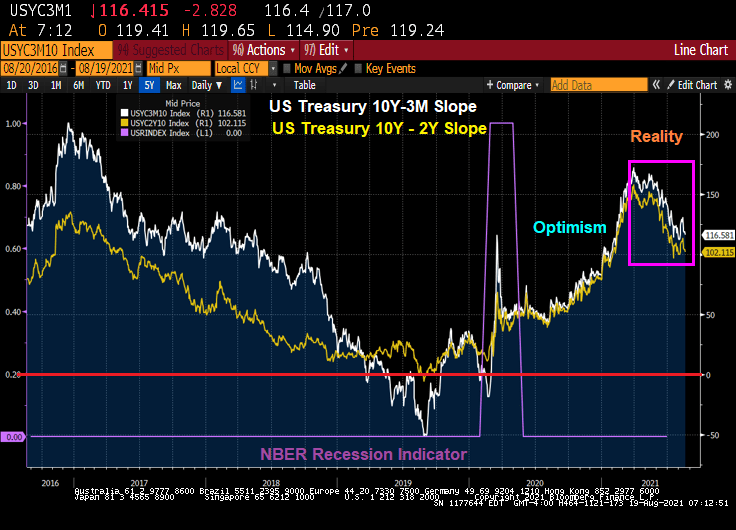
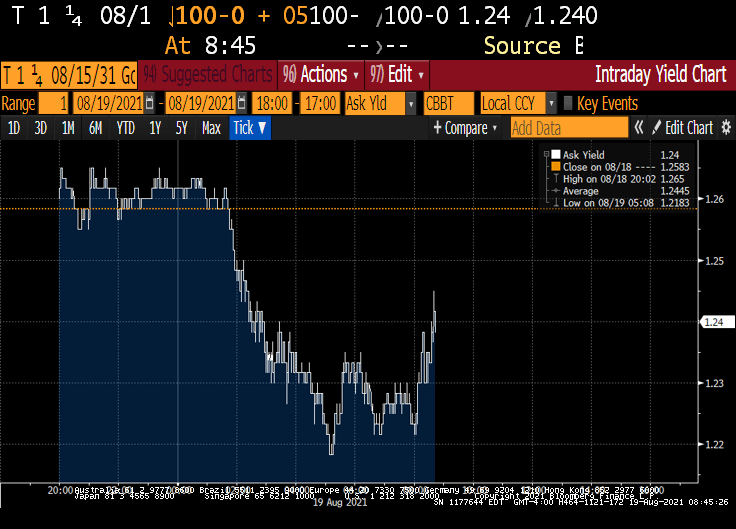
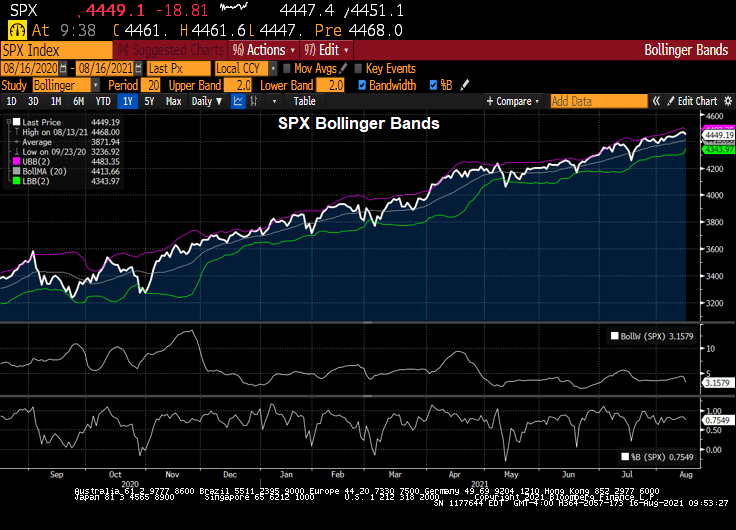
Yes, overnight rates such as the US SOFR rate, are near zero.
Powell’s Charm Offensive in Congress Positions Him to Keep Job
Perhaps that is why Federal Reserve Chair Jerome Powell is acting as a lobbyist with Congress for The Fed’s nontraditional approach to monetary policy.
(Bloomberg) Since he took the helm of the Fed in February 2018, through June of this year, he’s held at least 350 meetings, dinners or phone calls with members of Congress, according to his monthly calendars. That’s almost nine per month, and many of those included more than one lawmaker. The tally doesn’t count at least 16 appearances as chair before numerous congressional committees.
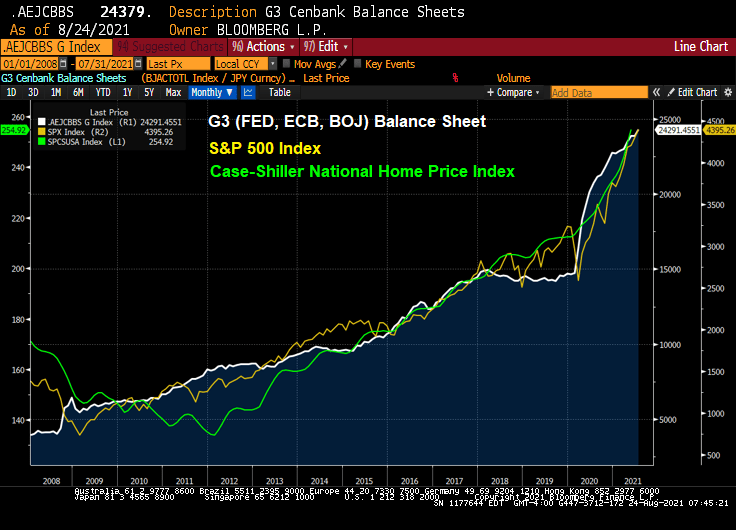
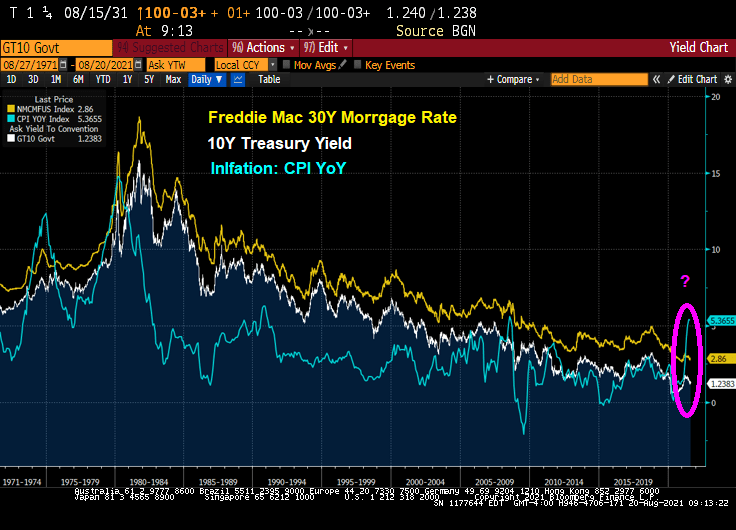
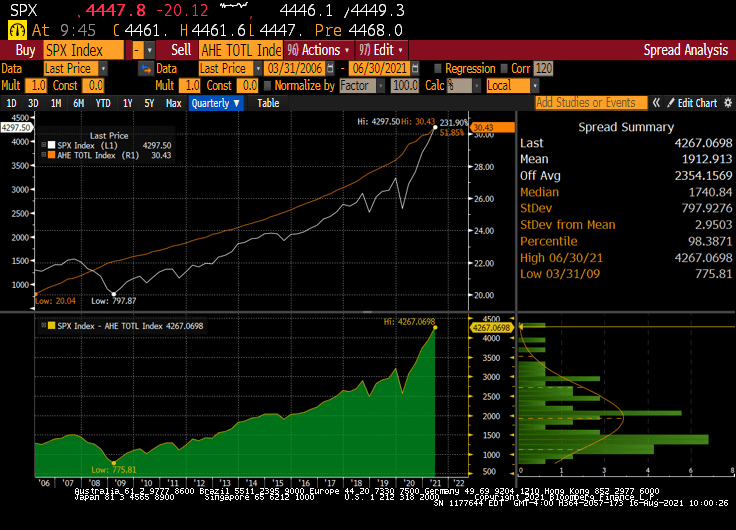
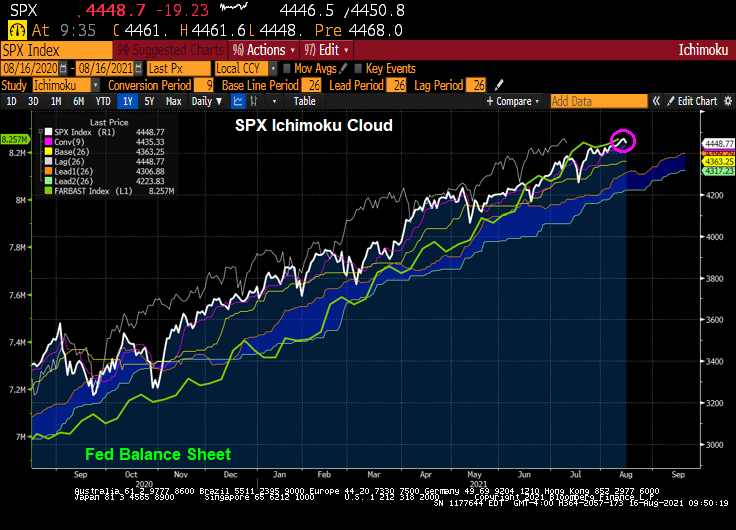
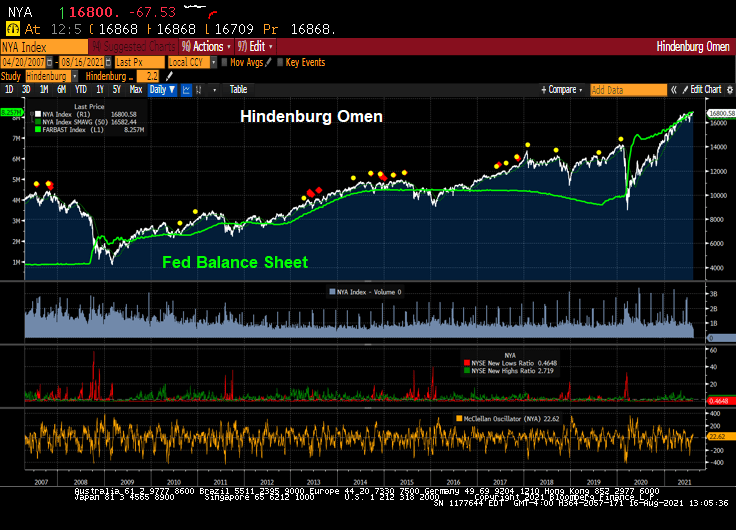
Well, the stock market has zoomed-up since Bernanke and The Fed adopted zero-interest rate (ZIRP) policies and the now famous quantitative easing (QE) policies in late 2008.
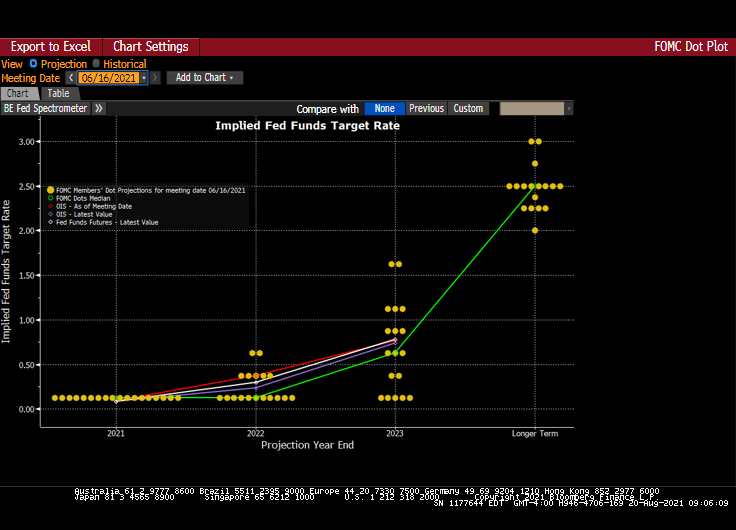
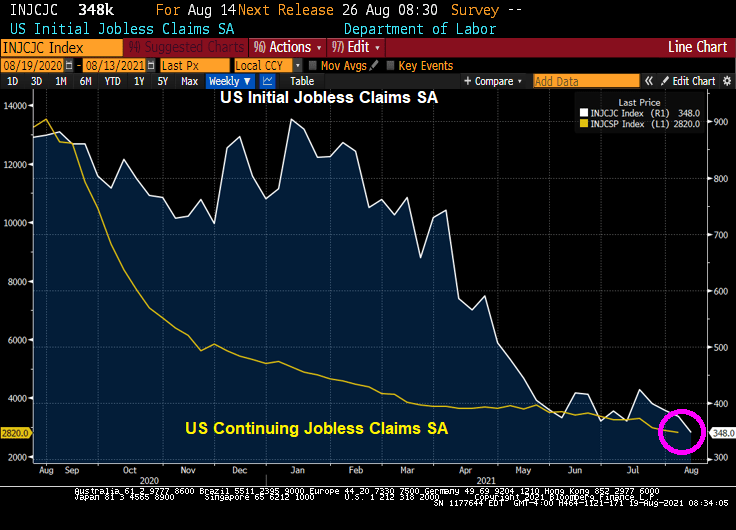
Congress member Alexandria Ocasio-Cortez asked Fed Chair Powell about the Fed helping with US unemployment. We are already at zero rates (on the short-end), and Congress should look at their policies on why labor force participation is slow to recover from the Covid epidemic.
Powell is sounding more and more like Parks and Recreation’s Tom Haverford in terms of schmoozing Congress for support.

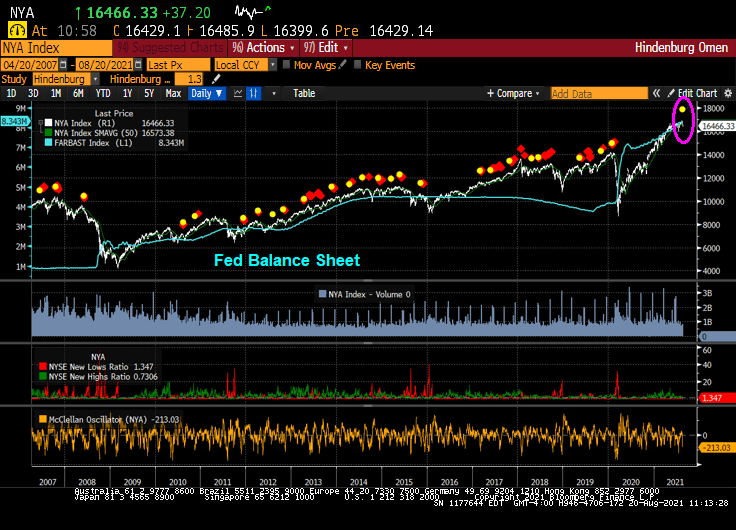
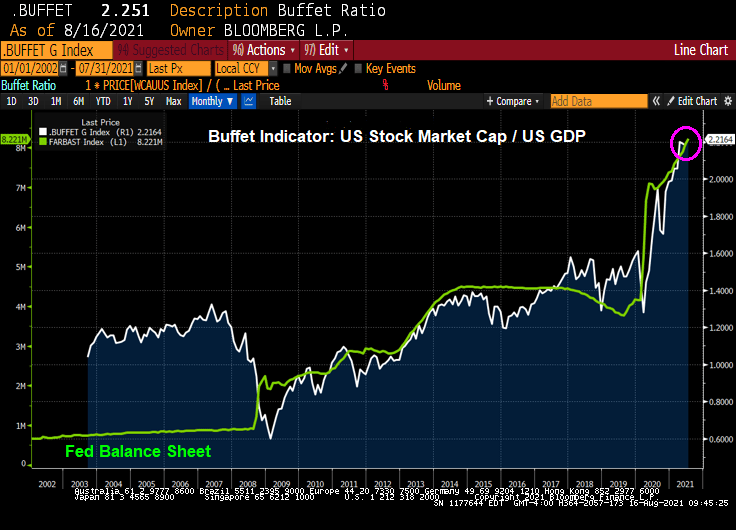
Update: The Mises Stationarity Index is flashing “BUBBLE.”
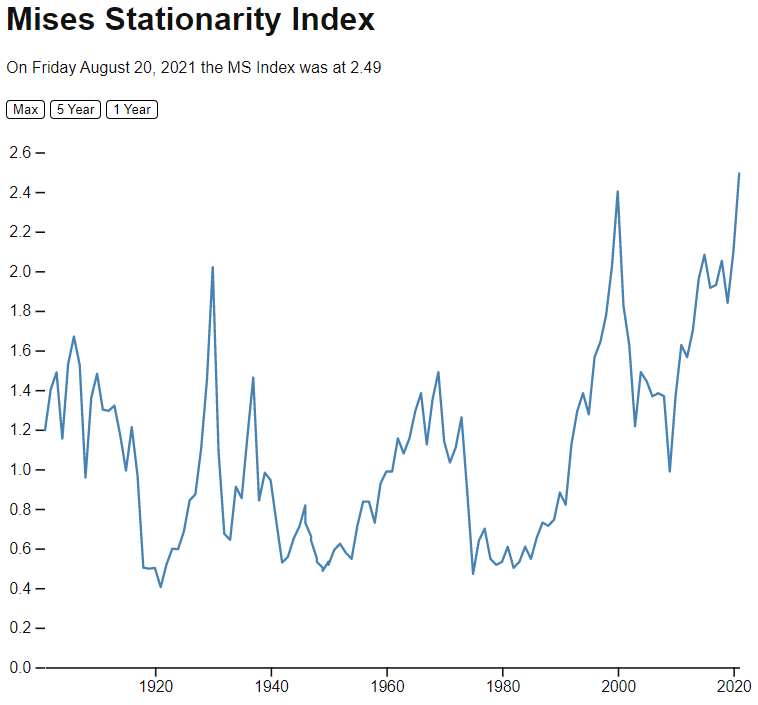
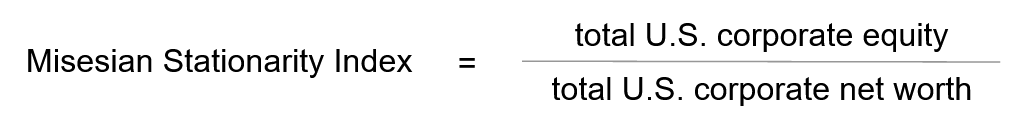
The Mises Stationarity Index is different than the Shiller CAPE index, which is showing equities as being overpriced, but not yet in dot.com bubble zone.


You must be logged in to post a comment.