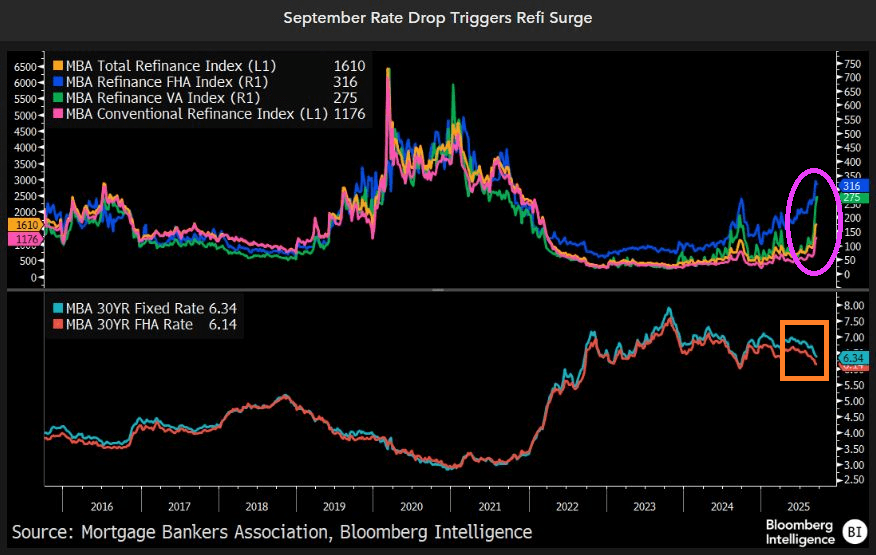
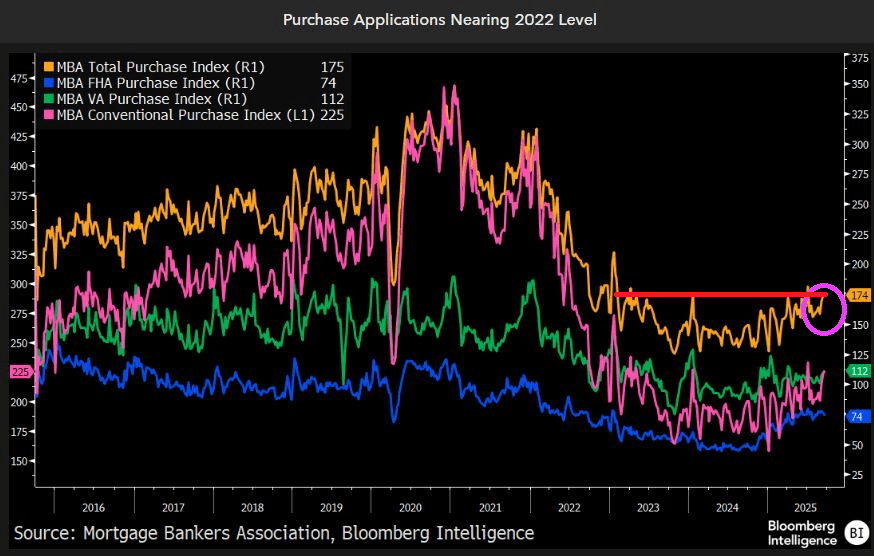
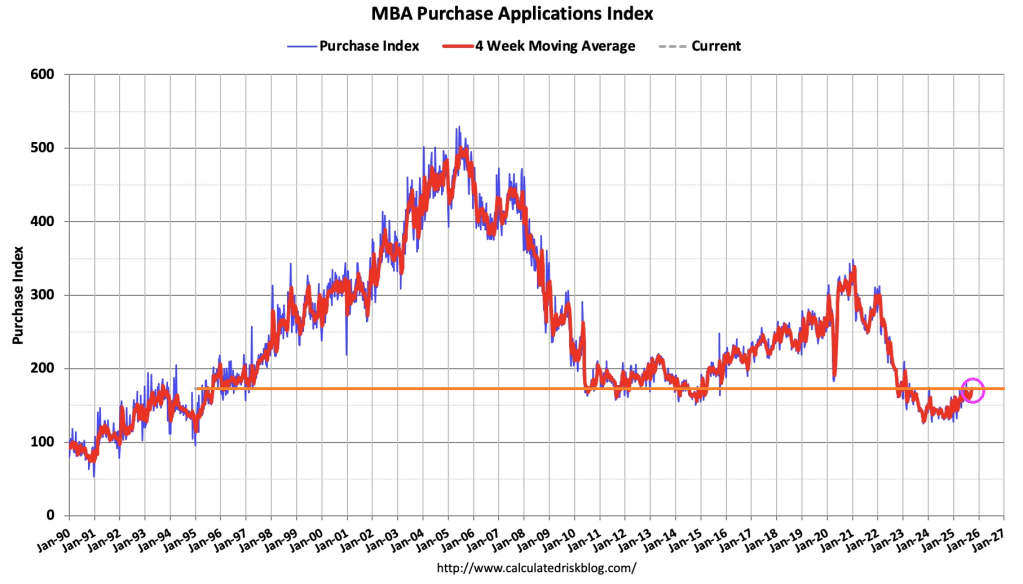
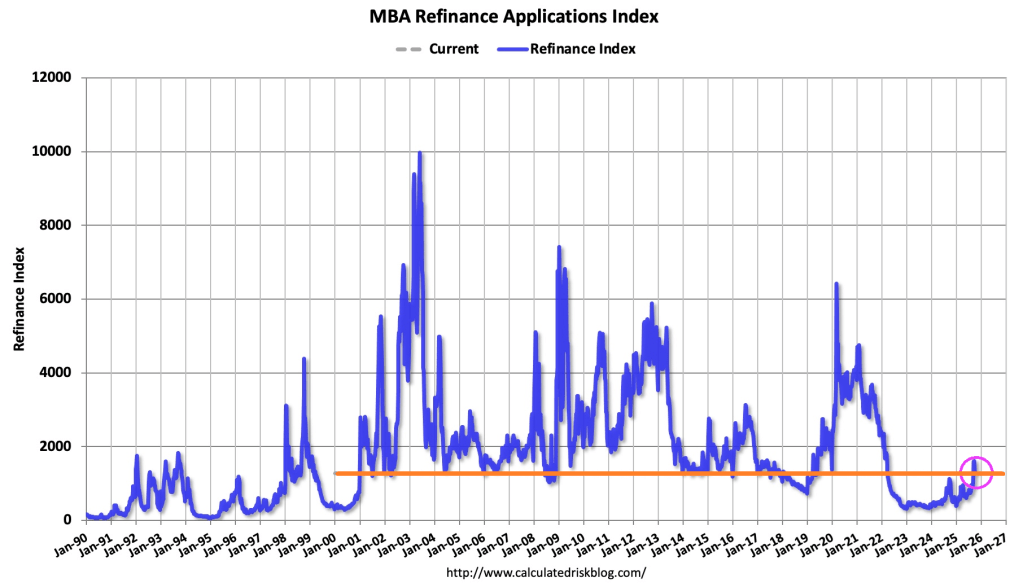
The September drop in mortgage rates is sparking the biggest boom in refinancings since the pandemic. Mortgage-refinancing applications have surged above the decade average, despite that period including the record-breaking refi boom of 2020-21 when rates fell to all-time lows. Purchase-loan demand has also rebounded to its best for this time of year since 2022, yet remains well below pre-pandemic levels.
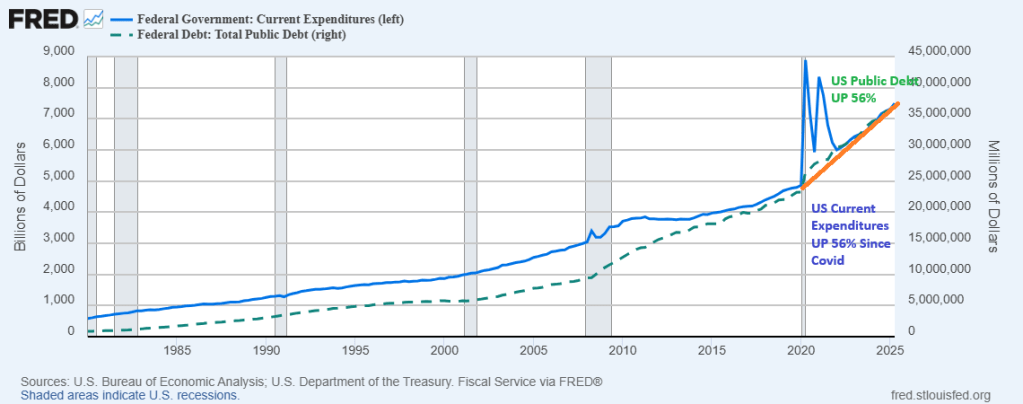
Can we ask the US House and Senate if they will ever return US Federal government spending to pre-Covid levels? Both US Federal government spending and public debt are up 56% since the Covid outbreak in 2020.
The answer is no. Politicians thrive on Federal spending.
Mortgage applications decreased 12.7 percent from one week earlier, according to data from the Mortgage Bankers Association’s (MBA) Weekly Mortgage Applications Survey for the week ending September 26, 2025.
The Market Composite Index, a measure of mortgage loan application volume, decreased 12.7 percent on a seasonally adjusted basis from one week earlier. On an unadjusted basis, the Index decreased 13 percent compared with the previous week. The seasonally adjusted Purchase Index decreased 1 percent from one week earlier. The unadjusted Purchase Index decreased 2 percent compared with the previous week and was 16 percent higher than the same week one year ago.
The Refinance Index decreased 21 percent from the previous week and was 16 percent higher than the same week one year ago.
Mortgage rates increased to its highest level in three weeks as Treasury yields pushed higher on recent, stronger than expected economic data. After the burst in refinancing activity over the past month, this reversal in mortgage rates led to a sizeable drop in refinance applications, consistent with the view that refinance opportunities this year will be short-lived.
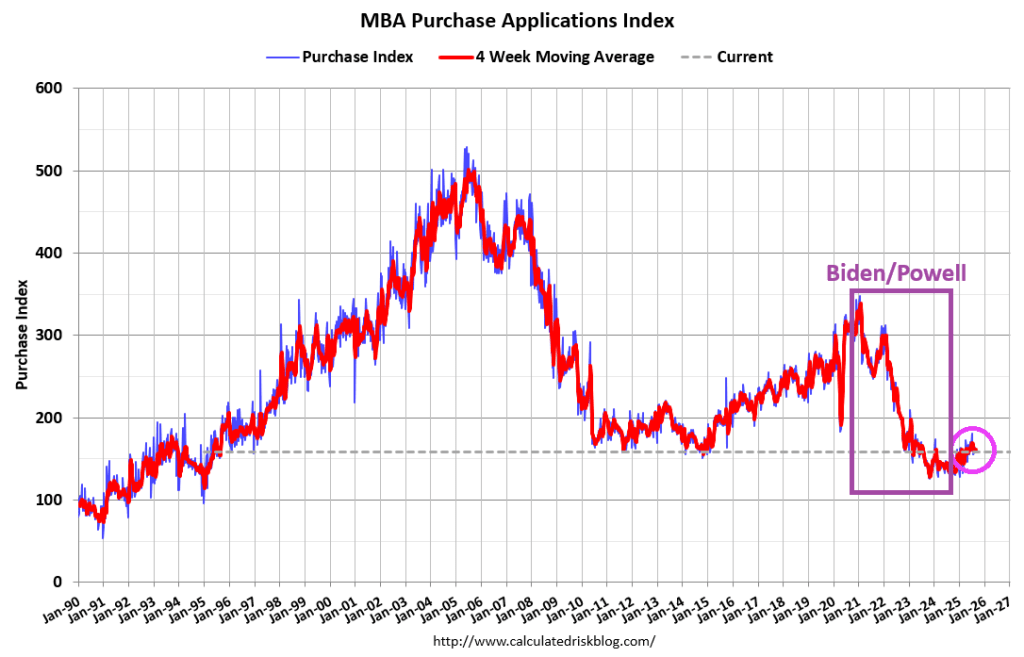
But for last week, mortgage applications increased 9.2 percent from one week earlier, according to data from the Mortgage Bankers Association’s (MBA) Weekly Mortgage Applications Survey for the week ending September 5, 2025. This week’s results include an adjustment for the Labor Day holiday.
The Market Composite Index, a measure of mortgage loan application volume, increased 9.2 percent on a seasonally adjusted basis from one week earlier. On an unadjusted basis, the Index decreased 3 percent compared with the previous week. The seasonally adjusted Purchase Index increased 7 percent from one week earlier. The unadjusted Purchase Index decreased 6 percent compared with the previous week and was 23 percent higher than the same week one year ago.
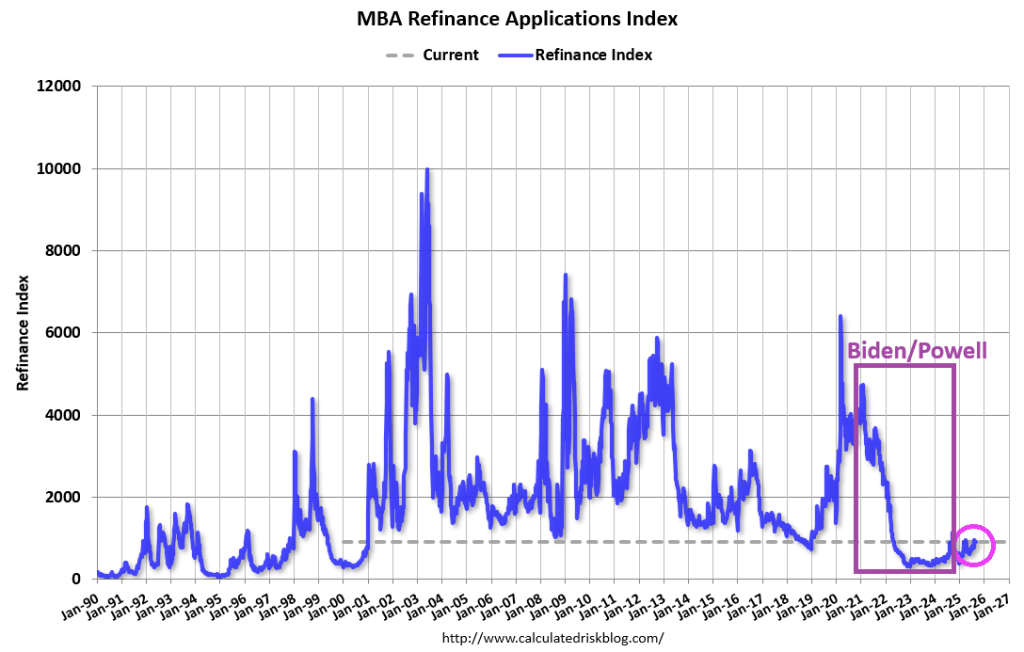
The Refinance Index increased 12 percent from the previous week and was 34 percent higher than the same week one year ago.
The holiday-adjusted refinance index had its strongest week in a year and the average loan size for refinances also increased significantly, since borrowers with large loans are more sensitive to bigger rate moves. Refinance applications accounted for almost 49 percent of all applications last week. … The average contract interest rate for 30-year fixed-rate mortgages with conforming loan balances ($806,500 or less) decreased to 6.49 percent from 6.64 percent, with points decreasing to 0.56 from 0.59 (including the origination fee) for 80 percent loan-to-value ratio (LTV) loans.
Mortgage applications decreased 1.2 percent from one week earlier, according to data from the Mortgage Bankers Association’s (MBA) Weekly Mortgage Applications Survey for the week ending August 29, 2025.
The Market Composite Index, a measure of mortgage loan application volume, decreased 1.2 percent on a seasonally adjusted basis from one week earlier. On an unadjusted basis, the Index decreased 3 percent compared with the previous week. The seasonally adjusted Purchase Index decreased 3 percent from one week earlier. The unadjusted Purchase Index decreased 6 percent compared with the previous week and was17 percent higher than the same week one year ago.
The Refinance Index increased 1 percent from the previous week and was 20 percent higher than the same week one year ago.
Mortgage rates declined last week, with the 30-year fixed rate decreasing to its lowest level since April to 6.64 percent. However, that was not enough to spark more application activity. The average contract interest rate for 30-year fixed-rate mortgages with conforming loan balances ($806,500 or less) decreased to 6.64 percent from 6.69 percent, with points decreasing to 0.59 from 0.60 (including the origination fee) for 80 percent loan-to-value ratio (LTV) loans.
But don’t get your hopes up about The Fed saving the housing market.
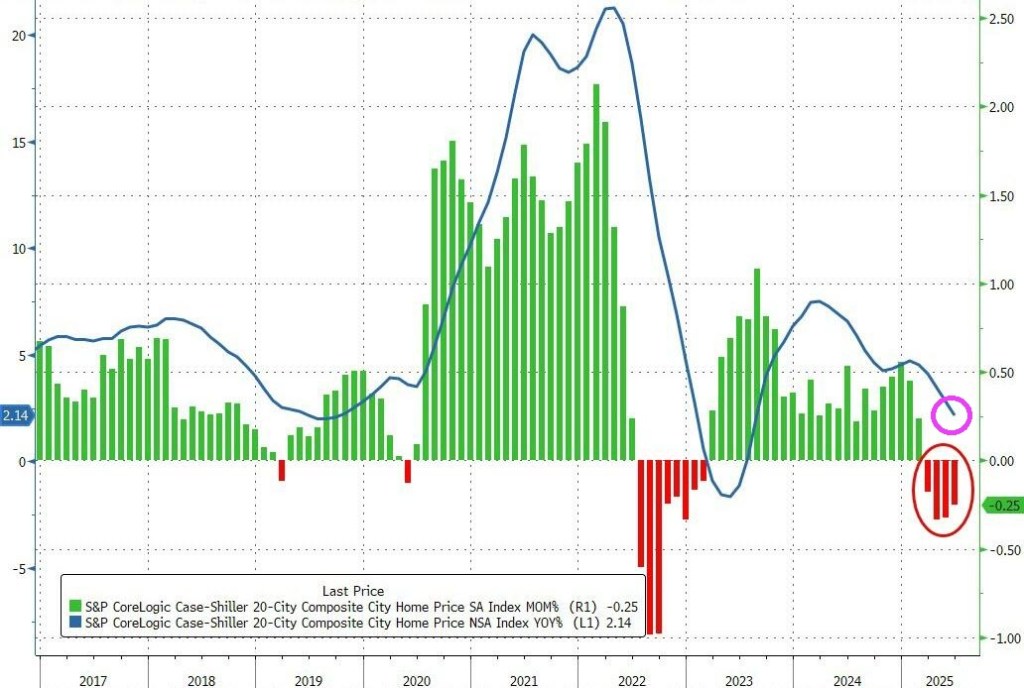
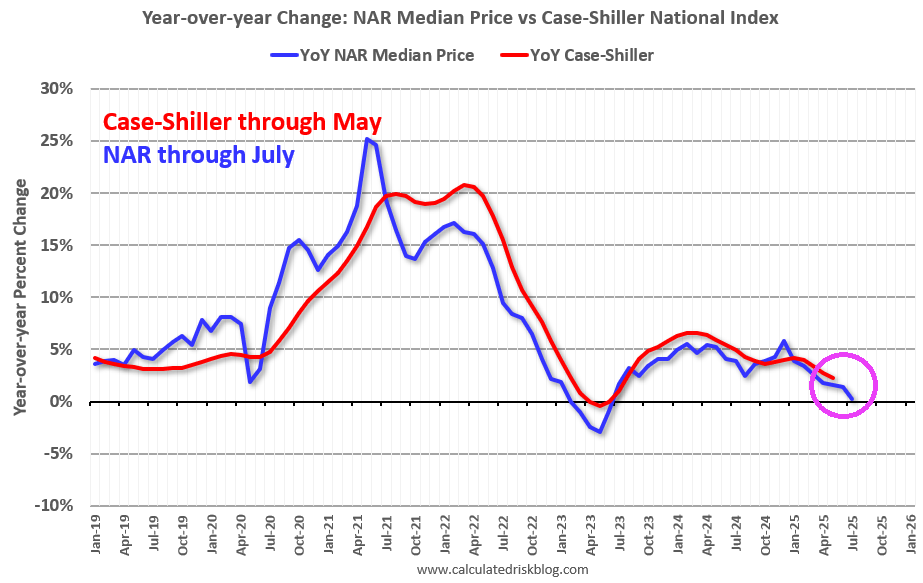
Home prices in America’s 20 largest cities fell for the 4th straight month in June (the latest data available from S&P CoreLogic’s Case-Shiller data released this morning).
The -0.25% MoM drop was larger than expected and dragged the YoY price growth down to +2.15% – the weakest since July 2023.
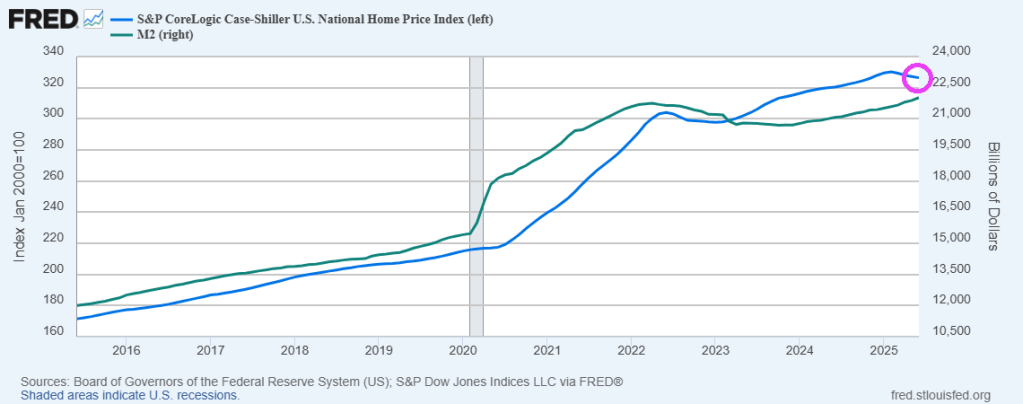
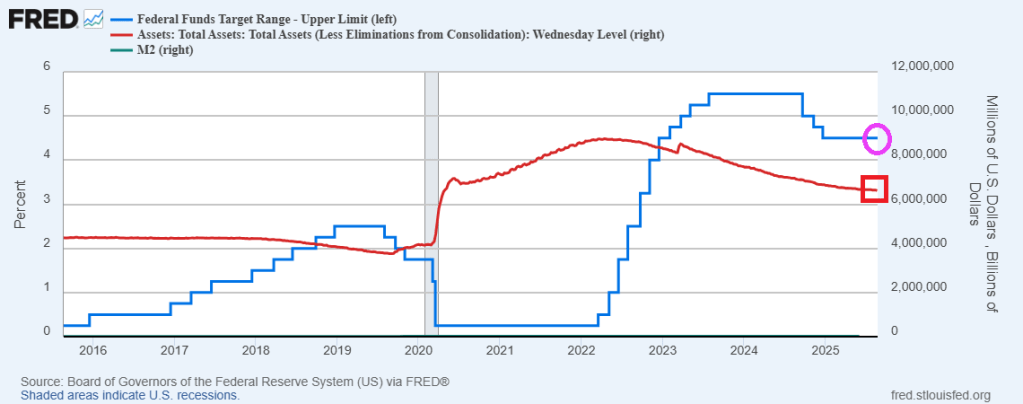
Meanwhile The Federal Reserve keeps on printing money, helping to drive up home prices.
,Metro level? New York and Chicago lead, with Phoenix, Miami, Denver, San Diego, Dallas, San Francisco and Tampa all experiencing price declines.
On a side note, Chicago is even more unaffordable than last year. So much for Mayor Brandon Johnson saying there would be no crime if everyone could afford housing (one of the stupidest comments I have ever heard).
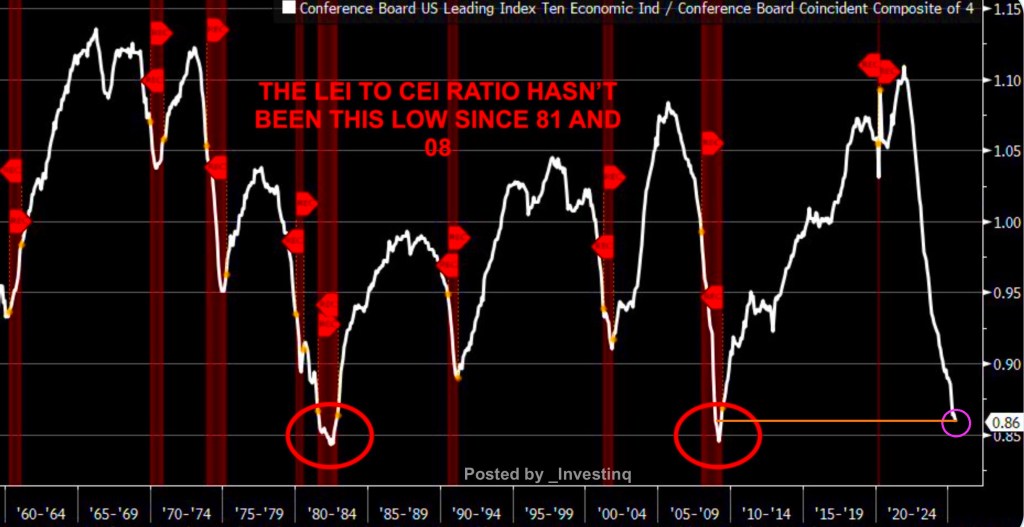
The Fed will have to whip it good with rate cuts if the recession warnings are an indicator of what lies ahead for the US economy.
The ratio of The Conference Board’s Leading Economic Indicators (LEI) vs. The Conference Board’s Coincident Economic Index (CEI) ratio hasn’t been this low since 2008.
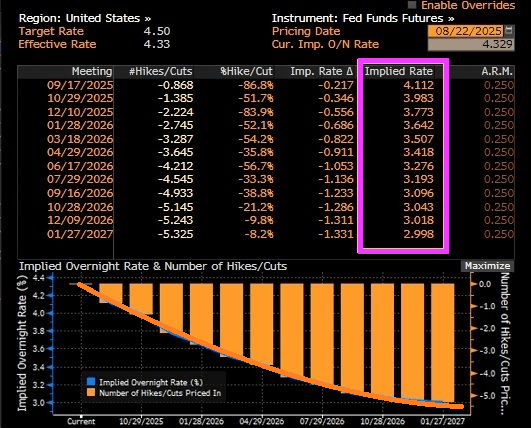
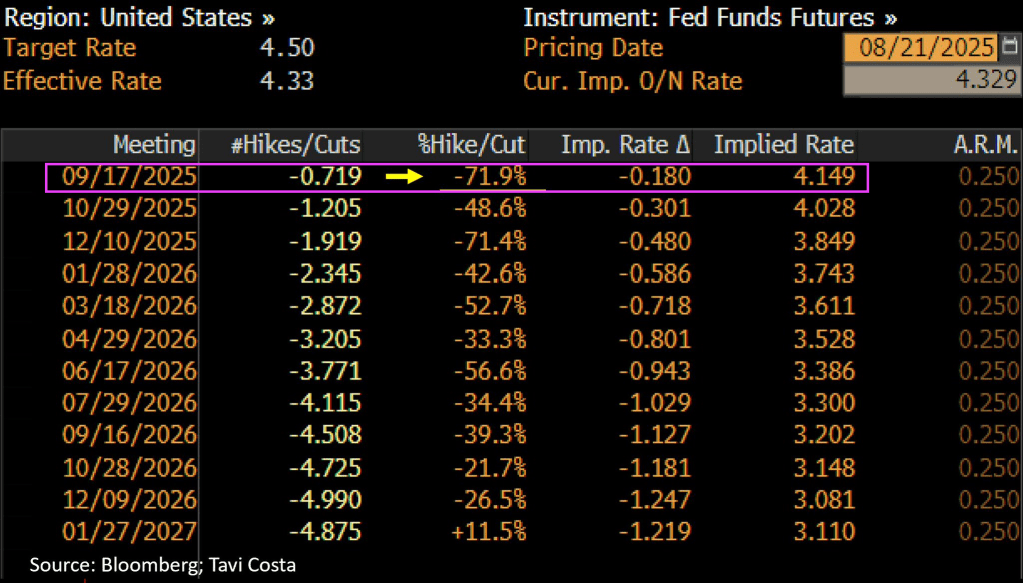
Fed Funds Futures are signalling rate cuts at the September 17th FOMC meeting and December 10th meetings.
Month-over-month sales increased in the Northeast, South, and West, and fell in the Midwest. Year-over-year, sales rose in the South, Northeast, and Midwest, and fell in the West.
• 2.0% increase in existing-home sales – seasonally adjusted annual rate of 4.01 million in July.
• Year-over-year: 0.8% increase in existing-home sales
Median existing-home price for all housing types, up 0.2% from one year ago ($421,400) – the 25th consecutive month of year-over-year price increases.
It will be hard to make housing more affordable as long as The Fed keeps printing money.
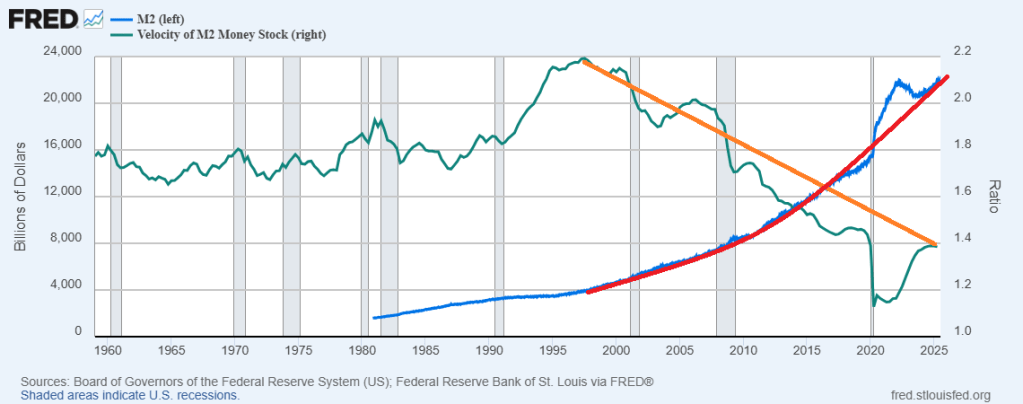
Powell et al cutting rates 25 basis points won’t really matter as long as they continue to print money. Unfortunately, M2 VELOCITY peaked under the Clinton Administration and has declined since despite frantic money printing.
What happended in 1995? Clinton’s National Homeownership Strategy that mandated HUD partners (GNMA, FHA, Fannie Mae, Freddie Mac, banks, etc.) to lower credit standards to encourage homeownership.
We need FHFA Director Bill Pulte to avoid doing what Democrats love (everything free or cheap).


You must be logged in to post a comment.