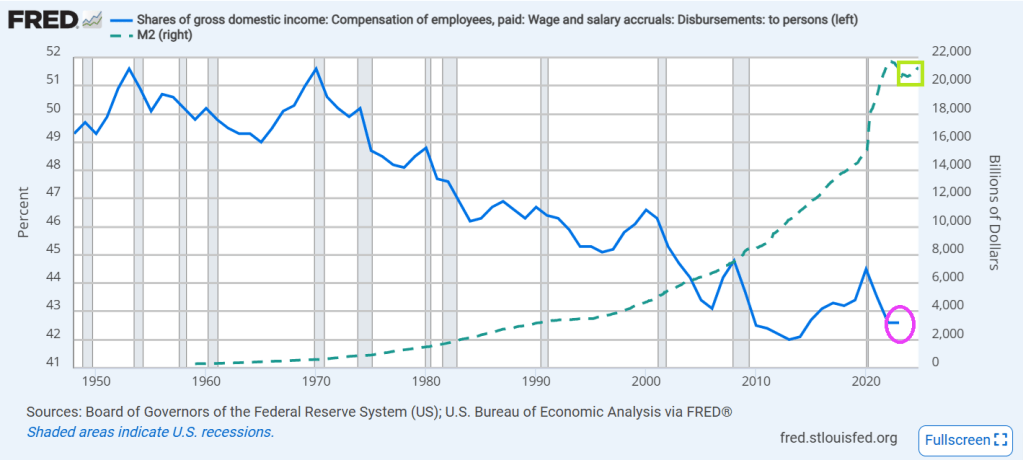
Wage and salary income as a percentage of GDP has fallen from over 50% back in 1970 to 43.1% in 2022. And look at the post Covid decline! And the increase in M2 Money.
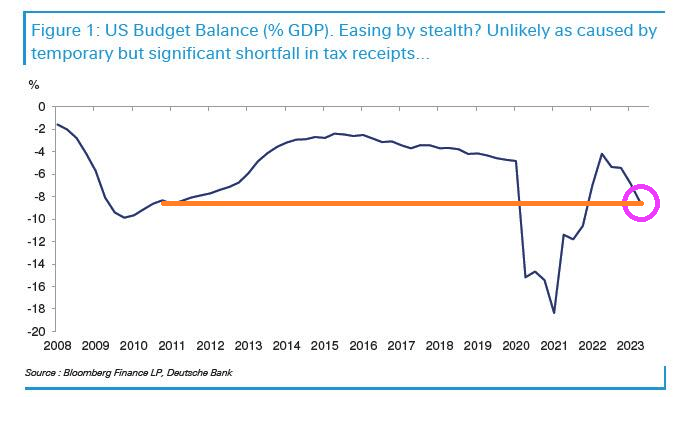
Meanwhile the US budget balance as a % of GDP has been plunging downwards in recent years.
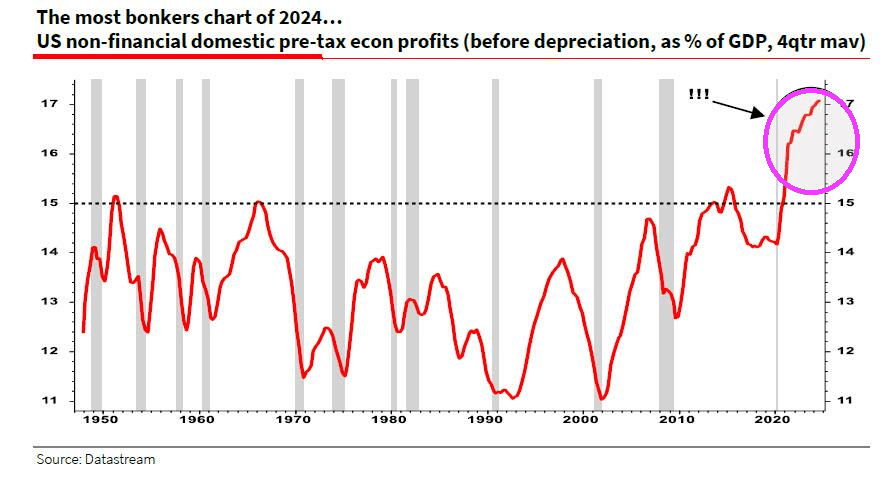
Despite the slowing economy, pre-tax profits post Covid have SOARED!
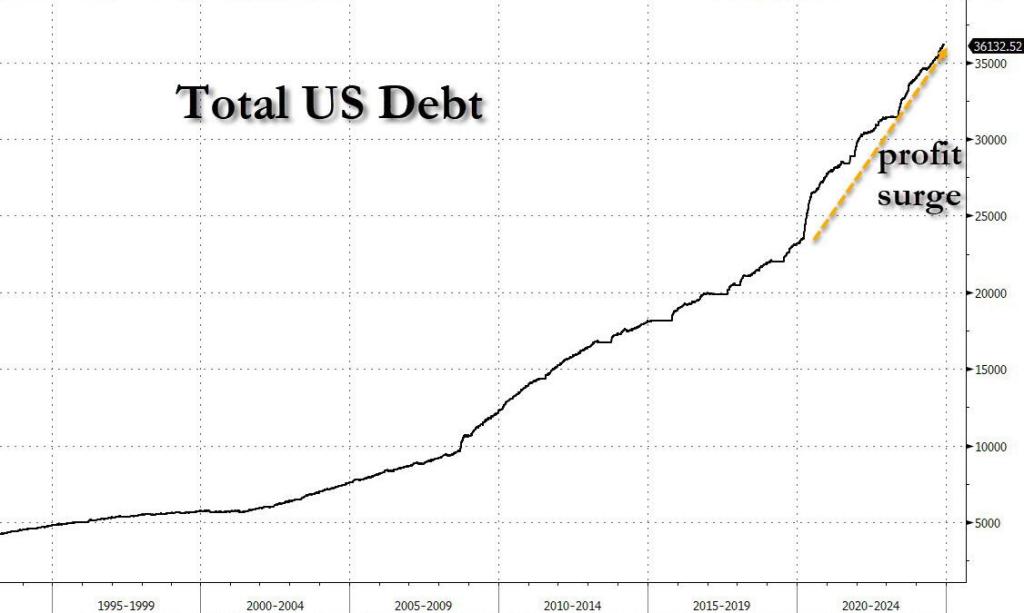
Primarily due to reckless/wasteful Federal spending and FEDERAL DEBT that soared.
There you have it! The Biden/Harris economic “miracle” was simply Federal government malspending that benefitted large corporations and few people.
Joe Biden and his woefully corrupt son Hunter of laptop fame.
Joe Biden is leaving the Presidency with an attrocious record. While saying he is leaving Trump with the strongest economy in modern times, the is actually leaving Trump and Republicans with a hollow shell for an economy. It is the final punch in the jaw from an angry, failed President.
The following chart shows that in October and November, the US deficit exploded to a staggering $624.2 billion, and even though this included several calendar adjustments – which explains the freak September surplus which as we said was due to calendar effects – the November deficit of $367 billion was $14 billion more than consensus estimates of $353 billion. Worse, combining October and November we find that not only was the combined number of $624 billion some 64% higher than the corresponding period one year ago, but it was also the highest deficit on record for the first two-months of the year (and that includes the spending insanity during the covid crisis).
Putting the deficit in context, the budget deficit in October and November – the first two months of fiscal 2025 – are now officially the worst start a year for the US Treasury on record.
No wonder even Statist Janet Yellen (Treasury Secretary who failed utterly at her job) apologized that her abysmal performance. “I am concerned about fiscal sustainability and I am sorry that we haven’t made more progress,” she said adding that “I believe that the deficit needs to be brought down especially now that we’re in an environment of higher interest rates.” Meanwhile Biden keeps handing out $$$ to Ukraine, Africa, Syria, illegal immigrants and anything else that asks … unless it it American citizens. Man, does Biden HATE America!
Here is Yellen’s record on debt. A total of $15.2 TRILLION under her leadership.
Under Biden/Yellen (don’t forget Senate fools like Schumer and McConnell!), debt interest has surpassed Social Security and Medicare as the second largest government agency expense.
Biden is a classic progressive Democrat, spending other people’s money like a wild man (sort of like California Governor “Greasy Gavin” Newsom’s father. Or grandfather. And let’s not forget the $222 TRILLION in UNFUNDED liabilities such as Social Security and Medicare.
“See Joe, I can destroy California’s economy just like you destroyed the US economy!”
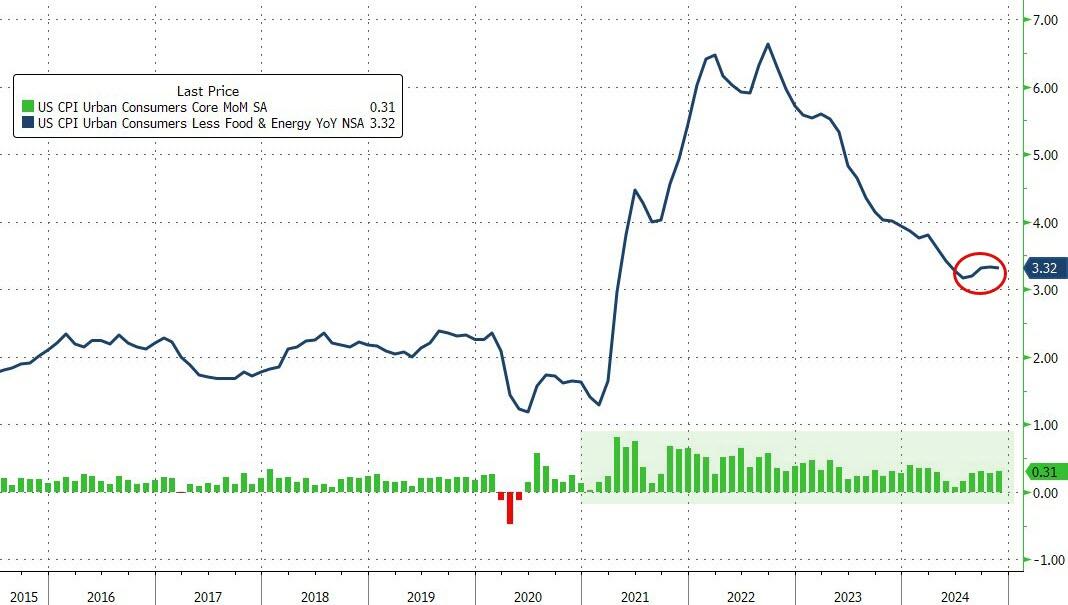
October STICKY core inflation is still up 4% YoY (year-over-year)
Core CPI rose 0.3% MoM (as expected) which pushed it up 3.3% YoY (not even close to the 2% mandate)…
Source: Bloomberg
There has not been a single monthly decrease in core consumer prices since Biden too office.
dddd
Between The Fed’s insane monetary policy and Biden/Harris insane fiscal policies, we are living in a world where Ray Bradbury’s novel Fahrenheit 451 becomes a reality. Instead of books burning, it is the US Dollar burning.
The delinquency rate for commercial mortgage-backed securities (CMBS) tied to office properties reached 10.4 percent in November 2024, approaching the 10.7 percent peak reached during the 2008 financial crisis. The ascent is the fastest two-year increase on record, with rates climbing 8.8 percentage points since late 2022, significantly outrunning the 6.3-point rise seen during the financial crisis nearly 15 years ago.
The office real estate sector has been grappling with a severe downturn for several years now, but are accelerating recently as they are driven by persistently high vacancy rates and declining rents. Property values, particularly for older office buildings, have plummeted, with many losing 50 to 70 percent of their market value and in some cases becoming effectively worthless. Those conditions have left real estate portfolio managers and building owners unable to borrow, refinance or sell properties, contributing to rising delinquencies and foreclosures. (Mortgages become effectively delinquent when payments are missed beyond a standard 30-day grace period.)
On the CMBS front, there have been no upgrades in 2023 and 2024.
Efforts to convert office buildings into residential spaces are increasing but remain limited by structural and economic constraints. Many office towers are unsuitable for conversion due to their large floor plates or prohibitively high retrofitting costs which often exceed the cost of demolition and rebuilding. In 2024, 73 office-to-residential conversions were completed, with an additional 30 underway. Despite plans to increase the pace in 2025, the cumulative impact remains minimal, addressing just 7.9 percent of the 902 million square feet of vacant office space nationwide.
NEW YORK, NOVEMBER 26, 2024: S&P Dow Jones Indices (S&P DJI) today released the September 2024 results for the S&P CoreLogic Case-Shiller Indices. The leading measure of U.S. home prices recorded a 3.9% annual gain in September 2024, a slight deceleration from the previous annual gains in 2024.
YEAR-OVER-YEAR The S&P CoreLogic Case-Shiller U.S. National Home Price NSA Index, covering all nine U.S. census divisions, reported a 3.9% annual return for September, down from a 4.3% annual gain in the previous month. The 10-City Composite saw an annual increase of 5.2%, down from a 6.0% annual increase in the previous month. The 20-City Composite posted a year-over-year increase of 4.6%, dropping from a 5.2% increase in the previous month. New York again reported the highest annual gain among the 20 cities with a 7.5% increase in September, followed by Cleveland and Chicago with annual increases of 7.1% and 6.9%, respectively. Denver posted the smallest year-over-year growth with 0.2%.
Table 2 below summarizes the results for September 2024. Cleveland and New York top 7% YoY.
Longer-term inflation jumped to their highest since June 2008, according to the latest UMich Sentiment survey, while short-term inflation expectations dropped to four year lows…
Housing sentiment (buying conditions for housing) remains depressed under Biden/Harris “Reign of (economic) error.”
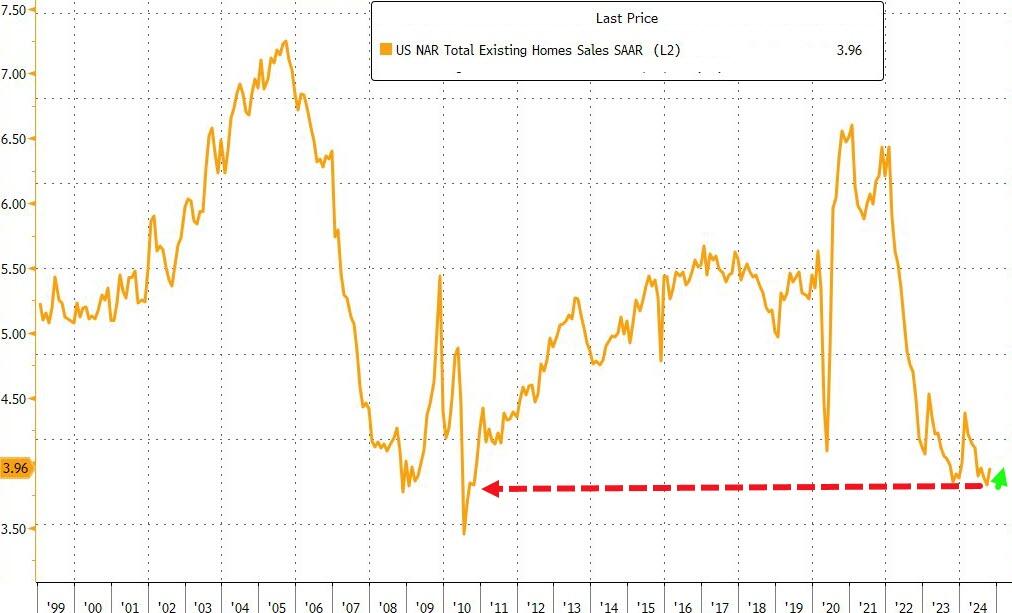
Here is a picture depicting the assassination of the US housing market.
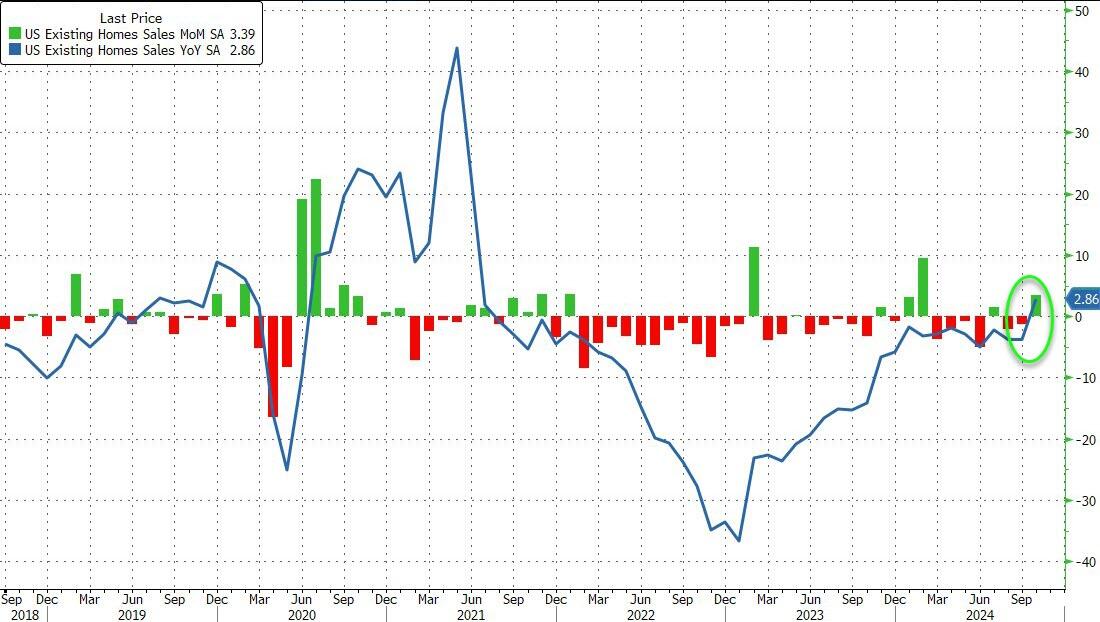
…but in context, that shift up to 3.96mm SAAR homes sold is nothing…
Source: Bloomberg
High borrowing costs have led to a shortage of previously owned homes on the market, discouraging many would-be home sellers from listing their properties for sale and having to part with their current low financing costs.
“Additional job gains and continued economic growth appear assured, resulting in growing housing demand,” NAR Chief Economist Lawrence Yun said in a prepared statement.
“While mortgage rates remain elevated, they are expected to stabilize.”
Last month, the inventory of available homes edged up 0.7% to 1.37 million, continuing to trend higher although well below pre-pandemic levels.
Despite the weakness in sales, tight inventory is keeping prices elevated, yielding one of the least affordable housing markets on record. The median sale price last month increased 4% from a year earlier to $407,200, the highest ever for any October, the NAR figures show.
Contract signings rose in all four US regions, led by a 6.7% jump in the Midwest.
Sales of single-family homes increased 3.5% in October; purchases of condominiums and co-ops were up 2.7%
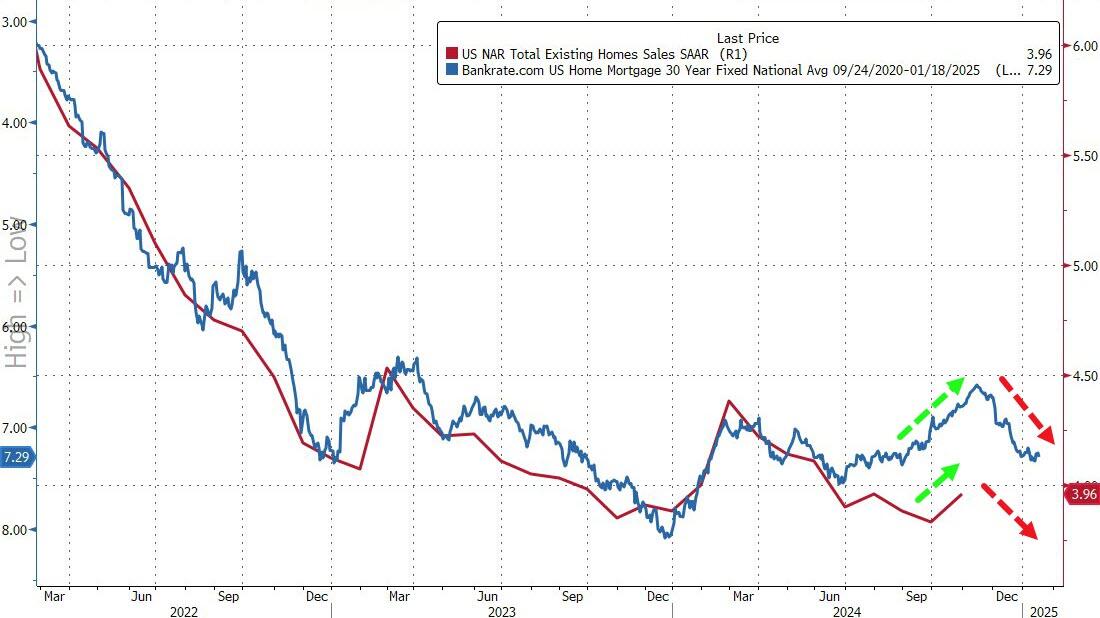
Finally, while that’s all very exciting – a scintilla of growth off almost record lows – the fecal matter is about to strike the rotating object as rising mortgage rates lagged impact threatens…
Source: Bloomberg
In October, 59% of homes sold were on the market for less than a month, compared with 57% in September, and 19% sold above the list price. Properties remained on the market for 29 days on average, compared with 28 days in the previous month. First-time buyers made up 27% of purchases, still historically low.
Fortunately, the Biden/Harris administration is winding down. On the mortgage side, the mortgage market is already gone under Biden/Harris where mortgage purchase applications are down a whopping 60%.
Mortgage applications increased 1.7 percent from one week earlier, according to data from the Mortgage Bankers Association’s (MBA) Weekly Mortgage Applications Survey for the week ending November 15, 2024.
The Market Composite Index, a measure of mortgage loan application volume, increased 1.7 percent on a seasonally adjusted basis from one week earlier. On an unadjusted basis, the Index decreased 1 percent compared with the previous week. The seasonally adjusted Purchase Index increased 2 percent from one week earlier. The unadjusted Purchase Index decreased 3 percent compared with the previous week and was 1 percent lower than the same week one year ago. And down -60% under Biden/Harris.
The Refinance Index increased 2 percent from the previous week and was 43 percent higher than the same week one year ago.
Slowing economy, rising rates, too expensive housing. Not a good sign for the mortgage market.
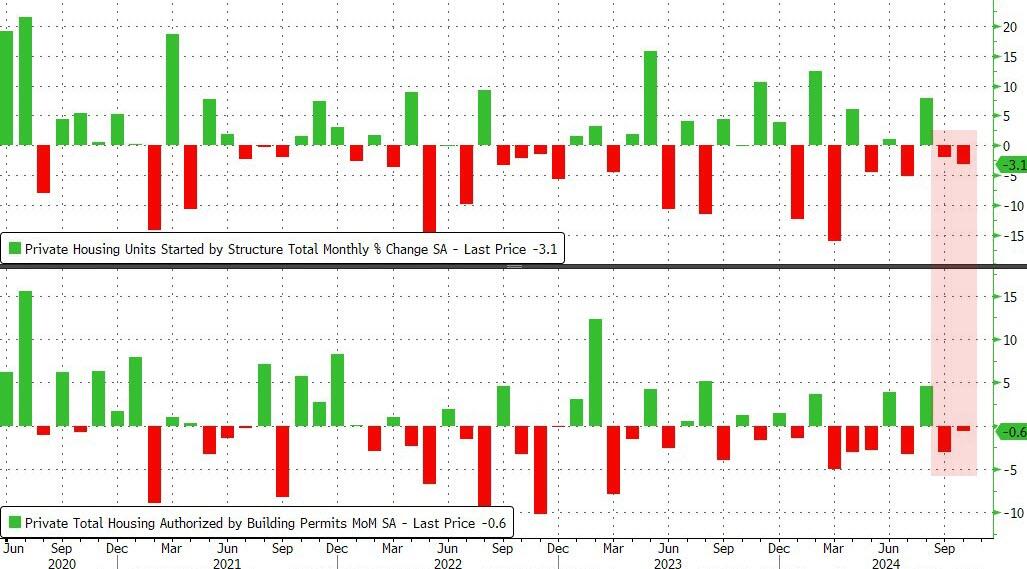
As Biden/Harris approve of Ukraine launching missiles against Russia risking nuclear war, we are witnessing a slow down in the US economy. This time, housing starts and permits.
US Housing Starts and Building Permits disappointed in October with the former dropping 3.1% MoM (-1.5% exp) and -0.6% MoM (+0.7% exp) respectively. This is the second straight month of declines for both measures of housing activity.
Source: Bloomberg
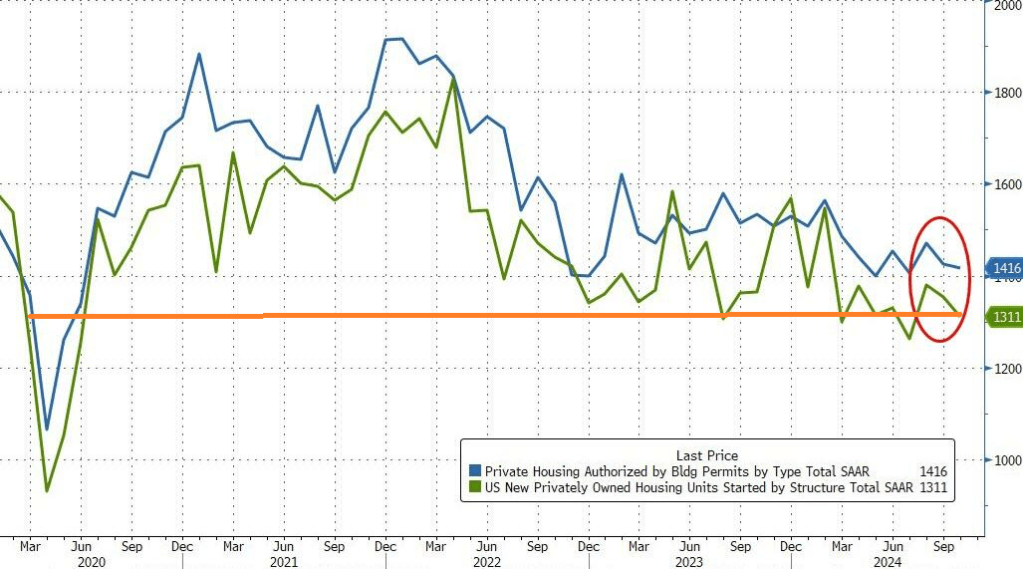
That pulled the SAAR totals down to four month lows – hovering just above COVID lockdown levels…
Source: Bloomberg
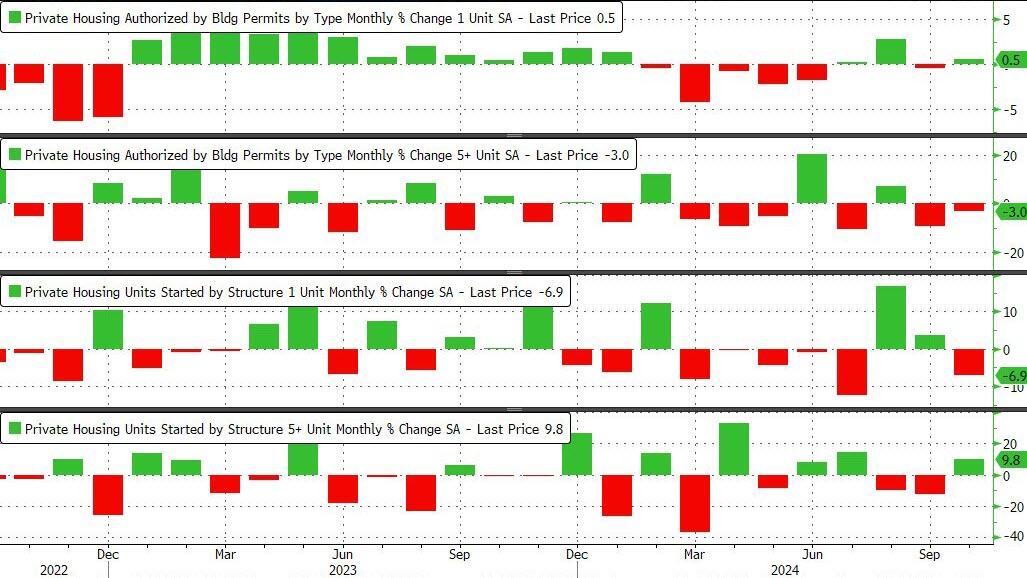
Under the hood, it was very mixed with Single-family permits rising and multifamily permits dropped. Single-family Starts plunged while multi-family Starts jumped…
Source: Bloomberg
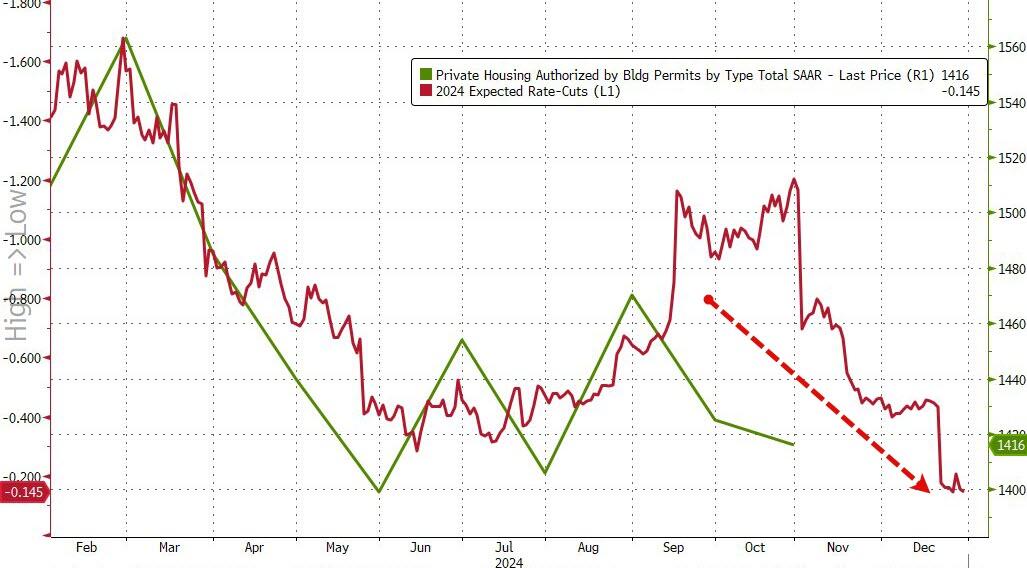
As rate-cut expectations have fallen, so have homebuilders actions it seems…
Source: Bloomberg
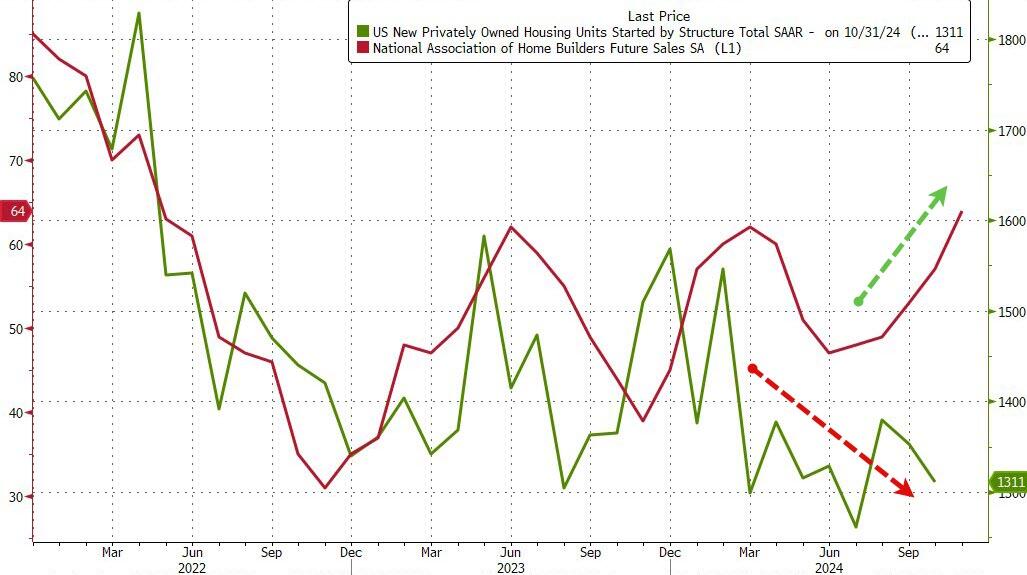
But homebuilder ‘hope’ remains high…
Source: Bloomberg
With Trump back in charge, how much will Powell and his pals really want to cut rates now?
The US Treasury yield curve (10Y-2Y CMT) went negative on April 1, 2024. And remains positive.
The US Treasury 10Y-2Y CMT (constant maturity Treasury) peaked locally on March 29, 2024 and then fell, eventually turning negative on April 1, 2024. And remained negative until August 30, 2024 just prior to the election. It looks like the yield curve accurately predicted the election of Trump.
The 10-year Treasury yield is rising with a positive economic outlook under Trump. And with that optimism we see mortgage rates rising too.


You must be logged in to post a comment.